DOI : http://dx.doi.org/10.5394/KINPR.2016.40.5.271
Tropospheric Anomaly Detection in Multi-Reference Stations Environment during Localized Atmospheric Conditions-(2) :
Analytic Results of Anomaly Detection Algorithm
†Yun-Ja Yoo
† Former Researcher of Korean Register, Busan 46762, Korea
Abstract: Localized atmospheric conditions between multi-reference stations can bring the tropospheric delay irregularity that becomes an error terms affecting positioning accuracy in network RTK environment. Imbalanced network error can affect the network solutions and it can corrupt the entire network solution and degrade the correction accuracy. If an anomaly could be detected before the correction message was generated, it is possible to eliminate the anomalous satellite that can cause degradation of the network solution during the tropospheric delay anomaly. An atmospheric grid that consists of four meteorological stations was used to detect an inhomogeneous weather conditions and tropospheric anomaly applied AWSs (automatic weather stations) meteorological data. The threshold of anomaly detection algorithm was determined based on the statistical weather data of AWSs for 5 years in an atmospheric grid. From the analytic results of anomaly detection algorithm it showed that the proposed algorithm can detect an anomalous satellite with an anomaly flag generation caused tropospheric delay anomaly during localized atmospheric conditions between stations. It was shown that the different precipitation condition between stations is the main factor affecting tropospheric anomalies.
Key words: Tropospheric anomaly detection, Atmospheric grid, Anomaly flag, Delta troposphere zenith total delay, Delta troposphere slant delay
†Corresponding author : [email protected]
1. Introduction
Tropospheric anomaly can be caused by localized atmospheric conditions between reference stations in network RTK (real-time kinematic) environment, and it becomes one of the limiting factors for precise positioning(Ahn, 2007; Han, 2014). Inhomogeneous atmospheric conditions can affect the network solution and an imbalanced network error can degrade the correction message to rover station. It has been studied for the integrity monitoring and correction technique of high performance DGPS solution during tropospheric delay anomaly caused by localized atmospheric conditions (Cho, 2007; Kim, 2012; Seo, 2009; Shin, 2013; Yoo, 2011), and it is critical issue to detect an anomalous satellite that can degrade the correction accuracy during inhomogeneous atmosphere conditions in network RTK environment.
Atmospheric grid was introduced to detect the tropospheric delay anomaly during inhomogeneous weather conditions between stations. One atmospheric grid has four reference stations and each station can use the meteorological data from AWSs (automatic weather stations). The troposphere ZTD (zenith total delay)
difference will be similar at four stations if there was no tropospheric anomaly. However, the troposphere ZTD between stations will be different if the atmospheric conditions are different at station. LPP (low performance point) is the most ambiguous position from four stations in one atmospheric grid. The troposphere SD (slant delay) projected an elevation at LPP depends on the troposphere ZTD at each reference station which means the localized weather conditions can affect the troposphere SD at LPP because the tropospheric delay at LPP is estimated using the meteorological data from four reference stations. If the difference of troposphere ZTD between stations (hereafter, delta troposphere ZTD) could be monitored, the tropospheric delay anomaly at LPP can be detected using the AWSs data.
AWSs data from 2006 to 2010 was analyzed for the
threshold determination of anomaly detection algorithm. The
meteorological data occurred imbalanced weather condition
between stations from summer season was used to evaluate
the anomaly detection algorithm. From the anomaly
detection results, an anomaly flag was generated on the
anomalous satellite and it was shown that the precipitation
imbalance between stations can be the main factor that can
Region Latitude Longitude Height
RS1 N36.633° E127.433° 56.4m
RS2 N36.483° E127.733° 173m
RS3 N35.917° E127.15° 61m
RS4 N36.267° E126.917° 11m
LPP N36.367° E127.367° 62.6m
cause the tropospheric delay anomaly and has strong relation on anomaly detection results.
2. Outline of atmospheric grid
2.1 Selected AWSs
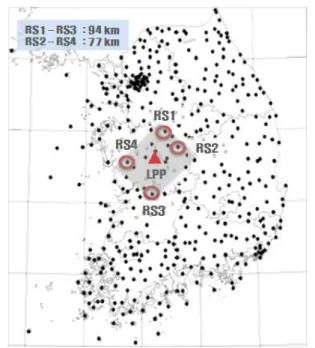
In order to evaluate the proposed algorithm, the atmospheric grid consisted of the meteorological stations needs at least three stations, but it considered four stations that consist of one atmospheric grid. Korea meteorological administration (KMA) has a maximum distance of 100 km between the stations among over 500 AWSs(KMA, 2012). If the grid size is smaller, it is better to collect the meteorological data to estimate more accurate troposphere ZTD at LPP, which is the farthest point from all the stations assumed to be the most ambiguous point in the grid.
Fig. 1 shows one atmospheric grid consisting of four selected meteorological stations. The LPP is located in the middle of the atmospheric grid. Table 1 shows the longitude, latitude and the height data of the selected AWSs’ position with the station ID, which RS1 is Cheongju (Cheo) station, RS2 is Boeun (Boeu) station, RS3 is Jeonju (Jeon) station, RS4 is Buyeo (Buye) station, respectively.
The atmospheric grid is within 100 km, and Daejeon (Daej) station is selected as the LPP. From the position of the LPP, two stations of RS2 (Boeu), RS4 (Buye) can be selected making an almost straight line from the LPP.
Fig. 1 Atmospheric grid consisting of four AWSs (RS1 ~ RS4) and LPP station
Table 1 AWSs’ position
Statistical meteorological data of pressure, temperature and humidity from 2006-2010 was gathered in order to obtain a daily mean data from AWSs, which are approximately 77km (Boeu-Buye), and 94km (Cheo-Jeon) apart from each other.
2.2 Threshold determination
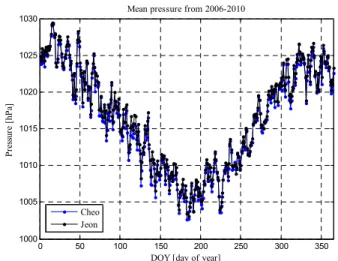
Fig. 2 shows the statistical data of Boeu and Buye meteorological stations. Fig. 2(a), (b) show the daily mean pressure data at Boeu and Buye, respectively. During the summer season from day 150 to 250, it shows comparatively low pressure below 1010 [hPa]. It demonstrates a similar trend at four sites all over the year. Fig. 2(c), (d) show the daily mean temperature and it indicates a high temperature around day 150 to day 250 during the summer season. Boeu station shows a lower mean temperature compared to the Buye station throughout the whole year in Fig. 2(c). Fig. 2(e), (f) show the daily mean relative humidity, and both results show high humidity around day 170 to day 280. Boeu station has a lower humidity around day 90 to day 130, and becomes higher around day 200 to day 300 compared to Buye station.
Jeon station has relatively high humidity compared to Cheo station throughout the year.
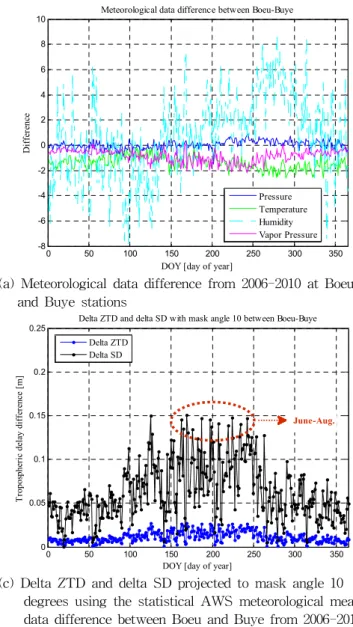
From the results of Fig. 2, the differences of meteorological data between Boeu-Buye and Cheo-Jeon are shown in Fig.
3(a), (b). In Fig. 3(a) the meteorological data of pressure and vapor pressure show a large difference around day 200 to 250.
The temperature data has a large difference around day 250
to 350. In Fig. 3(b) it shows a significant difference of vapor
pressure around day 175. Fig. 3(c), (d) show that the delta
ZTD result and the delta SD result projected to a 10 degree
mask angle of delta ZTD. During day 150 to day 250,
comparatively high delta SD is shown, which has a large
tropospheric delay difference between the stations. It shows a
dominant peak of delta SD around day 175 in Fig. 3(d) same
as Fig. 3(b). The normalized probability density results of
delta SD in Fig. 3(c), (d) are shown in Fig. 3(e), (f). The
probability density is shown to be the highest around 0.05m
and the maximum value is 15.04cm within 3 s in Fig. 3(e).
0 50 100 150 200 250 300 350 1000
1005 1010 1015 1020 1025 1030
DOY [day of year]
Pressure [hPa]
Mean pressure from 2006-2010
Boeu Buye
0 50 100 150 200 250 300 350
1000 1005 1010 1015 1020 1025 1030
DOY [day of year]
Pressure [hPa]
Mean pressure from 2006-2010
Cheo Jeon
(a) Statistical AWS total surface pressure mean data from
2006-2010 at Boeu and Buye stations (b) Statistical AWS total surface pressure mean data from 2006-2010 at Cheo and Jeon stations
0 50 100 150 200 250 300 350
-10 -5 0 5 10 15 20 25 30
DOY [day of year]
Temperature [deg]
Mean temperature from 2006-2010
Boeu Buye
0 50 100 150 200 250 300 350
-10 -5 0 5 10 15 20 25 30
DOY [day of year]
Temperature [deg]
Mean temperature from 2006-2010
Cheo Jeon
(c) Statistical AWS temperature mean data from 2006-2010
at Boeu and Buye stations (d) Statistical AWS temperature mean data from 2006-2010 at Cheo and Jeon stations
0 50 100 150 200 250 300 350
40 50 60 70 80 90
DOY [day of year]
Humidity [%]
Mean humidity from 2006-2010
Boeu Buye
0 50 100 150 200 250 300 350
40 50 60 70 80 90
DOY [day of year]
Humidity [%]
Mean humidity from 2006-2010
Cheo Jeon
(e) Statistical AWS relative humidity mean data from
2006-2010 at Boeu and Buye stations (f) Statistical AWS relative humidity mean data from 2006-2010 at Cheo and Jeon stations
Fig. 2 Statistical AWS meteorological data of mean total surface pressure (a) (b), mean temperature (c) (d) and mean
relative humidity (e) (f) from 2006-2010 between Boeu – Buye and Cheo – Jeon stations
0 50 100 150 200 250 300 350 -8
-6 -4 -2 0 2 4 6 8 10
DOY [day of year]
Difference
Meteorological data difference between Boeu-Buye
Pressure Temperature Humidity Vapor Pressure
0 50 100 150 200 250 300 350
-15 -10 -5 0 5 10
DOY [day of year]
Difference
Meteorological data difference between Cheo-Jeon
Pressure Temperature Humidity Vapor Pressure
(a) Meteorological data difference from 2006-2010 at Boeu and Buye stations
(b) Meteorological data difference from 2006-2010 at Cheo and Jeon stations
0 50 100 150 200 250 300 350
0 0.05 0.1 0.15 0.2 0.25
DOY [day of year]
Tropospheric delay difference [m]
Delta ZTD and delta SD with mask angle 10 between Boeu-Buye
Delta ZTD Delta SD
June-Aug.
0 50 100 150 200 250 300 350
0 0.05 0.1 0.15 0.2 0.25
DOY [day of year]
Tropospheric delay difference [m]
Delta ZTD and delta SD with mask angle 10 between Cheo-Jeon
Delta ZTD Delta SD June-Aug.
(c) Delta ZTD and delta SD projected to mask angle 10 degrees using the statistical AWS meteorological mean data difference between Boeu and Buye from 2006-2010
(d) Delta ZTD and delta SD projected to mask angle 10 degrees using the statistical AWS meteorological mean data difference between Cheo and Jeon from 2006-2010
-0.020 0 0.02 0.04 0.06 0.08 0.1 0.12 0.14 0.16 0.18 5
10 15 20 25
Delta troposphere slant delay [m]
Normalized probability density
Normalized probability density between Boeu and Buye (2006-2010)
3s
0 0.05 0.1 0.15 0.2 0.25
0 5 10 15 20 25
Delta troposphere slant delay [m]
Normalized probability density
Normalized probability density between Chej and Jeon (2006-2010)
3s
(e) Normalized probability density of delta troposphere slant
delay between Boeu and Buye from 2006-2010 (f) Normalized probability density of delta troposphere slant delay between Cheo and Jeon from 2006-2010
Fig. 3 AWS meteorological data difference (a) (b), delta ZTD and delta SD projected delta ZTD to mask angle 10 degrees
(c) (d) and normalized probability density of delta SD (e) (f) between Boeu – Buye and Cheo – Jeon stations
Aug 17th Aug 18th Aug 19th Aug 20th 1006
1008 1010 1012 1014 1016 1018 1020 1022 1024 1026
Local time [day]
Surface pressure [hPa]
Atmosphere surface pressure (2010.08.17-20)
Aug.17-20 (Daej) Aug.17-20 (Boeu) Aug.17-20 (Buye)
Aug 17th20 Aug 18th Aug 19th Aug 20th 22
24 26 28 30 32 34 36 38 40
Local time [day]
Temperature [deg]
Temperature (2010.08.17-20)
Aug.17-20 (Daej) Aug.17-20 (Boeu) Aug.17-20 (Buye)
(a) AWS total surface pressure data on Aug. 17-20 in
2010 (b) AWS temperature data on Aug. 17-20 in 2010
Aug 17th10 Aug 18th Aug 19th Aug 20th 20
30 40 50 60 70 80 90 100
Local time [day]
Humidity [%]
Humidity (2010.08.17-20)
Aug.17-20 (Daej) Aug.17-20 (Boeu) Aug.17-20 (Buye)
Aug 17th22 Aug 18th Aug 19th Aug 20th 24
26 28 30 32 34 36
Local time [day]
Partial water surface pressure [hPa]
Partial water surface pressure (2010.08.17-20)
Aug.17-20 (Daej) Aug.17-20 (Boeu) Aug.17-20 (Buye)
(c) AWS humidity data on Aug. 17-20 in 2010 (d) AWS partial water surface pressure data on Aug.
17-20 in 2010 It shows high probability density around 0.06-0.07m in Fig.
3(f) and it has the maximum value of 18.34cm within 3 s . Then, the tropospheric anomaly detection algorithm threshold is set to 15.04cm, 18.34cm at Boeu-Buye and Cheo-Jeon baseline, respectively.
3. Analytic results
3.1 Meteorological data of atmospheric grid Four meteorological stations of KMA are selected. One meteorological station is selected as the LPP that is at Daejeon (Daej). This is almost near the position of the calculated LPP, among the AWSs to evaluate the detection algorithm with the actual parameter provided in real time from the KMA. For the evaluation of the detection algorithm during tropospheric anomaly in multi-reference
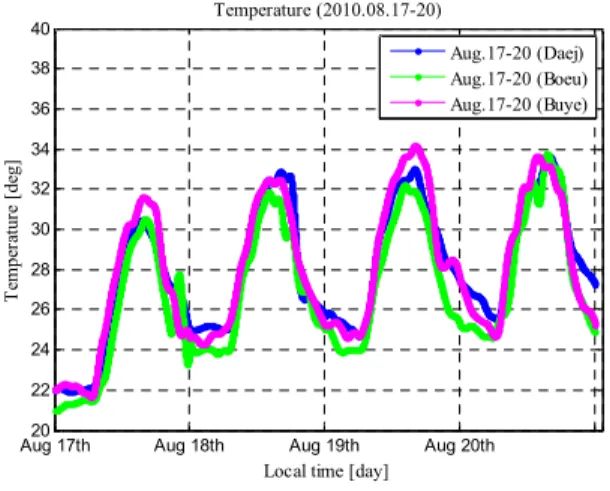
station environments, weather data from four days was selected at two meteorological stations from Aug. 17 to Aug. 20 in 2010 during the summer season, which has frequent precipitation. The weather conditions for the selected four days are shown in Table 2. There is no precipitation during Aug.19-20 but there is precipitation at the LPP, RS2, and RS4 on Aug.17. However, Aug.18 shows different weather conditions at the LPP, RS2, and RS4. It has no precipitation at the LPP, large precipitation of 27.4 mm at RS2, and small precipitation of 0.4 [mm] at RS4.
Fig. 4(a)-(d) show the meteorological data during Aug.17-20 in 2010 at Daej (LPP), Boeu (RS2), Buye (RS4), respectively. Fig. 4(a) shows the results of the total surface pressure, and it shows comparatively high surface pressure during Aug. 19-20, which has no precipitation. It is known that the temperature results of Fig. 4(b) and the humidity results of Fig. 4(c) show contrary changes to each other.
Fig. 4 AWS atmosphere parameter results of the total surface pressure (a), temperature (b), humidity (c), partial water
surface pressure (d) data on Aug. 17-20 in 2010 at Daej, Buye and Boeu stations
Aug 17th2.5 Aug 18th Aug 19th Aug 20th 2.52
2.54 2.56 2.58 2.6 2.62 2.64 2.66
Local time [day]
Tropo. ZTD [m]
Troposphere ZTD
Aug.17-20 (Daej) Aug.17-20 (Boeu) Aug.17-20 (Buye)
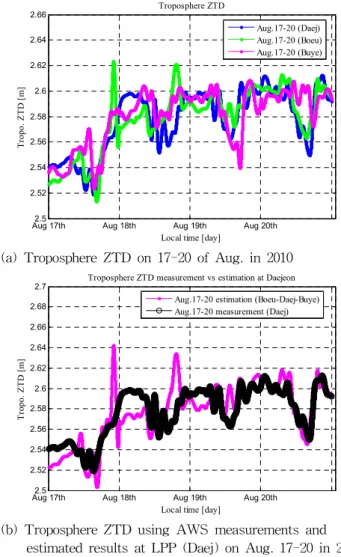
(a) Troposphere ZTD on 17-20 of Aug. in 2010
Aug 17th2.5 Aug 18th Aug 19th Aug 20th 2.52
2.54 2.56 2.58 2.6 2.62 2.64 2.66 2.68 2.7
Local time [day]
Tropo. ZTD [m]
Troposphere ZTD measurement vs estimation at Daejeon
Aug.17-20 estimation (Boeu-Daej-Buye) Aug.17-20 measurement (Daej)
(b) Troposphere ZTD using AWS measurements and estimated results at LPP (Daej) on Aug. 17-20 in 2010
Aug 17th Aug 18th Aug 19th Aug 20th
-0.05 0 0.05 0.1 0.15
Local time [day]
Tropo. ZTD difference [m]
Troposphere ZTD difference at Daejeon (estimation - measurement)
Aug.17-20 estimation - measurement (Boeu-Daej-Buye)
(c) Troposphere ZTD difference at the LPP (estimation –measurements) on Aug. 17-20 in 2010
Day
Region 08.17 08.18 08.19 08.20
LPP
(Daej)T [˚C] 26 28.3 29.1 29.1
Pre [mm] 11.5 - - -
RS2
(Boeu)T [˚C] 25.2 27.4 27.5 28.3
Pre [mm] 0.1 36.5 - -
RS4
(Buye)T [˚C] 26.5 28 29.1 28.6
Pre [mm] 39 0.4 - -
Fig. 5 Troposphere ZTD (a), troposphere ZTD comparison results at LPP (b), troposphere ZTD difference between the estimation and the measurement results at LPP (c)
Fig. 4(d) is the partial water surface pressure using the temperature data of Fig. 4(a) and the humidity data of Fig.
4(c). RS2 (Boeu) shows the highest partial water surface pressure during Aug. 17-18.
Table 2 KMA weather (2010.08.17-20)
Fig. 5(a) shows that the tropospheric ZTD regarding the 17-20 of Aug. in 2010 used the meteorological data in Fig.
4. The end of 17th and the beginning of 18th Aug. show high ZTD at Boeu station. It has 36.5 [mm] of precipitation on 18th as shown in Table 2. On the other hand, Daej station has no precipitation and Buye station has 0.4 [mm]
of precipitation on 18th Aug. Fig. 5(b) shows estimated tropospheric ZTD with a red line of LPP and it used the ZTD results from two stations according to the distance from Boeu and Buye stations. The black bold line shows the measured ZTD results at Daej station. This can be compared with the estimated ZTD results at the LPP. Fig.
5(c) shows that the tropospheric ZTD difference at the LPP subtracted the measured ZTD from the estimated ZTD results as shown in Fig. 5(c). The end of 17th and the beginning of 18th Aug. show the largest tropospheric ZTD difference, which has a different level of precipitation as shown in Table 2.
3.2 Anomaly detection results
AWS meteorological data was applied to the detection algorithm for evaluation. The proposed algorithm can detect the tropospheric anomalies during the regional atmosphere anomaly. When Daejeon station is set to the LPP, two stations of RS4 (Boeu) and RS4 (Buye) are selected that have the most linearized formation from the LPP. Every minute’s meteorological data on Aug. 18 in 2010 was used for the algorithm for evaluation because the weather conditions (especially precipitation, which has the strongest influence on ZTD result) of RS2 (Boeu), RS4 (Buye) and the LPP (Daej) were most different on that particular day when compared to other days.
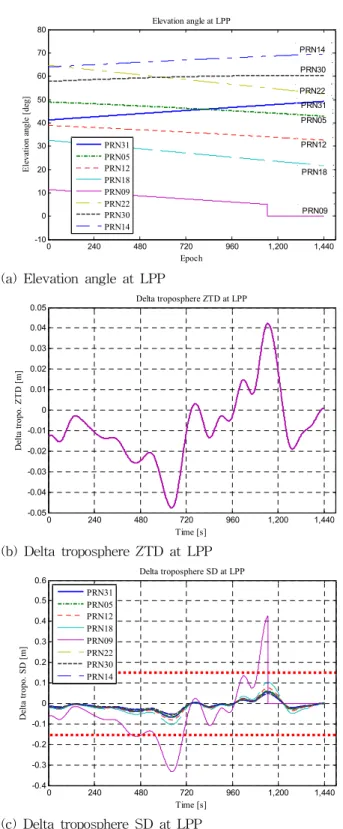
Fig. 6(a) shows the elevation angle at LPP of common satellites at selected two stations. PRN14 has the best visibility over 65 deg, and PRN09 disappears passed approximately 1100 epoch due to the mask angle. PRN09 has comparatively low elevation under 15 degrees. Fig.
6(b), (c) show the delta troposphere ZTD and delta
0 240 480 720 960 1,200 1,440 -10
0 10 20 30 40 50 60 70 80
Epoch
Elevation angle [deg]
Elevation angle at LPP
PRN31 PRN05 PRN12 PRN18 PRN09 PRN22 PRN30 PRN14
PRN31 PRN22 PRN30 PRN14
PRN05
PRN12
PRN18
PRN09
(a) Elevation angle at LPP
0 240 480 720 960 1,200 1,440
-0.05 -0.04 -0.03 -0.02 -0.01 0 0.01 0.02 0.03 0.04 0.05
Time [s]
Delta tropo. ZTD [m]
Delta troposphere ZTD at LPP
(b) Delta troposphere ZTD at LPP
0 240 480 720 960 1,200 1,440
-0.4 -0.3 -0.2 -0.1 0 0.1 0.2 0.3 0.4 0.5 0.6
Time [s]
Delta tropo. SD [m]
Delta troposphere SD at LPP
PRN31 PRN05 PRN12 PRN18 PRN09 PRN22 PRN30 PRN14
(c) Delta troposphere SD at LPP
RMS
PRN no. Delta SD [m]
PRN31 0.0273
PRN05 0.0269
PRN12 0.0331
PRN18 0.0431
PRN09 0.1277
PRN22 0.0228
PRN30 0.0225
PRN14 0.0211
0 240 480 720 960 1,200 1,440
0 1 2
Epoch
Flag
Troposphere flag
PRN09 PRN09
PRN09
(a) Detection results of the tropospheric anomaly
0 240 480 720 960 1,200 1,440
26 27 28 29 30 31 32 33
Epoch
Partial water surface pressure [hPa]
Partial water surface pressure at selected two stastions (2010.08.18)
RS1 (Boeu) RS2 (Buye)
B
C
A