GIS Based Real-Time Transit Information Integration and Its Transit Planning Implications
Hwang, Da Hae* ・ Kim, Dong Young** ・ Choi, Yun Soo*** ・ Cho, Seong Kil****
Abstract
Over the years, Advanced Public Transportation System (APTS) has been implemented to manage and operate public transportation system. With the expanding mass spatio-temporal data such as comprehensive spatial information of each individual passenger and public transportation vehicle, it has been required to consolidate and analyze these multiple data sets from various sources. This paper demonstrates how GIS is utilized for the consolidation of massive transit related spatio-temporal information. And it presents effective applications to improve transit planning process and support transit related decision-making activities. GIS based system is used to combine multi-agents’ data in the areas of transit operation and individual transit ride and transfer management. Due to the unique comprehensiveness and the level of detail of the data provide by the Seoul Transit system, this GIS based information consolidation is the first in its class. Based on the integrated database, this paper describes the effective and efficient GIS based analysis deployed in a transportation system planning process. The data integration systems and analytic models developed in this paper can be transferred and applied by any municipal governments provided that the appropriate data is available.
Keywords : GIS, Smart Card, Bus Management, Data Integration, Transit Planning
要 旨
근래 들어 대중교통체계의 관리 및 운영에 첨단 시스템의 활용이 증가하고 있다 그러나 이러한 시스템은 통행자.
개개인과 대중교통 수송수단의 매우 상세한 실시간 공간정보와 같은 대규모 시 공간자료를 양산하기 때문에 보다・
효율적이고 효과적인 자료의 통합과 분석의 필요성이 그 어느 때보다 높아지고 있다 본 연구에서는 대규모 대중.
교통 관련 시 공간 정보들의 통합에・ GIS가 어떻게 활용될 수 있는가를 보여주고 있으며 대중교통계획 과정의
효율화와 관련 의사결정 활동을 지원하는 효과적인 방안을 제시하고 있다 구체적으로. , Bus Management
등 대중교통 운영과 개인 승객 승하차 및 환승 관리 분야 의 여러 독립된 정보들
System(BMS) , (Smart Card System)
을GIS 기반으로 통합하였다 서울대중교통체계가 제공하는 수준 높은 실시간 시 공간 상세 정보의. ・ GIS기반
통합 데이테 체계는 자료 자체의 부재로 지금까지는 불가능한 것으로서 본 연구가 최초의 시도란 점에서 의의가,
있다 본 논문은 또한 이러한. GIS기반 통한 데이터베이스를 활용한 대중교통체계 계획 도구들의 효과성과 효율성
을 예시하였고 이러한 방법론과 모형은 유사한 자료의 획득이 가능한 여타 지자체에서도 유용하게 적용될 수 있을 것으로 판단된다.
핵심용어:GIS, 스마트카드 버스관리 데이터 통합 대중교통계획, , ,
1. Introduction
For years, the Advanced Public Transportation System (APTS) has been implemented to manage and operate
public transportation system in an efficient and effective manner.
The system produces mass spatio- temporal data such as comprehensive spatial information for each individual
년 월 일 접수 년 월 일 채택
2007 5 7 , 2007 6 5
* Graduate Student, Department of Geoinformatics, University of Seoul ([email protected])
** Graduate Student, Department of Geoinformatics, University of Seoul ([email protected])
*** Professor, Department of Geoinformatics, University of Seoul ([email protected])
**** Correspondent Author, Professor, Department of Geoinformatics, University of Seoul ([email protected]) 연구논문
passenger and public transportation vehicle, including the complete trip chains of each transit passenger and real-time tracking records of virtually all routed buses. With the expanded production of such mass data, the need for the consolidation and analysis of these multiple datasets from a number of sources has been increased continuously.
This paper demonstrates how GIS is utilized for multi-agent to integrate and to consolidate massive transit related spatio-temporal information. And it presents effective applications to improve public transportation planning process and to support transit related decision-making activities of multi-agent. The GIS based system issued to combine massive transit data in the areas of transit planning and spatiotemporal data integration. With regards to the integrated database, this study describes the GIS based analysis models that facilitate transportation system planning process in Section 2.
the Geographic Information System for transportation (GIS-T) is interconnected hardware, software, data, people, organizations, and institutional arrangements for collecting, storing, analyzing, and communicating particular types of information about the earth. The particular types of information are transportation systems and geographic regions that affect or are affected by these systems [4].
There is also widening recognition that transportation is a major component of the quality-of-life and sustaina- bility [9]. This restricts accessibility to opportunities and
has major negative impacts on the environment [7]. On the other hand, GIS-T can play a central role in the new environment for public land-use and transportation decision making [1], [6], [7]. By allowing a wide range of infor- mation to be integrated based on location, GIS-T fosters a holistic perspective on complex transportation problems.
It allows analytical and computational tools to be used in conjunction with detailed representations of the local context. GIS-T can also make transportation information more accessible, potentially enhancing location and trans- portation decision-making by the public-at-large and en- couraging wider participation in transportation planning process [2], [7], [8]. Kai han(2005) researched about transportation decision making system using geodatasets and GIS platform.
2. Massive Spatio-temporal Transit Data and GIS Database Integration
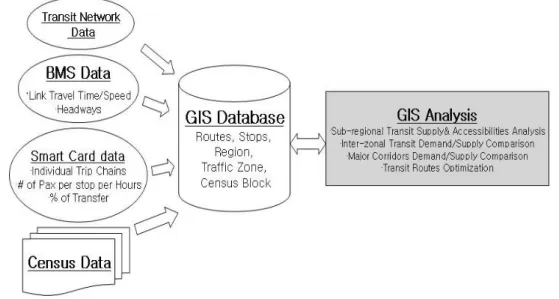
2.1 Data Framework
The transit datasets integrated in this research include the BMS (Bus Management System) data, trip records by route/stop/time of day, fare collection records by operator/
routes, and real-time operation records from the data warehouse of the Smart Card System.
Figure 1 provide overall scheme of the data framework including the BMS data and Smart Card System data and
Fig. 1. Data Framework
its availabilities.
The following GIS layers for the bus and subway system were either extracted or calculated from the transit data: Bus stop, Bus route, Subway stop, Subway route.
Many transport operation-based analyses rely on the transit route and stop data served as the base of transit data, which sits in the core of the data framework.
2.2 Smart Card Data
Smart Card (SC) is the dominant fee payment method of Seoul transit system. About 92 percent of transit users, including passenger from surrounding cities, use Smart Card for their daily trips. From the administration stand- point, the SC data provides detailed information associating each individual’s trip chains, time of boarding/alighting, distance traveled, O-D (Origin- Destination) stations, fee amount, and so on.
By processing the SC data, it is possible to analyze important transit planning associated attributes including
• Numbers of boardings/alightings along bus routes and bus classifications,
• Time of Day (TOD) Boardings/Aligtings
• Passenger volumes along bus routes and bus classifica- tions, and TOD passenger volumes.
the other distinctive contribution of SC data is the information on the mode transfer of each individual.
Transfer associated information includes time and location of alighting / re-boarding, transit mode chains, number of transfer for a entire trips, and fee amount paid for the transfer (s).
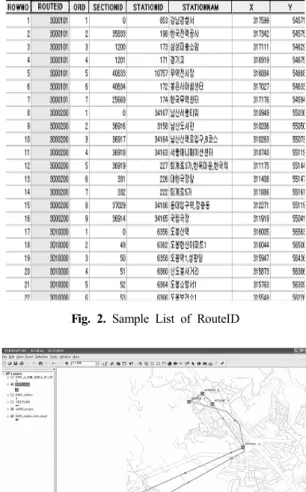
2.3 Bus Management System (BMS) and Bus Route Data Creation
BMS data includes the comprehensive information of each bus route.
It is sorted in accordance with Route Number, Route ID, spatial order, station ID and the combination of each bus stop (Figure 2).
By connecting the stops of each route on GIS, the physical routes of all bus lines are created initially.
Figure 3 shows sample Route of Layer 421 bus line operating in Seoul.
2.4 Integration of Spatiotemporal Information on a GIS Platform
Since the bus stop ID and StationID of the BMS and Bus Route data system are not compatible with BaseStationID of Smart Card system, additional data processing is required to match them. For this, a mapping table was created in the GIS Database and The StationID and BaseStationID conversion function was created (Figure 4).
This resulted in a matching Attribute information of each BMS Station including BusRouteID, ApplyDate, LinkID, CardStationID, BaseStationID, CardSequenceNo and BMSSequenceNo.
To accommodate the Gyunggido Bus route that stretched
Fig. 2. Sample List of RouteIDFig. 3. Connected Route on GIS Data Base
to Seoul, the same data processing and integration was implemented, These results in the comprehensive supply are Demand GIS database of the buses in owe surrounding
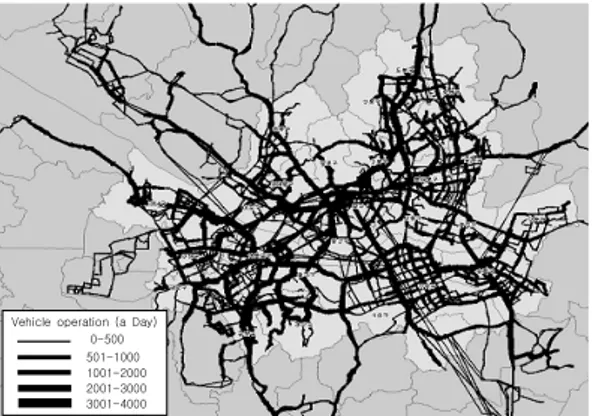
Seoul. Figures 5 and 6 illustrates the number of buses operating and the passenger volumes using bus for a day.
Any sliced TOD analysis is possible if the interested time period is specified. Figure 7 shows how to define rela- tionships and map the bus spatial and attribute information.
3. Application of GIS-based Analytical Model for Transit Planning
3.1 GIS-based Analytical Model Design for Public Transit Planning
It is practically impossible to describe the entire impli- cations of GIS-T data system since it provide virtually any Spatio-Temporal analysis depending on the compre- hensiveness of the data included. Further, the GIS-T data is the first transit system in class. Thus further intensive efforts should be followed to reveal the whole transit planning implication.
Followings are some examples of such implications:
Major Corridors Demand/Supply Comparison
•
Transit Routes Optimization
•
• Sub-regional Transit Supply & Accessibilities Analysis Inter-zonal Transit Demand/Supply Comparison
•
3.2 Demand and Supply Analysis in Major Transit Corridors
During a peak period in an urban area, demand often
Fig. 4. BMS-Smart Card Station ConversionVehicle operation (a Day) 0-500 501-1000 1001-2000 2001-3000 3001-4000
Fig. 5. Daily Bus Supply of Seoul (Veh/Day)
Passengers (a Day) 0-10000 10001-20000 20001-30000 30001-40000 40001-79304
Fig. 6. Daily Bus Demand of Seoul (Trips/Day)
Fig. 7. Mapping System for the Bus Spatial and Attribute Information
exceeds capacity. The temporal or spatial redistribution of demand that results from this over saturation can be estimated based on the capacity of a corridor. In this paper, it was performed by discriminating between the major demand corridors and the major supply corridors.
In order to generate the major corridors, creating the combined network of links identified by the node id was the first step in this process. And the attribute tables containing the trip records and vehicle operation records by time of day were associated with this spatial network using a table relationship. Figure 8 and 9 presents the result of applying these procedures.
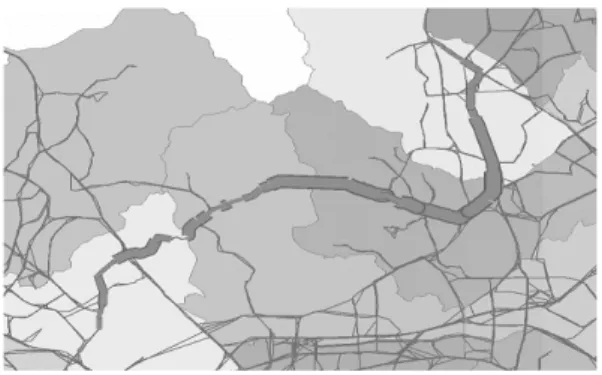
3.3 Transit Route Capacity Optimization In this section, the analysis for transit route capacity optimization was performed using the trip records by route/stop/time of day.
Figure 10 shows one of the bus routes indicated to be optimized. The lines are represented with the dark gray line connecting the links and the widths of the lines are related to the number of passengers by the segments. The broad lines on the map correspond to cost effective sections, but the thick lines mean the section that should be verified its efficiency.
3.4 Equity Analysis of Public Transit Service Over Regions
As a simplification, local transit accessibility for each transit system is estimated by calculating the number of
Fig. 8. Major Bus Demand Corridors
Fig. 9. Major Bus Supply Corridors
Fig. 10. Sample Route Capacity Optimization
Fig. 11. Transit Service Level Analysis
stations to percentage of population. To compute its service population and service area, the regions are divided into 25 sections by administrative districts. The number of stops is weighted by the number of routes corresponding with the stop. When taking the statistics of bus/subway stops, it is calculated by a point-to-polygon spatial join method and each factor is classified into three classes by a quantile method.
Based on the procedures mentioned above, Figure 11 shows the results of statistic analysis by overlaying these regions on the captive rider layer estimated by the number of passenger cars.
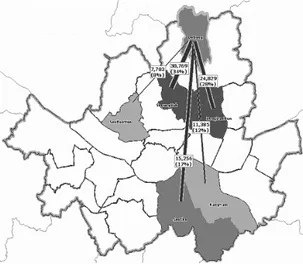
3.5 Transit Demand Analysis: Desire Line by O-D and Available Transit Routes The analysis in equity of public transit service was the supply side information for public transit planning. In this section, a desire line analysis is performed on the demand side for transportation planning. In order to generate the desire line analysis maps, travel demand data are derived from O-D Matrix obtained from travel records. Figure 12 is an example for the desire line analysis. The desire lines show the travel desired between the origin and destination.
The lines are represented with the red straight line connecting the trip origin region, Do-Bong, and five destination regions rated in the top five of desired traveled areas. The widths of the lines are related to the amount of travel desired between the regions. In addition, Figure 13 shows available transit routes and this can be
considered as an effective way of placing the public transit routes.
4. Conclusion
This paper has described how to integrate mass spatio- temporal information related with transit planning, infor- mation systems and the GIS-based analytical model design for public transit planning for multi-agents. These spatio-temporal data sets can be synchronized in the GIS database so that when the database is updated partially or fully, it will be systematically reflected in the results of GIS-base analysis. This flexibility can be a major benefit in efficiency of the GIS in transit planning. The paper also presented the effective applications to improve a public transportation planning process and to support transit related decision-making activities of multi-agents.
The GIS based system issued to combine massive transit data in the areas of transit planning and spatio-temporal data integration. In regards to the integrated database, the study describes the effective and efficient GIS based analysis models that facilitate transportation system planning process. The systems and analytic models developed in this paper can be transferred and applied by any multi- agents providing that the appropriate data is available.
Fig. 12. Desire Line of Selected Pair
Fig. 13. Available Transit Routes between the Selected O-D pair
References
1. Balamohan N., 2002, “Enterprise GIS approach for urban transportation planning”,Map India.
2. Benn, H., 1995, “Bus route evaluation standards”, TCRP Synthesis of Transit Practice No. 10, Transportation Research Board.
3. Cervero, R., 1986, “Suburban Gridlock”,New Brunswick, N.J : Center for Urban Policy Research.
4. Fletcher, D., 2000, “Geographic information systems for transportation : A look forward”,transportation in the New Millenium : State of the Art and Future Directions, Trans- portation Research Board, CD-ROM.
5. Hanson, S., 1995, “Getting there : Urban Transportation in context”,S.Hanson (ed.) The Geography of Urban Transpor- tation, 2d ed., Guilford Press, 3-25.
6. Martinez, F. J., 1995, “Access : The transport-land use
economic link”,Transportation Research Part B: Methodological, 29.
7. Miller, H.J., Shaw, S.L., 2001, “Geographic Information Systems for Transportation: Principles and Applications”, OXFORD University Press.
8. van Nes, R., Bovy, P.H., 2000, “Importance of objectives in urban transit-network design”, Transportation Research Record, 1735.
9. Wiggins, L., Deuker, K., Ferreira, J., Merry, C., Peng, Z., Spear, B., 2000, “Application challenges for geographic information science: Implications for research, education and policy for transportation planning and management”, URISA Journal, 12, 52-59.
10. 원제무, 2005,도시교통론 박영사,
11. 김성수, 2001, “수도권 대중교통체계의 통합관리방안에 관한 연 구” 한국건설기술연구원, .