TEST ON REAL-TIME CLOUD DETECTION ALGORITHM USING A NEURAL NETWORK MODEL FOR COMS
Hyun-Jeong Ahn, Chu-Yong Chung, and Mi-Lim Ou
Global Environment System Research Laboratory, National Institute of Meteorological Research, KMA, Seoul 156-720, [email protected]
ABSTRACT
This study is to develop a cloud detection algorithm for COMS and it is currently tested by using MODIS level 2B and MTSAT-1R satellite radiance data. Unlike many existing cloud detection schemes which use a threshold method and traditional statistical methods, in this study a feed-forward neural network method with back-propagation algorithm is used. MODIS level 2B products are matched with feature information of five-band MTSAT 1R image data to form the training dataset. The neural network is trained over the global region for the period of January to December in 2006 with 5 km spatial resolution. The main results show that this model is capable to detect complex cloud phenomena.
And when it is applied to seasonal images, it shows reliable results to reflect seasonal characteristics except for snow cover of winter. The cloud detection by the neural network method shows 90% accuracy compared to the MODIS products.
KEY WORDS: COMS, Cloud Detection(CLD), Neural Network(NN).
1. INTRODUCTION
Remote sensing from satellite is leading significant contribution to environmental monitoring and earth observation. Almost all application of satellite imagery requires the identification of clouds within the imagery prior to any further processing. The accuracy of cloud information is important for global climate studies and earth radiation measurements because the clouds critically determine the amount of incident and reflected radiation from the earth's surface. Also it affects the accuracy of the derivation of geophysical information, the analysis of meteorological products. For example, if a pixel is contaminated by cloud, the pixel is used to derive products related with the cloud such as the cloud type, optical depth, amount and rainfall so on. On the other hand, if the pixel is determined as cloud free, the products related with the cloud free such as land/sea surface temperature, vegetation, humidity, and so on is derived. So cloud detection is a preliminary processed producer in most meteorological algorithms for processing satellite data. However, it is complicated to detect clouds with limited channel data that are hard to discriminate clouds from mixed backgrounds such as snow, sea ice, fog, desert, and so on. And as the background characteristics changes with season, location, observation geometry, and others, these are main factors that cause to degrade the accuracy in cloud detection.
Study of cloud detection has been carried out in the framework of COMS Meteorological Data Processing System (CMDPS) project. Cloud detection scheme is now under development on two separate algorithm, which are the threshold techniques based algorithm for the operational purpose and neural network based algorithm for the backup and experimental purpose (METRI, 2007, and Ahn, et al., 2005). In this paper, the
development of automated pixel scale algorithm using neural network model is studied to detect the cloud in full disk region of COMS. As the underlying physical processes determining radiance data measured from satellites are generally nonlinear and vary both spatially and temporally, the neural network (NN) is a good alternative approach for cloud detection (Heerman.et al., 2003). In the past, there have been several studies concerning the cloud detection using NN from satellite data (Yhann and Simpson, 1995, Jose et al., 2003). But these were trained and tested in small sample data and local region. In this study, we have been studied to detect clouds in images from broad global region which is subject to large latitudinal, longitudinal, seasonal variations in atmospheric conditions. And we make use of the NN’s ability to classify data in a complex decision space and to extract relationship between the level2 data produced from multispectral MODIS of polar orbit satellite and MTSAT-1R channel features of geostationary satellite.
Section 2 is the description of dataset used for the model development. In section 3, we provide the brief description of NN model, cloud detection algorithm and input, output data. Section 4 discusses test results on real- time cloud detection and validation results. Finally summary and concluding remarks are given in section 5.
2. SATELLITE DATA
In the development of NN model for the cloud detection, the radiance data measured from MTSAT-1R have been used for the period of January to December in 2006, which has also similar channels to COMS. The MTSAT-1R consists of visible, shortwave infrared, water vapor, 2 Infrared channels. MTSAT visible images have 1km resolution and IR images have 4km resolution. Full
disk satellite image are taken during 24 hours per 1 hour.
In this test, the full disk data which are converted 5 km spatial resolution. For the training of NN model, true cloud information on whether the corresponding pixels are cloud-contamination or not should be necessary. So, it is required to collect the training dataset to learn clouds features from “truth” cloud mask which reflects variable surface, atmospheric conditions such as the water vapor, observation geometry, regional, temporal characters. To this purpose, cloud mask produced by another satellite, MODIS was used. MODIS is keystone instrument onboard NASA EOS (Earth Observation System) Terra and Aqua satellite. They view the entire Earth’s surface every 1 to 2 days, acquiring data in 36 spectral bands from the short wave visible to the long wave infrared. A Cloud mask obtained from MODIS radiance is available as product MOD35. It is a daily, global Level 2 products generated 1km spatial resolution. MOD35 is claimed to yield a very robust cloud mask, since the algorithm employs a series of visible and infrared threshold, decision rules and consistency tests to specify confidence that an unobstructed view of the Earth’s surface is observed (Ackerman, et al., 1998, Platnick S., et al., 2003). MTSAT-1R and MOD35 product were chosen such that passage times over the COMS full disk region were coinciding as much as possible. MOD35 products generated at 1km spatial resolution were used. As MTSAT-1R and MODIS sensors have different grids and, especially spatial resolution, MOD35 products were collocated on the MTSAT grid before using them to create the training dataset. Only pixel on the MTSAT-1R grid where all corresponding MODIS pixel were classified by MOD35 as confidently cloud or not were selected to build the training dataset.
3. CURRENT NEURAL NETWORK MODEL For COMS cloud detection algorithm, we used to the feed-forward multilayer network. Detail theory of this network was presented by Lipmann et al.(1987). So we delineate briefly cores of our model development. The input layer contains nodes for each input feature variables, and the output layer represents the target variables.
Determination of the proper number of input, hidden and the optimized weights are the key for the model development. In this study, input layer nodes is set 21, which contain brightness temperature, albedo of each 5 satellite channel, and differences between infrared channels, and local 3×3 pixel standard deviation(spatial consistency features), 15 day composite means(time consistency features) of infrared, visible channels. And inputs are used of regional (latitude, longitude), surface type(land-sea index), time(Julian day, season index), angels(solar zenith , satellite zenith angles)information.
The number of hidden layer is fixed by 1, and the number of hidden nodes is tested from 1 to 100 by a trail and error approach. Now we use 65 nodes in hidden layer concerning time efficiency, accuracy, probability of detection score, and so on. At last, output layer has only
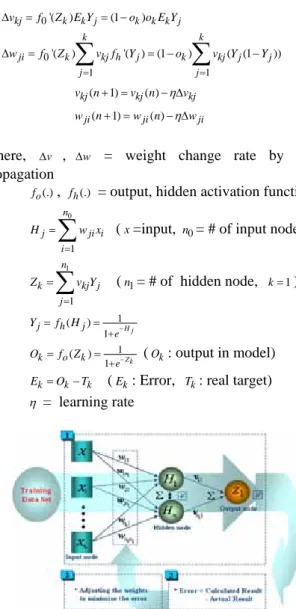
1 node, uses the sigmoid activation function because the resulting output of the cloud detection is binary that is cloud is 1, non-cloud 0. The back-propagation algorithm which minimizes difference between the estimated outputs and true outputs is used to estimate the weights between each node. A schematic diagram for this algorithm is shown in fig.1. Weights change within our cloud detection model are calculated as (1), and final weights by 5000 iterations can be written as (2), (3).
Table 1 shows the final model validation results through this training process. Our model has approximately 90%
accuracy, and cloud has higher accuracy than clear case.
0
0
1 1
'( ) (1 )
'( ) '( ) (1 ) ( (1 ))
kj k k j k k k j
k k
ji k kj h j k kj j j
j j
v f Z E Y o o E Y
w f Z v f Y o v Y Y
= =
∆ = = −
∆ =
∑
= −∑
− (1)( 1) ( )
kj kj kj
v n+ =v n − ∆η v (2)
( 1) ( )
ji ji ji
w n+ =w n − ∆η w (3) Where, ∆v , ∆w = weight change rate by back- propagation
o(.)
f , fh(.) = output, hidden activation function
0
1 n
j ji
i H w xi
=
=
∑
(x=input, n0= # of input node)1
1 n
k kj j
j
Z v Y
=
=
∑
(n1= # of hidden node, k=1)1 1
( ) H j
j h j
e
Y f H −
= = +
1 ( ) 1 k o k Zk
O f Z e−
= = + (Ok: output in model)
k k k
E =O −T (Ek: Error, Tk: real target)
η = learning rate
Figure 1. Schematic diagram for feed-forward multilayer model by back-propagation algorithm.
Table 1. Model validation Results
training data validation data SCORE
clear cloud clear cloud 0.8674 0.9255 0.8673 0.9282
PC 0.9004 0.9019
POD 0.9255 0.9282
4. CLOUD DETECTION 4.1 Data Processing on Real Time for COMS
The data processing consist of sun-glint region, twilight zone check, input features pre-processing using COMS level1B channel values, output calculation using preset weights, post-processing, validation. On the first step, sun-glint, twilight region check is performed for each pixel. Because albedo of visible channel corresponding to these pixels has ever so much high, it affects cloud detection. So it was replaced to 0. After this check, channel features inputted to the model are calculated, and were mapped into the interval [0,1] so that the difference channel data all exhibited the same dynamic range, after that all input data is transformed to the format into model. The next step is to calculate the output using preset weights. Because output through model are produced to the probability value between 0 and 1 which is cloud or not, post processing of output perform to modify uncertain pixels. After these processing, cloud detection per 1 hour is produced. At present, the cloud detection result through this process using MTSAT-1R data have been validated comparison with another satellite data, MODIS cloud mask products after time, spatial consistency of two data. Flow chart of this is summarized in Fig. 2.
Figure 2. Flow chart for cloud detection algorithm using neural network model.
4.2 The cloud detection test sequence
Because cloud detection algorithm using neural network(NNCLD) was developed by using the MTSAT- 1R observing data, which has similar imaging channel to COMS, we are using the MTSAT-1R data to test, validate the algorithm developed. Figure 3. (a), (b) are full disk visible and infrared images from 0333 UTC, September 03, 2007, observed from MTSAT-1R, respectively. Fig. 3 is image of cloud probability, which is continuous output produced from model, these value has 0 to 1 interval range. Uncertain cloud pixels containing cloud edge are classified to cloud or not by
threshold. In this study, we use the threshold based 0.5.
Final Cloud detection result is shown in Fig. 3 (d), in which white corresponds to cloudy region and black corresponds to clear. It is shown that cloud detection results are reasonable in visual aspect.
(a) (b)
(c) (d) Figure 3. An example of cloud detection results on 0333
UTC September 03, 2007 for (a) MTSAT-1R visible image (0.8µm), (b) MTSAT-1R infrared image (10.8µm), (c) probability of cloud and (d) cloud detection.
Fig. 4(a) shows infrared image during nighttimes on 1333 UTC July 13, 2007. There are typhoon coming up from the daytime, clouds covering the middle part of the Korean Peninsula and ocean. During the nighttimes, though the visible channel is bad value, since daytime and nighttimes information is already used for input by using the solar zenith angle, there is no negative impact on detecting clouds, and we can find good detecting results in Fig 4 (b). Fig 4 (c) is cloud mask products from MODIS satellite, MOD35.
(a) (b) (c)
Figure 4. Images on 1333 UTC July 13, 2007. (a) 10.8 mµ infrared image of MTSAT-1R, (b) Cloud detection result from NNCLD, and (c) Cloud mask products from MODIS satellite (MOD35).
To validate the outputs through NNCLD algorithm, MODIS pixels containing MTSAT-1R full disk region are re-grided, remapped. We can see that both methods detect cloud area similarly. Comparing two results, the agreement rate of this case is 90.62%, and NNCLD shows high accuracy. And false alarm ratio (FAR) shows low error, that is 0.1828.
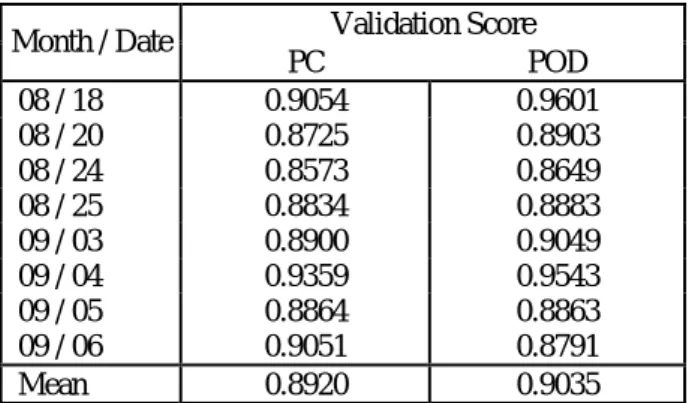
presented the average agreement rate, Perfect Correct (PC), Probability of detection (POD) during 8 day case during August, September, 2007. From results of this 8 case, we can see that NNCLD has high accuracy, approximately 89.2 %. At present, test on real time cloud detection has been performing continuously and it achieved the high fication rate and validation results.
Howeve is also
produc ng data
rates may
And NNCLD using MTSAT-1R data is compared with MOD35 for 5 or 6 passage times per 1 day. Table 2
classi
r, due to the fact that validation data from MODIS correspond to the traini ts
defined by “truth” cloud mask, the classification accuracy high, and real cloud detection accuracy can be different. Therefore more quantitative validation and verification process as visual inspection is needed to complete algorithm. Also, it is required to evaluate for another season case, such as snow cover in winter that is difficult to detect cloud by decreasing the errors due to snow cover and background characteristics.
In the future we will do these works continuously.
And the contingency plan according to channels missing for COMS will be prepared by sensitivity tests,
Table 2. Validation Scores for 8 cases during August and September in 2007.
Validation Score Month / Date
PC POD
08 / 18 0.9054 0.9601
08 / 20 0.8725 0.8903
08 / 24 0.8573 0.8649
08 / 25 0.8834 0.8883
09 / 03 0.8900 0.9049
09 / 04 0.9359 0.9543
09 / 05 0.8864 0.8863
09 / 06 0.9051 0.8791
Mean 0.8920 0.9035
5. SUMMARY AND CONSLUSION
In the framework of the COMS Meteorological Data Pr
experimental purpose in full disk region of COMS. A
cl ection. The radiance data measured from
M SAT-1R which has sim COMS has
b llect the ures
fr th” clouds produced b S. In
re detectio current al ng
M R 5 chan ures from onary
s as the 90% t in comp th 36
m ral MODIS tection product from polar
o ite.
future, seve s should b ed in order to improve the accuracy of cloud detection and, to fi MS. At firs ess of the c
ility “true”
e training of the NNCLD. In
relation fication
process as visual inspection will be implemented to co
ag., vol 4, no.2, 4-22.
lopment of Meteorological
an, S. A., Menzel, W.
R. A., 2003: The
entation. IEEE
of “Development of ocessing System (CMDPS) project, the cloud detection
algorithm of automated pixel scale based on neural networks has been developed for the backup and comprehensive study of feed-forward multilayer network was made to select the optimal classifier model for the
oud det
T ilar channels to
ng dataset to
een used to co traini learn feat om “tru
sult, cloud
MOD35 n through
y MODI gorithm usi
TSAT-1 nel feat geostati
atellite h agreemen arison wi
ultispect cloud de rbit satell
In the ral point e address
t it to CO t, robustn loud mask will be ated with re
cloud mask used for th
evalu spect to reliab of the to this, quantitative validation and veri
mplete the algorithm. Also the contingency plan according to each channel for COMS will be prepared through sensitivity tests.
References from Journals
Ackerman. S. A., K. I. Strabala. W. P. Menzel, R. A.
Frey, C. C. Moeller, and L. E. Gumley, 1998:
Discriminating clear sky from clouds with MODIS, J.
Geophys. Res., 103, 32, 141-157.
Ahn, H. J., Ahn, M. H., and Chung, C. Y., 2005:
Application of neural network for the cloud detection from geostationary satellite data, in proc., Int, Sym.
Remote Sensing (ISRS2005) Jeju, Korea.
Heerman, P. D. and Khazenie, N., 1992: Classification of multispectral remote sensing data using a back- propagation neural network. IEEE Trans. Geosci. Remote Sensing, vol 30, 81-87.
Jose A. T. A., Francisco G. R., Mercedes P. L. and Manuel C., 2003: An Automatic Cloud-Masking System Using Backpro Neural Nets for AVHRR Scenes, IEEE Trans. Geosci. Remote Sensing, 41, 826-831.
Lipmann, R. P., 1987: An introduction to computing with neural nets, IEEE ASSP M
METRI/KMA, 2007: Deve
Data Processing System of Communication, Ocean, and Meteorological Satellite(Ⅳ).
Platnick, S., King, M. D., Ackerm P., Baum, b. A., Ridi, J. C. and Frey,
MODIS cloud products : Algorithm and examples from Terra. IEEE Trans. Geosci. Remote Sens., 41, 459-473.
Yhann, S. R. and Simpson, J, J., 1995: Application of neural networks to AVHRR cloud segm
Trans. Geosci. Remote Sensing, vol 33, 590-604.
Acknowledgements
This study has performed as a part
Meteorological Data Processing System for Communication, Ocean and Meteorological Satellite”
project in the Korea Meteorological Administration (KMA).