I 형보의 비선형 유한요소해석
Nonlinear Finite Element Analysis of UHPFRC I-Beam on the Basis of an Elastic-Plastic Fracture Model
한 상 묵† 궈 이 홍*
Han, Sang-Mook Guo, Yi-Hong
(논문접수일 : 2009년 1월 28일 ; 심사종료일 : 2009년 4월 24일)
···
요 지
본 논문은 단조하중을 받는 초고강도 섬유보강 콘크리트 I형보의 파괴거동에 대한 3차원 유한요소해석을 수행하였다. 보 통 또는 고강도 콘크리트의 구성방정식과 달리 초고강도 섬유보강 콘크리트의 재료적 특성을 나타내기 위해 인장변형률 경화관계를 고려한 탄소성 파괴역학 모델을 제안하였다. 인장영역에서는 인장경화 변형률을 고려한 다차원적 균열기준을 정의하였고, 압축영역에서는 associated flow rule을 고려한 Drucker-Prager기준을 채택하여 해석을 수행하였다. UHPFRC I형보의 지간, 프리스트레스 하중 및 단면의 영향에 관한 수치해석 결과를 실험 거동와 비교한 결과 정확한 해석 결과를 보 여주었다.
핵심용어 : 유한요소해석, 초고강도 섬유보강 콘크리트, 프리스트레싱, 인장변형률 경화
Abstract
This paper deals with the three-dimensional finite element analysis of failure behavior of UHPFRC I-beam under monotonic load.
Different from the constitutive law of normal and high strength concrete, an elastic-plastic fracture model that considers the tensile strain hardening is proposed to describe the material properties of UHPFRC. A multi-directional fixed crack criterion with tensile strain hardening is defined in the tensile region, and Drucker-Prager criterion with an associated flow rule is adopted in the compressive region. The influence of span, prestressing force and section on the behavior of UHPFRC I-beam are investigated. The comparison of the numerical results with the test results indicates a good agreement.
Keywords : finite element analysis, UHPFRC, prestressing, tensile strain hardening
···
1. Introduction1)
Ultra high performance fiber reinforced concrete (UHPFRC) possesses very low permeability, extremely high compressive strength and tensile strain hardening because it has higher quantity of fiber reinforcement (usually 2% in volume of metallic fibers), and a denser and finer matrix. Normally the compressive strength of UHPFRC is in the range between 150 and 220MPa, and the tensile strength of UHPFRC in the
†책임저자, 정회원․금오공과대학교 토목환경공학부 교수 Tel: 054-478-7614 ; Fax: 054-478-7629 E-mail: [email protected]
* 금오공과대학교 토목환경공학부 토목공학과 박사과정
range of 7 to 15MPa. Although it is called concrete, UHPFRC that is well adapted for the improvement of strength and durability of structural2)elements should not follow the path of normal and high strength concrete application. Among these kinds of applications several traffic bridges can be listed: the first road bridge “Shepherds Bridge” in Australia with 19.6 meters long by 21 meters wide, Vehicle Bridge in the U.S.A with 33m simple span, Sherbrooke footbridge in Canada, Seonyu footbridge in Korea, the Kuyshu
∙이 논문에 대한 토론을 2009년 8월 31일까지 본 학회에 보내주시 면 2009년 10월호에 그 결과를 게재하겠습니다.
expressway bridge and the Sakata Mirai footbridge erected in Japan(Paul, 2004). The ultra high performance composite bridge across the River Fulda in Kassel is the first ultra high performance composite bridge in Germany(Ekkehard et al., 2004) the bridge structure in which the pre-cast prestressing UHPFRC slab is used to form the bridge deck has 6 spans with a total length of 133.2m and maximum free span of 36m. The Saint-Pierre-la-Cour bridge that is the first bridge made of UHPFRC in France is built to cross a railway line(Behloul, 2007) This bridge, with a span of 19m and 12.6m wide, supports a continuous reinforced concrete road of 7.6m, pavement, and a cycle track.
Performance of nonlinear finite element analysis for UHPFRC is necessary because it is very important to predict material strength, deformation performance and failure process in order to evaluate the reliability and safety of the structures in the design of structures(Nam, 2004). Many numerical simulation researches on UHPFRC have been done. A numerical analysis was performed with the FEM program Diana by Giovanni Martnola and Alberto Meda(2007). In this model, the tensile behavior is represented by a multi-linear total strain rotating crack model which allowed the adoption of a stress-strain relationship before cracking and a stress-crack opening law after cracking; the behavior in compressive region is simulated with Thorenfeld curve(Giovanni et al., 2007). This model could simulate the tensile behavior precisely, but the plasticity in compression can not be considered with Thorenfeld curve. Kittinum Sirijaroonchai and Sherif El-Tawil suggested a three dimensional plasticity model that also considers the tensile hardening for high performance fiber reinforced cement composites(Kittinum et al., 2007). In this model, a modified version of the four-parameter Hsieh-Ting-Chen(HTC) concrete model previously published by Hsieh, S.S.(1988) and modified by Imran, I. Pantazopoulous(2001) is used to describe the behavior of compression; a modified Tresca yield criterion is employed to represent the behavior in tension. Although this model considers the tension
hardening, it is not precise that a plasticity model is used in tension region because it can not consider the tensile crack. A model proposed by Chote Soranakom and Barzin Mobasher is expressed as closed-form solutions of moment-curvature response, which could be used with crack localization rules to predict flexural response of a beam under four point bending test(Chote et al., 2007).
The above investigations do not consider the plasticity in compression and the crack strain hardening in tension simultaneously. However it is more precise that a fracture model is used in tension, and a plastic model in compression for UHPFRC. So the aim of this work is to propose an effective and practical three- dimensional elastic-plastic fracture model which considers these two factors simultaneously, and to perform the numerical analysis with Diana. Firstly, the test is briefly described; secondly, the numerical simulation is performed; finally, the numerical results with the experimental results are compared.
2. Three-Point Bending Test on UHPFRC I-Beam
The three-point bending test on UHPFRC I-beam is carried out to investigate the failure and load carrying capacity of UHPFRC I-beam. In this section, the specimen types and test results are presented.
2.1 Specimen Types
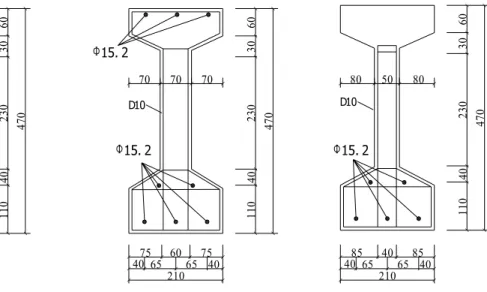
The section and the dimension are shown in Fig.1.
The section is 470mm in height, 210mm in flange width, 90mm in upper flange height and 150mm in lower flange height. The width of web is sorted into two kinds of form: 50mm and 70mm, respectively.
The height of web is 230mm, and the prestressing steel is 15.2mm in diameter. Five 10-mm-diameter stirrups are placed at the end of the I-beam and the distance between stirrups is 110mm. Due to symmetry, Fig.2 only shows the half I-beam elevation. The geometrical properties of specimens and the magnitude of prestressing force are shown in Table1.
15. 2
D10 D10 D10
70 70 70
65210
4075 6065 4075
15. 2 15. 2
15. 2
470110402303060
70 70 70 80 50 80
65210
4075 6065 4075
65 210
4085 4065 4085
470110402303060 470110402303060
Fig.1 Section and dimension of specimen
D10,5@110
275 3525
C.L
D10,5@110
300 2350
C.L
D10,5@110
325 1175
C.L
Fig.2 Specimen elevation
Specimen type Shear-span ratio
Pre-stressing
force(ton) Span(m)
FP-W7-L15 15 60 7.6
HP-W7-L15 15 30 7.6
NP-W7-L15 15 0 7.6
FP-W7L15-B 15 30(upper flange) 60(lower flange) 7.6
FP-W7-L10 10 60 5.3
FP-W7-L10-B 10 30(upper flange) 60(lower flange) 5.3
FP-W5-L10 10 60 5.3
NP-W5-L10 10 0 5.3
HP-W5-L5 5 30 3
NP-W5-L5 5 0 3
FP: the magnitude of prestressing force is 60ton on the lower flange.
HP: the magnitude of prestressing force is 30ton on the lower flange.
NP: no prestressing force. W7: the width of web is 70mm. W5: the width of web is 50mm. L15, L10, L5 : the shear-span ratio is 15, 10, 5, respectively. B: the magnitude of prestressing force is 30ton on the upper flange.
Table 1 Geometrical properties of specimens and the magnitude of prestressing force
2.2 Test Results
The aim of this experiment is to investigate the failure and load carrying capacity of UHPFRC I-beam under monotonic load. The first crack load, the first diagonal crack load, the ultimate state load and their corresponding mid-span displacement are observed shown in Table 2. The load versus mid-span deflection curves is presented in section4.
It can be observed from Table 2: UHPFRC possesses higher load carrying capacity. Prestressing force that enhances the load carrying capacity and deformation resistance capacity of UHPFRC I-beam has great
influence on the behavior of UHPFRC I-beam; the more prestressing force, the higher the first crack load and the ultimate state load within limits. The shear-span ratio has a substantial influence on the I-beam behavior. The I-beam with small shear-span ratio has greater load carrying capacity and deformation resistance capacity. Compared the result of specimen FPW7L10 with that of specimen FPW5L10, it can be seen that the deformation resistance capacity and the load carrying capacity increase as the width increases.
specimen First crack First diagonal crack Ultimate state Load(kN) Displacement(mm) Load(kN) Displacement(mm) Load(kN) Displacement(mm)
FP-W7-L15 129 13.2 269 53.4 319 77.1
HP-W7-L15 90 9.4 179 35.2 270 80.6
NP-W7-L15 61 9.4 114 24.3 259 83.6
FP-W7-L15-B 126 12.6 258 46.3 354 92.2
FP-W7-L10 248 8.5 358 16.4 456 30.1
FP-W7-L10-B 209 7.4 381 19.6 462 29.3
FP-W5-L10 199 6.7 304 13.4 404 31.9
NP-W5-L10 94 3.6 142 8.1 283 31
HP-W5-L5 372 3.1 425 3.9 822 13.8
NP-W5-L5 265 2.2 364 4.4 699 17
Table 2 Load and corresponding mid-span displacement
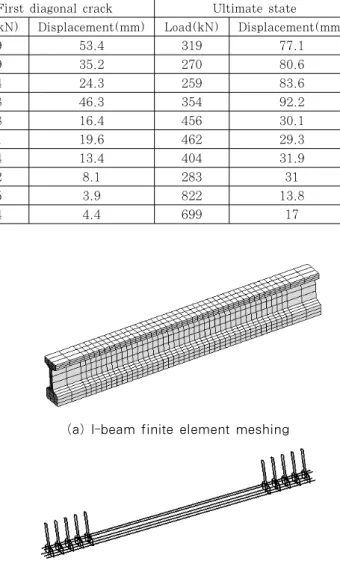
(a) I-beam finite element meshing
(b) Reinforced bar finite element meshing Fig.3 The finite element meshing of specimen FP-W7-L15 3. Finite Element Model
3.1 Basic Assumption
There are three assumptions for UHPFRC I-beam finite element model based on the experimental results, the material model characteristic offered in Diana and the calculation of simplicity and effectiveness.
Firstly, Experimental investigation shows that I-beam obeys little deformation assumption under the load, so the geometrical nonlinearity is not considered.
Secondly, the dowel action of prestressing steel and the bond-slip are ignored, namely UHPFRC and steel bond perfectly. Thirdly, UHPFRC is regarded as isotropic material before cracking, and as orthotropic material after cracking.
3.2 Finite Element Meshing
The general purpose finite element program Diana which can conduct three-dimensional finite element analysis is used to perform the required numerical simulation(Diana Element Library User’s Manual).
According to the ten specimens, the corresponding three-dimensional finite element models are defined.
Element CHX60, an twenty-node isoperimetric three-dimensional solid element which has three degrees of freedom at each node and is based on quadratic interpolation and Gauss integration, is used for modeling UHPFRC. Element CHX60 fits to this analysis for it can be used to perform nonlinear, crack and plastic analysis.
The embedded reinforcement bar element that adds stiffness to the finite element model is used to model the prestressing steel. The main characteristics of the embedded reinforcement bar element are(Diana Element Library User’s Manual): firstly, reinforcements are embedded in structural elements, the so-called mother elements. In this paper, element CHX60 is the mother element. Secondly, reinforcements do not have degrees of freedom of their own. Thirdly, by default, reinforcement strains are computed from the displacement field of the mother elements. This implies perfect bond between the reinforcement and the surrounding material.
Only the finite element meshing of specimen FP-W7-L15 is shown in Fig.3(a,b) because all
Failure surface
Compression- tension zone
Initial crack surface Compression-
compression zone
tension-tension zone
Compression- tension zone
σ1
σ2
ft
fbc
−
Initial plastic surface fc
− ft′
subsequent cracking surface
Fig.4 Loading surfaces of UHPFRC in the biaxial stress plane
n t
x y
cr
σ
in crτ
itFig.5 Single crack model models have the similar meshing.
3.3 Material Model
3.3.1 Constitutive Model of UHPFRC
The proposed model is an elastic-plastic fracture model which considers the tensile strain hardening and softening after cracking. A multi-directional fixed crack model is used for the description of crack in the tensile region and Drucker-Prager yield criterion is employed to describe the failure of UHPFRC in the compressive region. The multi-directional cracking simulation system is introduced by Xuehui An and Koichi Maekawa(2007). The loading surfaces of UHPFRC in the biaxial stress plane are shown in Fig. 4.
1) Multi-directional fixed crack model for UHPFRC cracking
The crack model for crack i in the n-t coordinate
system as shown in Fig. 5 can be expressed as(Diana Element Library User’s Manual):
cr i cr i cr
i D u
q = (1)
⎪⎭
⎪⎬
⎫
⎪⎩
⎪⎨
=⎧ cr
it cr cr in
qi
τ
σ and
⎪⎭
⎪⎬
⎫
⎪⎩
⎪⎨
=⎧ cr
it cr cr in
ui
γ
ε (2)
where σ is normal crack stress, incr τ shear crack itcr
stress, ε normal crack strain and incr γ shear crack itcr
strain.
⎥⎦
⎢ ⎤
⎣
=⎡ II
i I cr i
i D
D D 0
0 (3)
cr
D consists of i D and iI D . iII D represents the iI
Mode-I secant modulus that is determined by the stress-strain relation after cracking.
( )
⎥⎦
⎢ ⎤
⎣
= ⎡ cr
in cr in I in
previous i I
current i
D f
D, min , , εε (4)
where f representing the stress-strain relation after in
cracking is a function of crack strain. D is determined iI
by tensile strength and crack strain for normal concrete because the maximum tensile stress reaches tensile strength when strain reaches the limit value of elastic strain, meanwhile the first crack is reached and brittle failure/ strain softening occurs. But UHPFRC exhibits hardening behavior until crack saturation occurs because the volume fraction of steel fiber is 2% and it has finer and denser matrix. When the first crack is reached, the steel fiber connects the matrix together that results in the increase of load carrying capacity of UHPFRC. The number of cracking increases as the load increases. When crack saturation occurs, UHPFRC begins to exhibit softening behavior.
Thereby the crack strain of UHPFRC includes two parts: one is the crack strain hardening ε , the other crh the crack strain softening ε . crs D is determined by iI
yield tensile strength f , ultimate tensile strength t t′
f , crack strain hardening and crack strain softening for UHPFRC. Fig.6 shows the crack stress versus crack strain relationship of normal direction for crack
cr
σ
incr
ε
inf
t t′ f
crh
ε
inε
in,crultFig.6 Normal stress and strain relation after cracking
i in the n-t coordinate system, and Eq.5 gives the corresponding function.
( )
== in incr cr
in f ε
σ
( )
( ) ( )
( )
⎪⎪
⎪⎪
⎩
⎪⎪
⎪⎪
⎨
⎧
∞
<
<
≤
<
− −
′
≤
<
− +
′
cr in cr
ult in
cr ult in cr in crh in cr
ult in cr cr in
ult in crh in
t
crh in cr in t
cr crh in in
t t
f f f f
ε ε
ε ε ε ε
ε ε ε
ε ε ε ε
,
, ,
,
0
0
(5)
II
D representing the shear stiffness after cracking i
is written as
G DiII
ω ω
= −
1 (6)
where ω is the shear retention factor that is less or equal to one, but greater than zero, and G the initial shear stiffness.
The crack strain of each individual crack can be assembled into a vector which is denoted by u cr
{
cr cr cr icr ncr}
Tcr u u u u u
u = 1 , 2 , 3 ,..., ,..., (7)
Similarly, it is possible to assemble a vector which contains the crack stress for each crack
{
cr cr cr icr ncr}
Tcr q q q q q
q = 1 , 2, 3 ,..., ,..., (8)
The relation between the global strain ε and the cr vector u is expressed ascr
cr
cr=Au
ε (9)
where εcr =
{
εxcr,εcry ,εzcr,γcrxy,γcryz,γcrzx}
TThe relation between the global stress σ and the vector q is written as cr
σ
T
cr A
q = (10)
where σ =
{
σx,σy,σz,τxy,τyz,τzx}
TA is the assembled transformation matrix.
] ,..., ,..., , ,
[A1 A2 A3 Ai An
A= (11)
ny tx ty nx tz nz ty ny tx nx
ny nx nz
ny nx
i C C C C C C C C C C
C C C
C A C
⎢⎢
⎣
⎡
= 2 2 2 2 +
T
nx tz tx nz nz ty tz ny
nx nz nz
ny
C C C C C C C C
C C C
C
⎥⎥
⎦
⎤ + +
2
2 (12)
where Cij=cosϕij the cosine between the i axis and the j axis.
The fundamental feature of the decomposed crack model is the decomposition of the total strain increment d into an elastic strain increment ε dε e and a crack strain increment dε (Barros et al., cr 2004) as:
cr
e d
d
dε= ε + ε (13)
The relation between the stress increment vector and the strain increment vector in the global coordinate system can be derived starting from the strain decomposition which yields the relation for the global stress vector(Barros et al., 2004):
{
d d cr}
D
dσ = ε− ε (14)
where D is the structure elastic-strain stiffness matrix.
UHPFRC Young’s
modulus(GPa) 40 Uniaxial ultimate tensile strength ft′ (MPa) 12 Poisson’s ratio 0.25 Compressive
strength(MPa) 150
Yield tensile strength
f (MPa)t 8 The initial internal
frictional angle 37°
Table 3 Material parameters
( )( )
⎥⎥
⎥⎥
⎥⎥
⎥⎥
⎥⎥
⎦
⎤
⎢⎢
⎢⎢
⎢⎢
⎢⎢
⎢⎢
⎣
⎡
−
−
− −
−
−
−
= +
2 2 0 1 0 0 0 0
2 0 2 0 1 0 0 0
0 2 0
2 0 1 0 0
0 0 0 1
0 0 0 1
0 0 0 1
2 1 1
ν ν ν ν
ν ν
ν ν ν
ν ν ν
ν ν D E
(15) Combining Eq.1, Eq.9 and Eq.10, result in
[ ]
σεcr= ADcr −1AT (16)
So the crack strain increment can be expressed σ
ε A D A d
d cr= [ cr]−1 T (17)
Substituting Eq.17 into Eq.14, it can be got
{
ε σ}
σ Dd AD A d
d = − [ cr]−1 T (18)
Eq.18 is written after some algebraic manipulations as
ε
σ D DAD A DA A D d
d =[ − [ cr+ T ]−1 T ] (19)
2)Plasticity model for UHPFRC crushing
A plastic model that describes the crushing of the material can be combined with the multi-directional fixed crack model to be applicable for quasi-brittle material in Diana. In this paper, the Drucker- Prager criterion with an associated flow rule is used for UHPFRC crushing in the compressive region (Diana Element Library User’s Manual; Chen, 1982)
( )
I J I J k( )
pf 1, 2 =α 1+ 2 −β ε) (20)
I and 1 J are the first invariant of stress and the 2
second invariant of its deviator stress, respectively. α and β are the material parameters that can be expressed as(Diana Element Library User’s Manual):
( ) ( )
00
cos 3
cos 6 sin
3 sin 2
φ β φ
ε φ
ε α φ
= −
= −
p
)p
)
(21)
The angle of internal friction φ is a function of the internal state variable ε) . The internal state variable p
that controls the constitutive behavior of UHPFRC is defined by the plastic strain ε which describes the p
irreversible process of plastic deformation(Chen, 1982).
∫
= p
T p
p dε dε
ε) & & (22)
φ is the initial angle of internal friction. 0 k
( )
ε) is pa strain hardening-softening parameter that is also a function of the internal state variable ε) . p
The Drucker-Prager model offered by Diana can be directly employed to model the UHPFRC crushing and the work is to input material parameters. However a user-subroutine must be written to describe the tensile hardening and softening. In this subroutine, a command “TENPAR” and 4 pairs of values(σ, ) is ε used to determine the hardening-softening curve. This curve starts with a linear elastic slop from the origin to the yield tensile strength f , and then reaches the t
ultimate tensile strength ft′ , finally decreases zero.
The strains corresponding to the point of tensile stress origin,f , t ft′ and zero are respectively 0, 1.76e-4, 0.004 and 0.008. Table 3 presents the required material parameters that are determined by the experimental results of small specimen in the test(주 관연구기관 등, 2005).
3.3.2 The Prestressing Steel Constitutive Law and Yield Criterion
The perfect elastic-plastic model under von Mises yield condition is employed to describe the stress- strain relationship of the prestressing steel. The yield stress is 1000MPa, Steel Young’s modulus 210GPa.
Load and Deflection of FPW7L15
0 50 100 150 200 250 300 350
0 10 20 30 40 50 60 70 80 90
Deflection of Midspan (mm)
Load (KN)
numerical result test result
Load and Deflection of HPW7L15
0 30 60 90 120 150 180 210 240 270 300
0 10 20 30 40 50 60 70 80 90
Deflection of Midspan (mm)
Load (KN)
numerical result test result
Load and Deflection of NPW7L15
0 30 60 90 120 150 180 210 240 270 300
0 10 20 30 40 50 60 70 80 90
Deflection of Midspan (mm)
Load (KN)
numerical result test result
(a) (b) (c)
Load and Deflection of FPW7L15B
0 40 80 120 160 200 240 280 320 360 400
0 20 40 60 80 100
Deflection of Midspan (mm)
Load (KN)
numerical result test result
Load and Deflection of FPW7L10
0 50 100 150 200 250 300 350 400 450 500
0 5 10 15 20 25 30 35 40
Deflection of Midspan (mm)
Load (KN)
numerical result test result
Load and Deflection of FPW7L10B
0 50 100 150 200 250 300 350 400 450 500
0 10 20 30 40
Deflection of Midspan (mm)
Load (KN)
numerical result test result
(d) (e) (f)
Load and Deflection of FPW5L10
0 50 100 150 200 250 300 350 400 450
0 5 10 15 20 25 30 35 40
Deflection of Midspan (mm)
Load (KN)
numerical result test result
Load and Deflection of NPW5L10
0 30 60 90 120 150 180 210 240 270 300 330
0 5 10 15 20 25 30 35 40
Deflection of Midspan (mm)
Load (KN)
numerical result test result
Load and Deflection of HPW5L5
0 100 200 300 400 500 600 700 800 900
0 5 10 15 20 25
Deflection of Midspan (mm)
Load (KN)
numerical results test result
(g) (h) (i)
Load and Deflection of NPW5L5
test result
0 100 200 300 400 500 600 700 800
0 5 10 15 20 25 30
Deflection of Midspan (mm)
Load (KN)
numerical result
(j)
Fig.7 Load-deflection relationship 4. Analysis Results and Comparison with Test
Results
4.1 Load-Deflection Relationship
The load-deflection relationship at the loading point is shown in Fig.7, where the solid line represents the results of test, and the line with cross represents the results of finite element analysis. In each case, the
(a) First crack
(b) First diagonal crack
(c) Ultimate state
Fig.8 Cracking and crushing of specimen FP-W5-L10
(a) First crack
(b) First diagonal crack
(c) Ultimate state
Fig.9 Cracking and crushing of specimen NP-W5-L10
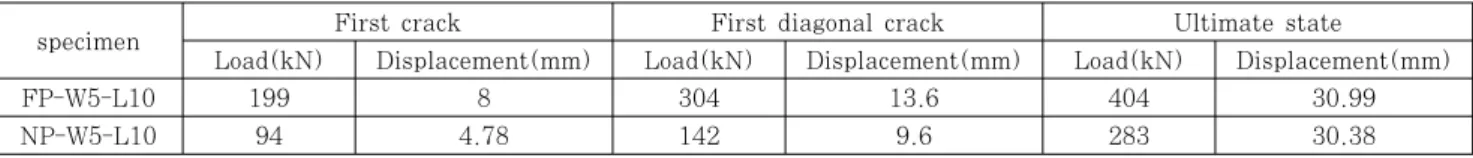
specimen First crack First diagonal crack Ultimate state
Load(kN) Displacement(mm) Load(kN) Displacement(mm) Load(kN) Displacement(mm)
FP-W5-L10 199 8 304 13.6 404 30.99
NP-W5-L10 94 4.78 142 9.6 283 30.38
Table 4 Load and mid-span displacement of numerical simulation
load-deflection curve consists of a relatively steep initial part representing the state before cracking, a less steep part caused by reduced cracked stiffness and a descending part when beam loses the load carrying capacity. In all the comparison, the largest gap between the two curves is in the Fig. 7(d), in which the numerical load and the experimental load are respectively 283kN and 260.18kN when the deflection is 46.81mm. The difference is controlled within 10%. Hence it can be observed that the numerical results are in good agreement with the test
results. The conclusion is that the constitutive model with the crack strain hardening in tensile region is effective to describe the material properties of UHPFRC and to simulate load-deflection relationship of UHPFRC I-beam.
4.2 The Simulation of Cracking and Crushing
In this subsection, the extent of cracking and crushing is simulated under the first crack load, the first diagonal crack load and the ultimate state load.
0 100 200 300 400
0 20 40 60 80 100
Deflection of Midspan(mm)
Load(KN)
NPW7L15 HPW7L15 FPW7L15 FPW7L15B
Fig.10 Prestressing influence on the results of finite element analysis
0 50 100 150 200 250 300 350 400 450 500
0 20 40 60 80 100 120
Deflection of Midspan(mm)
Load(KN)
FPW7L10 FPW7L15
Fig.11 Influence of shear-span ratio on the results of finite element analysis
Only the simulative results of specimen FP-W5-L10 and NP-W5-L10 are discussed and compared with the test results. Due to symmetry, the half-span cracking and crushing process of specimen FP-W5-L10 and NP-W5-L10 is shown in Fig.8 and Fig.9 respectively, in which the left figures are numerical results, and the right figures are test results. Table 4 presents the load and mid-span displacement of numerical simulation under the first crack load, the first diagonal crack load and the ultimate state load. The failure sequence of numerical simulation is as follows:
under the first crack load, the first crack occurs at the bottom near the mid-span. The cracking extends up and sideward as the load increases. Under the first diagonal crack load, a visible diagonal crack occurs.
There are lots of small cracks near the diagonal crack.
Under the ultimate state load, the cracking goes on extending, and then the UHPFRC I-beam loses the load carrying capacity and softening occurs. It can be seen from Fig.8(c) that crushing occurs at the upper surface of mid-span, however the obvious crushing can not be seen in Fig.9(c) because of no prestressing force
Compared the numerical results with the test results, it can be seen that the finite element models simulate the cracking and crushing of specimens very well and the mid-span deflection of numerical simulation approximates to the test results under the same load level. Hence a conclusion can be made from the above comparison that the finite element model fits to simulate the failure process of UHPFRC I-beam.
4.3 The Influence of Prestressing Force and Shear-Span Ratio on the Results of Finite Element Analysis
Fig.10 shows load-midspan deflection curve of specimens with shear span ratio 15. At the beginning of load, the prestressing force has hardly influence on the results, and all the specimens have the similar load-deflection relationship. Beyond the elastic region, the influence of prestressing force is obvious. The
more prestressing force, the more influence. The prestressing force enhances the carrying capacity, but has relatively little influence on the deflection. This result is same with that of test. The comparison of load-midspan deflection relationship of FPW7L10 with FPW7L15 is shown in Fig.11. It can be seen that the shear-span ratio has a substantial influence on the I-beam behavior. The I-beam with small shear-span ratio has greater load carrying capacity and deformation resistance capacity. Also this conclusion accord with that of test. Hence a conclusion can be made that the finite element model is effective to simulate the influence of the prestressing force and the shear-span ratio on the behavior of I-beam.
5. Conclusions
This paper presents the three-dimensional finite element analysis of UHPFRC I-beam and compares the numerical results with the test results. By investigation, the following conclusions can be made:
1) A multi-directional fixed crack criterion with tensile strain hardening defined in the tensile region fits to model the tensile behavior of UHPFRC
2) Druck-Prager criterion with an associated flow rule adopted in the compressive region is fit for modeling the compressive behavior of UHPFRC.
3) The tensile hardening after cracking must be considered when defining a constitutive model because of the characteristic of UHPFRC.
4) This finite element modeling is effective and precise to simulate the load-deflection relationship and the influence of prestressing force and shear-span ratio on the behavior of UHPFRC I-beam.
Acknowledgments
This paper was supported by Research Fund, Kumoh National Institute of Technology.
References
주관연구기관, 협동연구기관 (2005) 초고성능 시멘트 복합재 료를 활용한 교량 거더 개발.
Barros, J., Gettu, R. (2004) Material Nonlinear Analysis of Steel Fiber Reinforced Concrete Beams Failing In Shear, Proceedings of the Sixth International RILEM Symposium in Italy, Fiber Reinforced Concretes, pp.711~730.
Behloul, M. (2007) HPFRCC Field of Applications:
Ductal Recent Experience, 5th High Performance Fiber Reinforced Cement Composites(HPFRCC5), pp.213~222.
Chen, W.F. (1982) Plasticity in Reinforced Concrete, Book.
Chote. S., Barzin, M. (2007) Flexural Modeling of
Strain Softening and Strain Hardening Fiber Reinforced Concrete, 5th High Performance Fiber Reinforced Cement Composites(HPFRCC5), pp.155
~164.
Diana Element Library User’s Manual
Ekkehard, F., Michael, S. (2004) Ultra High Performance Composite Bridge Across the River Fulda in Kassel, International Symposium on Ultra High Performance Concrete in Germany, Ultra High Performance Concrete, pp.69~75.
Giovanni, M., Alberto M. (2007) Strengthening of R/C Beams with High Performance Fiber Reinforced Cementitious Composites, 5th High Performance Fiber Reinforced Cement Composites (HPFRCC5), pp.389~397.
Hsieh, S.S., Ting, E.C., Chen, W.F. (1988) Application of A Plastic–Fracture Model to Concrete Structure, Computer & Structure, 28(3), pp.373~393.
Imran, I., Pantazopoulous (2001) Plasticity Model for Concrete under Triaxial Compression, J.Engrg.
Mech, 127(3), pp.281~290.
Kittinum, S., Sherif, E.T. (2007) Three Dimensional Plasticity Model for High Performance Fiber Reinforced Cement Composites, 5th High Performance Fiber Reinforced Cement Composites(HPFRCC5), pp.231~240.
Nam, S.H. (2004) Finite Element Analysis Solution, Computational Structural Engineering, 17(3), pp.72~77.
Paul, A. (2004) Ductal Technology: A Large Spectrum of Properties, A Wide Range of Applications, International Symposium on Ultra High Performance Concrete in Germany, Ultra High Performance Concrete, pp.11~23.
Xuehui, A., Koichi, M., Tetsuya I. (2007) Life- span Simulation and Design Approach for Reinforced Concrete Structure, Computational Structural Engineering, 20(4). pp.3~17.