Print ISSN: 2288-4637 / Online ISSN 2288-4645 doi:10.13106/jafeb.2021.vol8.no8.0513
The Relationship Between Emotional Intelligence and Organizational Performance: An Exploratory Study in Bangladesh
Rebaka SULTANA
1, Mohammed Rafiqul ISLAM
2, Md. Tariful ISLAM
3, Farhana JESMIN
4, Shakila FERDOUS
5Received: April 30, 2021 Revised: July 08, 2021 Accepted: July 15, 2021
Abstract
Many organizations have realized that to stand out in today’s competitive business world, they need not only academic skills but also emotional intelligence (EI). This study aims to investigate the relationship between EI and the organizational performance of university teachers. The convenient sampling technique has been used to select 200 respondents from 25 universities, and a self-administered research instrument has been employed to collect data from the respondents. The reliability test of items is confirmed by Cronbach’s Alpha test using SPSS. Factor analysis has been used to find out the significant constructs of EI, which influence organizational performance. Likert scale and multivariate regression analysis have been used for measuring questionnaire items and testing hypotheses.
The key outcomes of this study suggest that interpersonal competence, job performance, effective leadership, motivation and creativity, and social competence have a vital influence on organizational performance. The study also reveals that a decision-making system should be developed and the policymakers and concerned authorities should give more emphasis on key variables of EI that are affecting the advancement of higher education. Further investigation is encouraged to identify the mediating and moderating effects of EI on the relationship between employee work engagement and job performance in the organization.
Keywords: Emotional Intelligence, Performance, Competence, University Teacher, Higher Education JEL Classification Code: I23, M10, M12
Its importance and relevance in various fields are being scientifically researched and asserted. Ambitious managers always give more emphasis on the high-level EI for ensuring success in the organization. Employees with higher EI are able to manage their time in a more efficient manner, maximizing their productivity. Besides, interpersonal competence, job performance, effective leadership, motivation and creativity, decision-making, and social competence are the outcomes of high-level EI (Utami et al., 2014). Emotionally Intelligent individuals are optimistic and are always naturally working towards a goal, whether personal, professional, or both.
These individuals have a growth mindset and they persevere no matter the obstacles they face (Ciarrochi et al., 2006).
This study aims to determine the phenomenon of EI among university teachers in higher educational institutions of Bangladesh. Universities in Bangladesh are mainly categorized into three different types: public, private, and international. Bangladeshi universities are affiliated with the University Grants Commission, a commission created according to the Presidential Order (P.O. No 10 of 1973) of the government of the People’s Republic of Bangladesh.
Universities in Bangladesh represent about 170 academic
1
First Author. Department of Business Administration, Bangladesh Army International University of Science and Technology (BAIUST), Bangladesh. Email: [email protected]
2
Corresponding Author. Department of Management, Jatiya Kabi Kazi Nazrul Islam University, Bangladesh [Postal Address: Trishal, Mymensingh, 2224, Bangladesh] Email: [email protected]
3
Department of Philosophy, Jatiya Kabi Kazi Nazrul Islam University, Bangladesh. Email: [email protected]
4
Department of Business Administration, Bangladesh Army International University of Science and Technology (BAIUST), Bangladesh. Email: [email protected]
5
Faculty of Business Administration, University of Brahmanbaria, Bangladesh. Email: [email protected]
© Copyright: The Author(s)
This is an Open Access article distributed under the terms of the Creative Commons Attribution Non-Commercial License (https://creativecommons.org/licenses/by-nc/4.0/) which permits unrestricted non-commercial use, distribution, and reproduction in any medium, provided the original work is properly cited.
1. Introduction
Emotional intelligence (EI) is considered a popular
and highly examined research phenomenon in recent times
(Ashkanasy, 2003; Bar-On et al., 2006), which has a great
influence on individual and organizational performance.
bodies of the conventional Higher Education Institution (HEI) in Bangladesh. Segmented by management and financial structure, Bangladesh has 53 public universities, 107 private universities, two international universities, two special universities, and two private universities dedicated solely to female students. Researchers from different schools of thought have discovered the contribution of EI.
EI explains possible outcomes, which can be mental and physical health, well-being, and social support. There is room for research in this particular area in the context of Bangladeshi public and private universities.
In addition, the productivity and commitment of university faculties are vital for the ultimate success of such educational institutions (Khan & Qianli, 2017). Teachers with a high level of EI carefully communicate with others having constructive aims and goals and also control their emotions more carefully rather than reacting to the situation.
To provide a high standard of education to students, it is important to identify the need for developing activities that improve the EI of teachers and equips them with the skills to deal with issues that require high EI.
This paper deals with the EI competencies to explain how they affect interpersonal competence, job performance, decision-making, effective leadership, motivation and creativity, and social competence among university professionals. For achieving this purpose, this study is divided into several segments. The introduction is followed by the literature review. The methodological section leads into the presentation of data and analysis, and the paper closes with a discussion, limitations, and indications for further research and conclusion.
2. Literature Review
The survival of organizations till now was relatively predictable. For the growth and sustainability of organi- zational performance, it is important that the organization focus on employees’ EI (Jorfi et al., 2014). There is a need to measure such EI to gauge an organization’s effectiveness.
The efficient and effective use of one’s abilities is called performance. In terms of a teacher’s performance, both the intellectual and physical aspects of teaching are taken into consideration by researchers. The ability of employees to utilize their competencies to achieve the goals of the organization is called organizational performance (Campbell et al., 1998).
In the case of teachers, work performance is studied in terms of teacher’s ability to reshape their behavior in accordance with the changing work environment and successfully complete the given task (Marsh, 1987; Medley, 1982). There are studies that show a positive relationship between employee performance and EI (McClelland, 1998; Sue-Chan & Latham, 2004; Law et al., 2004;
Nguyen et al., 2020). Competency research by Moradi and Ardahaey (2012) of 200 companies and organizations worldwide showed that employees with high EI had a high organizational performance.
Besides, understanding the emotions of employees in the working environment has been identified as a crucial factor for ensuring project success (Doan et al., 2020).
Researchers have established that individuals who scored high in EI enjoyed better health and well-being, exhibit better management effectiveness, show less stress, and displayed better work performance (Spector & Goh, 2001;
Slaski & Cartwright, 2002; Duran et al., 2004). The study also showed that emotion can predict satisfaction while satisfaction had an effect on performance in their workplace (Khan & Qianli, 2017). On the other hand, the research found an insignificant and negative effect of EI on the performance of the teachers (Ingsih et al., 2020). In these circumstances, it is crucial to examine the extent of the relationship between these two variables.
Researchers developed several motivational theories from individual and organizational perspectives. Among those, the ability and mixed models are given maximum attention. The ability model, developed by Salovey and Mayer (1997), presented EI as the set of different abilities and suggested that people vary in their emotional understanding and perception. To measure individual abilities, Mayer-Salovey-Caruso Emotional Intelligence Test (MSCEIT) is used, which provides a set of emotional problem- solving tasks. Unlike the ability model, the mixed model combines skills, competencies, and capabilities (Goleman, 1995; Bar-On et al., 2006). Bar-On’s model consists of five interrelated competencies, skills, and behavior clusters that were identified from academic literature. Specifically, they were considered because they were all perceived to impact the well-being and performance of employees.
2.1. Interpersonal Competence
Hogan and Warrenfelz (2003) defined interpersonal
skills as the behaviors and tactics people use to interact with
others effectively. Interpersonal competence is the ability to
interact with others and with the community. This includes
the ability to build and maintain healthy relationships
(Hunt & Baruch, 2003). According to Goleman (1998), an
individual’s success on the job relies 80% on EI and only
20% relies on intelligence quotient. This proves the value
of interpersonal skills in each organization (Doya et al.,
2007). A leadership style that encourages good workplace
interpersonal relationships will give the employees the
privilege of relating with one another, initiating good
suggestions as to how the task will be carried out, increase
teamwork, improved employee motivation which will
ultimately impact the level of the organization’s productivity.
H1: There is a significant relationship between inter
personal competence and organizational performance.
2.2. Job Performance
An employee’s performance can be ascertained by using a scale known as job performance. Previous studies suggested that EI is a potential predictor for job performance. Yoke and Panatik (2015) observed the relationship between EI and job performance among a sample of 192 school teachers from the primary and secondary schools of Peninsular, Malaysia, and the results showed that EI significantly correlated with the job performance. Al‐Hamdan et al. (2017) conducted a study on the EI ability of the Jordanian nurses and the findings of the study revealed a positive relationship between EI and job performance. Chipumuro (2015) found that a top performer is 85% to 127% more profitable than an average performer and that two-thirds of this variation can be accredited to EI.
Jaeger and Thompson (2003) explored the effect of EI on academic performance among a sample of 150 students in the northern United States.
H2: There is a significant relationship between job performance and organizational performance.
2.3. Effective Leadership
Important leadership skills highly depend on the competencies to understand and control emotions at the workplace; hence, the ability accompanied with EI will influence the capability to lead people. Mandell and Pherwani (2003) found that the level of EI significantly relates to the transformational leadership style. Goleman (2001) pointed out that leaders high in emotional intelligence are key to organizational success, and leaders must have the capacity to sense employee’s feelings in their work environment, to intervene when problems arise, to manage their own emotions to gain the trust of employees and understand the political and social conventions within an organization. Salicru (2005) emphasized that managers with a balanced mix of IQ and emotional intelligence perform a superior leadership compared to those that do not have this.
H3: There is a significant relationship between effective leadership and organizational performance.
2.4. Motivation and Creativity
An emotionally intelligent person can inspire his stance for himself and others, which produces better results in personal and work life. So, employees whose motivation
level is high are more prepared and dedicated to accomplish the organizational goals (Alavi et al., 2013). EI is a primary component from which motivation arises. People with a high level of EI have the ability to motivate one another. Lee and Olszewski-Kubilius (2006) defined creativity as the act of turning new and imaginative ideas into reality. Creativity is characterized by the ability to perceive the world in new ways, to find hidden patterns, to make connections between seemingly unrelated phenomena, and to generate solutions.
Creativity is needed for better employee performance results, besides that creativity can also be used as a basis for innovation, and organizational competitive advantage.
Employee creativity must be empowered, considering that if employees are given freedom or autonomy, they will maximize their skills which will then benefit the organization (Loo, 2019).
H4: There is a significant relationship between moti
vation and creativity and organizational performance.
2.5. Decision-Making
Decision-making is perhaps the most important component of a manager’s activities. It plays the most important role in the planning process. Many researchers agree that the key to excellent decision-making is the aggregate of both thinking and feeling in one‘s decisions.
Positive moods and emotions lead to better decision- making. The decision-making effects of any kind of bad mood can hinder a person’s job performance and lead to poor decisions that affect the company. In contrast, a positive mood can enhance creativity and problem- solving. George (2000) stated that emotions constitute potent, pervasive, predictable, sometimes harmful, and sometimes beneficial drivers of decision making. Research shows that EI enables us to make effective decisions.
Emotionally intelligent managers make better decisions by using emotions to improve judgments and see things clearly even when feelings are overpowering. Leaders with emotional intelligence tend to achieve their personal and organizational goals more effectively than leaders without that quality (Goleman, 2001; Boyatzis et al., 2000).
H5: There is a significant relationship between decision- making and organizational performance.
2.6. Social Competence
Social Intelligence (SI) is the ability to successfully
build relationships and navigate social environments
(Hughes et al., 2009). Singh (2006) studied social work
professionals psychologically. The study was conducted
on a sample of 178 participants. The findings depicted
role efficacy to be associated positively with emotional intelligence and internal locus of control, but negatively with an external locus of control. Similarly, emotional intelligence was found to be associated positively with internality but negatively related to externality. The findings also indicated that emotional intelligence alone accounts for 43% of the variance in role efficacy of social work professionals. Hopkins and Bilimoria (2008) in their study explored the relationship between emotional and social intelligence and organizational performance.
H6: There is a significant relationship between social competence and organizational performance.
3. Research Objectives
The core rationale of the research is to examine the relationship between emotional intelligence and organizational performance. The specific rationales of the research are as follows:
To examine the relationship between factors of EI and organizational performance.
To empirically test the impact of EI dimensions on the performance of university teachers.
4. Research Methodology
4.1. Sampling and Data Collection Technique A survey method was used to collect primary data from the respondents through a formed questionnaire and secondary sources were used for enhancing the insights of this paper, such as articles published in different journals, books, working papers, conference papers, and websites, etc. 200 universities teachers from 25 universities have been conveniently selected and included in the sample.
A pilot survey was also directed on 30 respondents to test the reliability of the questionnaire and to eliminate obscurity.
4.2. Questionnaire and Measurement Drivers The questionnaire consisted of twenty-five items to be responded on a five-point Likert scale and five questions related to general information such as gender, age, designation, educational qualification, and job experience.
The questionnaire was prepared based on existing literature to measure the factors affecting organizational performance. Part A consists of demographic information and Part B consists of selected items. The questionnaires used the drop-off and pick-up (DOPU) method, and prior research claimed that the DOPU method is an effective means to reduce potential nonresponse bias through increased response rate (Maclennan et al., 2011; Qader &
Zainuddin, 2011; Rubel et al., 2017). A total of twenty-
five drivers for the study on EI have been designed based on prior research (Hunt & Baruch, 2003; Goleman, 1998;
Yoke & Panatik, 2015; Al‐Hamdan et al., 2017; Mandell &
Pherwani, 2003; Alavi et al., 2013; George, 2000;
Goleman, 2001; Boyatzis et al., 2000; Hughes et al., 2009;
Hopkins & Bilimoria, 2008). The survey was conducted from January 2020 to September 2020.
4.3. Model Specification
The following regression model was proposed based on the review of literature:
Y = β
0+ β
1X
1+ β
2X
2+ β
3X
3+ β
4X
4+ β
5X
5+ β
6X
6+ ε Where, Dependent Variable
Y = Organizational Performance Independent Variables
X
1= Interpersonal Competence X
2= Job Performance
X
3= Effective Leadership X
4= Motivation and Creativity X
5= Decision Making X
6= Social Competence
β
1, β
2, β
3, β
4, β
5and β
6= Coefficient to estimate β
0= Constant and
ε = Error Term
5. Results
5.1. Reliability Analysis
Table 1 shows the Cronbach’s Alpha for interpersonal competence (0.716), job performance (0.699), effective leadership (0.689), motivation and creativity (0.793), decision making (0.737), social competence (0.792), and overall organizational performance (0.714). It satisfies the criteria as the alpha values are greater than 0.650, which indicates potential correlations between the indicators and the associated factors.
5.2. Demographic Statistics
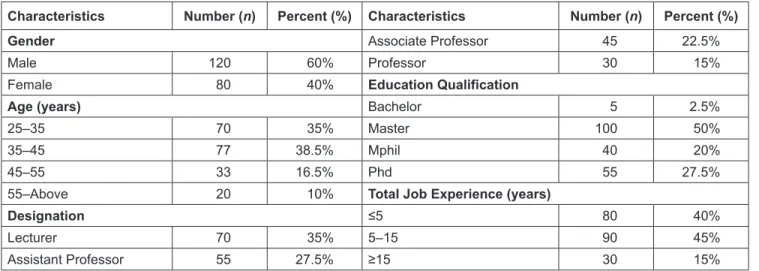
As shown in Table 2, males accounted for 60% whereas females accounted for 40%. 35% of the respondents were aged between 25–35, 38.5% were aged between 35–45, 16.5% were aged between 45–55, and the remaining 10%
were aged above 55. Regarding educational qualification, 2.5% of respondents were bachelor degree holders, 50%
were master degree holders, 20% were Mphil and the
remaining 27.5% were Ph.D. holders. Regarding their
jobs, 35% were lecturers, 27.5% were assistant professors, 22.5% were associate professors, and 15% were professors.
Furthermore, 40% of respondents were having job experience from 0–5 years, 45% between 5–15 years, and the remaining 15% were above 15 years.
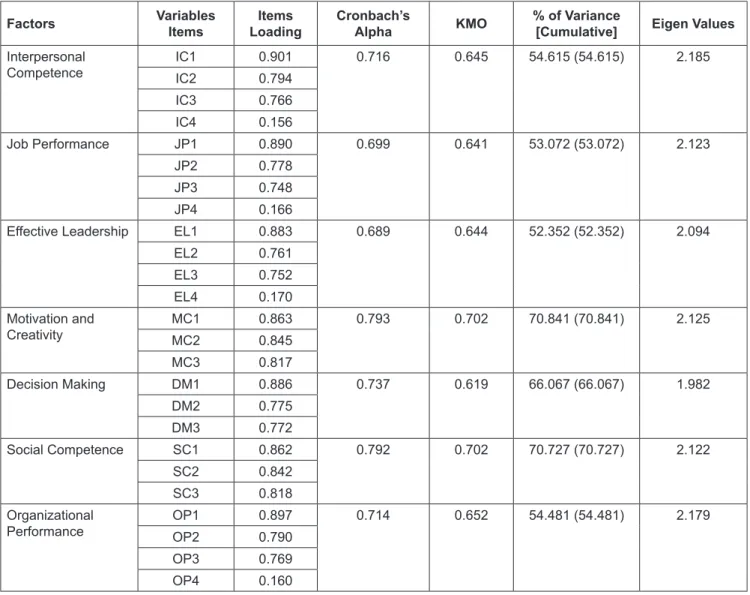
5.3. Factor Analysis
The study applied exploratory factor analysis to identify the structure of the latent variables. For conducting factor analysis, principal component analysis (PCA) was deployed for finding the maximum variance extracted from the variables with varimax rotation procedures (Table 3).
This criteria factor having eigenvalues higher than 1.0 is considered significant. Kaiser-Meyer-Olkin (KMO) measurement was used and the value of KMO is 0.50 or above indicates that data seems suitable for factor analysis suggested by Hair et al. (2003).
Dimension 1: The extracted first factor is interpersonal competence that shows an eigenvalue of 2.185 and the KMO
value is 0.645. This factor is represented by four variables (IC1, IC2, IC3, IC4) accounting for 54.615% of the variance.
The factor loadings of the variables range from 0.156 to 0.901 with four items relating to interpersonal sensitivity, emotional resilience, intuition, and conscientiousness.
Dimension 2: The second factor is job performance that shows an eigenvalue of 2.123 and KMO is 0.641. This factor is represented by four variables (JP1, JP2, JP3, JP4) accounting for 53.072% of the variance. The factor loadings of the variables range from 0.166 to 0.890 with four items relating to reading people, using emotions, understanding emotions, managing emotions.
Dimension 3: The third factor is effective leadership that shows an eigenvalue of 2.094 and the KMO value is 0.644.
This factor is represented by four variables (EL1, EL2, EL3, EL4) accounting for 52.352% of the variance. The factor loadings of the variables range from 0.170 to 0.883 with four items relating to self-awareness, controlling emotions, motivating oneself, and empathy.
Table 1: Reliability Test
Factors Cronbach’s Alpha No. of Variables Result
Factor-1: Interpersonal Competence 0.716 4 Reliable
Factor-2: Job Performance 0.699 4 Reliable
Factor-3: Effective Leadership 0.689 4 Reliable
Factor-4: Motivation and Creativity 0.793 3 Reliable
Factor-5: Decision Making 0.737 3 Reliable
Factor-6: Social Competence 0.792 3 Reliable
Factor-7: Organizational Performance 0.714 4 Reliable
Table 2: Demographic Characteristics of Respondents (n = 200)
Characteristics Number (n) Percent (%) Characteristics Number (n) Percent (%)
Gender Associate Professor 45 22.5%
Male 120 60% Professor 30 15%
Female 80 40% Education Qualification
Age (years) Bachelor 5 2.5%
25–35 70 35% Master 100 50%
35–45 77 38.5% Mphil 40 20%
45–55 33 16.5% Phd 55 27.5%
55–Above 20 10% Total Job Experience (years)
Designation ≤5 80 40%
Lecturer 70 35% 5–15 90 45%
Assistant Professor 55 27.5% ≥15 30 15%
Dimension 4: The fourth factor is motivation and creativity that shows an eigenvalue of 2.125 and the KMO value is 0.702. This factor is represented by three variables (MC1, MC2, MC3) accounting for 70.841% of the variance. The factor loadings of the variables range from 0.817 to 0.863 with three items relating to optimistic, creative, and better personality.
Dimension 5: The fifth factor is decision-making that shows an eigenvalue of 1.982 and the KMO value is 0.619. This factor is represented by three variables (DM1, DM2, DM3) accounting for 66.067% of the variance. The factor loadings of the variables range from 0.772 to 0.886 with three items relating to effective decision-making, problem-solving, and negotiation.
Dimension 6: The sixth factor is social competence that shows an eigenvalue of 2.122 and the KMO value is 0.702.
This factor is represented by three variables (SC1, SC2, SC3) accounting for 70.727% of the variance. The factor loadings of the variables range from 0.818 to 0.862 with three items relating to social awareness, social responsibility, and social relationship.
Dimension 7: The seventh factor is organizational performance that shows an eigenvalue of 2.179 and the KMO value is 0.652. This factor is represented by four variables (OP1, OP2, OP3, OP4) accounting for 54.481% of the variance. The factor loadings of the variables range from 0.160 to 0.897 with four items relating to emotional management, relationship management, adaptability, and stress management.
Table 3: Summary of Rotated Component Matrix, Cronbach’s Alpha, Kaiser-Meyer-Olkin (KMO), Variance and Eigenvalues
Factors Variables
Items Items
Loading Cronbach’s
Alpha KMO % of Variance
[Cumulative] Eigen Values Interpersonal
Competence IC1 0.901 0.716 0.645 54.615 (54.615) 2.185
IC2 0.794
IC3 0.766
IC4 0.156
Job Performance JP1 0.890 0.699 0.641 53.072 (53.072) 2.123
JP2 0.778
JP3 0.748
JP4 0.166
Effective Leadership EL1 0.883 0.689 0.644 52.352 (52.352) 2.094
EL2 0.761
EL3 0.752
EL4 0.170
Motivation and
Creativity MC1 0.863 0.793 0.702 70.841 (70.841) 2.125
MC2 0.845
MC3 0.817
Decision Making DM1 0.886 0.737 0.619 66.067 (66.067) 1.982
DM2 0.775
DM3 0.772
Social Competence SC1 0.862 0.792 0.702 70.727 (70.727) 2.122
SC2 0.842
SC3 0.818
Organizational
Performance OP1 0.897 0.714 0.652 54.481 (54.481) 2.179
OP2 0.790
OP3 0.769
OP4 0.160
Table 4: Correlation Test
1 2 3 4 5 6 7
1. Organizational Performance Pearson Correlation 1 Sig. (2-tailed)
2. Interpersonal Competence Pearson Correlation 0.996
**1 Sig. (2-tailed) 0.000
3. Job Performance Pearson Correlation 0.984
**0.980
**1 Sig. (2-tailed) 0.000 0.000
4. Effective Leadership Pearson Correlation 0.987
**0.983
**0.969
**1 Sig. (2-tailed) 0.000 0.000 0.000
5. Motivation and Creativity Pearson Correlation 0.879
**0.880
**0.863
**0.855
**1 Sig. (2-tailed) 0.000 0.000 0.000 0.000
6. Decision Making Pearson Correlation 0.924
**0.919
**0.900
**0.934
**0.863
**1
Sig. (2-tailed) 0.000 0.000 0.000 0.000 0.000
7. Social Competence Pearson Correlation 0.884
**0.880
**0.867
**0.860
**0.996
**0.869
**1
Sig. (2-tailed) 0.000 0.000 0.000 0.000 0.000 0.000
**Correlation is significant at the 0.01 level (2-tailed).
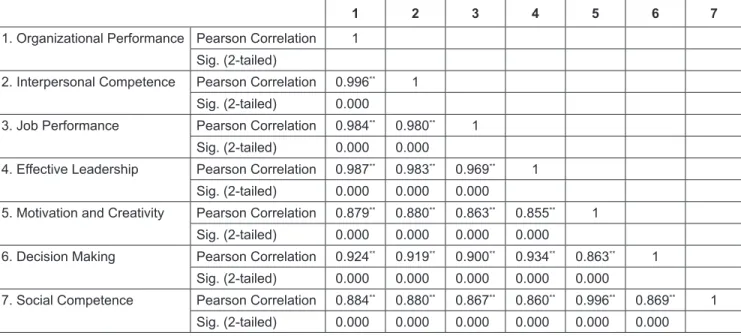
5.4. Correlation Analysis
A correlation matrix of all values of (r) for the independent variables along with the dependent variable is shown in Table 4. The result of Pearson correlation coefficient (r) shows that organizational performance is strongly correlated with interpersonal competence (r = 0.996, p = 0.01), job performance (r = 0.984, p = 0.01), effective leadership (r = 0.987, p = 0.01), motivation and creativity (r = 0.879, p = 0.01), decision making (r = 0.924, p = 0.01) and social competence (r = 0.884, p = 0.01), which indicates all factors have a great influence on organizational performance.
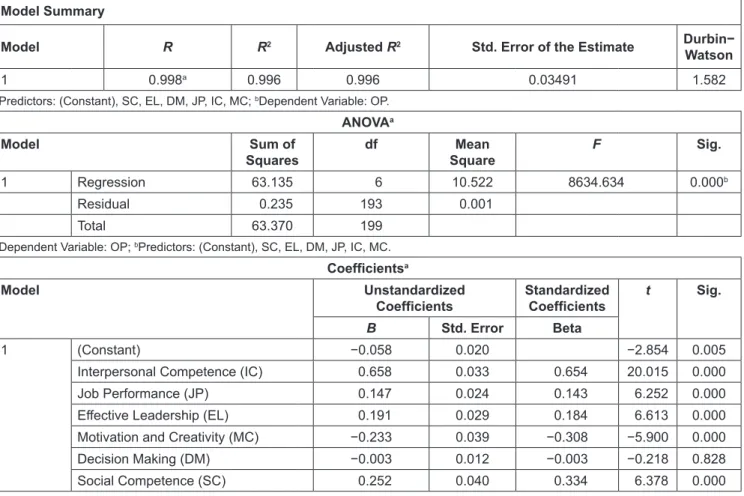
5.5. Regression Analysis
In Table 5, the interpersonal competence variable has (β = 0.658, p = 0.000), which means one unit change in interpersonal competence brought 0.658 unit change in organizational performance (while keeping other variables constant). The job performance variable has (β = 0.147, p = 0.000), which means one unit change in job performance brought 0.147 unit change in organizational performance (while keeping other variables constant). The effective leadership variable has (β = 0.191, p = 0.000), which means one unit of change in effective leadership brought 0.191 unit change in organizational performance (while keeping other variables constant). The motivation and creativity variables have (combined) (β = −0.233, p = 0.000), which means one unit of change in motivation and creativity brought −0.233 unit change in organizational performance (while keeping
other variables constant). The decision-making variable has (β = −0.003, p = 0.828), which means one unit of change in decision-making brought −0.003 unit change in organizational performance (while keeping other variables constant). The social competence variable has (β = 0.252, p = 0.000), which means one unit change in social competence brought 0.252 unit change in organizational performance (while keeping other variables constant).
The decision on the hypotheses is summarized in Table 6.
6. Discussion
Based on the analysis, the result shows that the most important factor of EI is interpersonal competence that affects organizational performance. The finding is consistent with previous research (Hunt & Baruch, 2003; Hogan &
Warrenfelz 2003). Job performance is shown as the second important factor of organizational performance and it necessitates the importance of giving employees the right feedback, rewards, and performance progress plan that may encourage better productivity (Tanchi, 2015; Azad et al., 2011). The result exhibits that decision-making activities do not impact organizational performance and the remaining five elements of EI such as interpersonal competence, job performance, effective leadership, motivation and creativity, and social competence have significant positive impacts on organizational performance. So, the linear relation can be interpreted as
Y = β
0+ β
1X
1+ β
2X
2+ β
3X
3+ β
4X
4+ β
5X
5+ β
6X
6+ ε
Table 5: Regression Analysis Model Summary
Model R R
2Adjusted R
2Std. Error of the Estimate Durbin−
Watson
1 0.998
a0.996 0.996 0.03491 1.582
a
Predictors: (Constant), SC, EL, DM, JP, IC, MC;
bDependent Variable: OP.
ANOVA
aModel Sum of
Squares df Mean
Square F Sig.
1 Regression 63.135 6 10.522 8634.634 0.000
bResidual 0.235 193 0.001
Total 63.370 199
a
Dependent Variable: OP;
bPredictors: (Constant), SC, EL, DM, JP, IC, MC.
Coefficients
aModel Unstandardized
Coefficients Standardized
Coefficients t Sig.
B Std. Error Beta
1 (Constant) −0.058 0.020 −2.854 0.005
Interpersonal Competence (IC) 0.658 0.033 0.654 20.015 0.000
Job Performance (JP) 0.147 0.024 0.143 6.252 0.000
Effective Leadership (EL) 0.191 0.029 0.184 6.613 0.000
Motivation and Creativity (MC) −0.233 0.039 −0.308 −5.900 0.000
Decision Making (DM) −0.003 0.012 −0.003 −0.218 0.828
Social Competence (SC) 0.252 0.040 0.334 6.378 0.000
a