ISSN: 2288-1115 (Print), 2288-1123 (Online)
─
─ 1 ─ ─
* Corresponding author: Tel: +1-609-434-0400, Fax: +1-609-637-0533, E-mail: [email protected]
Using Artificial Neural Networks for Forecasting Algae Counts in a Surface Water System
Emery A. Coppola Jr.*, Adorable B. Jacinto, Tom Atherholt
1, Mary Poulton
2, Linda Pasquarello
3, Ferenc Szidarvoszky
4and Scott Lohbauer
(NOAH, L.L.C., 610 Lawrence Road, Lawrenceville, New Jersey, 08648-4208, U.S.A.
1
Division of Science, Research, and Technology,
New Jersey Department of Environmental Protection, 401 East State Street, Trenton, New Jersey, 08625-0409, U.S.A.
2
Department of Mining and Geological Engineering, University of Arizona, Tucson, Arizona, 85721-0012, U.S.A.
3
Passaic Water Valley Commission, 1525 Main Avenue, Clifton, NJ, 07011, U.S.A.
4
Department of Systems and Industrial Engineering, University of Arizona, Tucson, Arizona 85721-0020, U.S.A.)
Algal blooms in potable water supplies are becoming an increasingly prevalent and serious water quality problem around the world. In addition to precipitating taste and odor problems, blooms damage the environment, and some classes like cyano- bacteria (blue-green algae) release toxins that can threaten human health, even causing death. There is a recognized need in the water industry for models that can accurately forecast in real-time algal bloom events for planning and mitigation pur- poses. In this study, using data for an interconnected system of rivers and reservoirs operated by a New Jersey water utility, various ANN models, including both discrete prediction and classification models, were developed and tested for forecasting counts of three different algal classes for one-week and two-weeks ahead periods. Predictor model inputs included physical, meteorological, chemical, and biological variables, and two different temporal schemes for processing inputs relative to the prediction event were used. Despite relatively limited historical data, the discrete prediction ANN models generally performed well during validation, achieving relatively high correlation coefficients, and often predicting the formation and dissipation of high algae count periods. The ANN classification models also performed well, with average classification percentages averaging 94 percent accuracy. Despite relatively limited data events, this study demonstrates that with adequate data collection, both in terms of the number of historical events and availability of important predictor variables, ANNs can provide accurate real-time forecasts of algal population counts, as well as foster increased understanding of important cause and effect relationships, which can be used to both improve monitoring programs and forecasting efforts.
Key words : algal blooms, artificial neural networks, forecasting models, water qual- ity, drinking water
ⓒ The Korean Society of Limnology. All rights reserved.
This is an open-access article distributed under the terms of the Creative Commons Attribution Non-Commercial License (http://creativecommons.org/licenses/by-nc/3.0/), which permits unrestricted non-commercial use, distribution, and reproduction in any medium, provide the original work is properly cited.
INTRODUCTION
Although there is general consensus among sci- entists that the incidence of algal blooms (AB) world-wide is increasing at an alarming rate (Smith et al., 2006), and the detrimental effects of these blooms on the environment and water sup- plies are well documented, controversy remains over the important factors and mechanisms res- ponsible for their occurrence, and the most effec- tive means for both modeling and forecasting this phenomena. Given the multitude, interplay, and complexity of various weather, water quality, bio- logical, and hydrologic factors, many of which will vary over space and/or time, complicated by ran- dom events, some researchers argue that there are no fast and true “rules” for predicting algal biomass and blooms. Researchers recognize that reliance upon mechanistic models for predicting algal biomass is insufficient, given our inadequate
“level of understanding of how these complicated ecological systems work” (Pelley, 2005).
Researchers have identified fundamental “nutri- ent” variables, primarily nitrogen and phospho- rous, as “limiting” to the growth of algae. Because nitrogen and phosphorous are often strongly cor- related with the quantity of algal biomass in water systems, researchers frequently develop models that predict algal biomass as a function of one or more of these compounds. Limiting the models to such highly reduced input-output rela- tionships, while efficient and sometimes effective, not only ignores the complexity of processes that determine nutrient levels, but also overlooks the myriad of other factors that can influence algal biomass. For example, nitrogen may originate from a number of different sources, and its chemi- cal form and concentration is dictated by differ- ent nitrogen processes, such as nitrification, which depends upon the presence of certain bacterial organisms. In some water systems, nutrients that might otherwise be considered limiting on the resident algal populations appear to persist within a range of concentrations that does not signifi- cantly affect the organisms.
Further complicating the dynamics of algal populations are the variety of physical and biolo- gical factors that influence the formation and dissipation of algal blooms. Sunlight is essential for the development of these photosynthetic organ- isms, and the amount of light that penetrates the
water column is controlled by a number of factors, each of which may have multiple effects upon the system. For example, precipitation not only re- flects a lower sunlight factor, but also influences the amount of turbidity in the water column via sediment transfer from rainfall run-off. The degree of run-off depends not only upon the quantity of precipitation, but also the size and characteristics of the watershed. Precipitation also increases sur- face water flow velocities which can stir up and suspend sediments from the bottom and scour sediments from the banks. Other factors that influence algal levels, like dissolved oxygen are similarly affected by other conditions of the sys- tem, such as water temperature, wind speed and direction, and the presence of other competing or even predatory organisms.
In a publication by the American Water Works Association Research Foundation entitled “Early Warning Management of Surface Water Taste and Odor Events” (Taylor et al., 2006), the authors evaluate six existing mechanistic-based computer simulation models used by the water industry “to predict the timing, magnitude, and duration of taste and odor events” associated with algal popu- lations. The authors discount four of the models on the basis that they are not capable of simulat- ing detailed hydrodynamic conditions, such as stratification and mixing, which influence algal populations. The authors assert: “A good program must be able to model many water quality vari- ables so that it can simulate a wide range of reser- voirs.” They note that only the two most advanced models can simulate three algae classes. However, they caution: “it is a very involved process that requires extensive data collection and model cali- bration and validation. The large front-end effort precludes these models from being used within time frames required for managing specific taste and odor events.” The authors carefully draw a distinction between simulation of algae growth, which two of the mechanistic models can perform
“reasonably well”, and the associated taste and odor problems caused by gesomin production and release from “blue-green algae concentrations.”
As an alternative paradigm to mechanistic
models often used for forecasting algal blooms,
artificial neural networks (ANNs) were used in
this study. In this study, various ANN algal fore-
casting models were developed for three surface
water sampling stations monitored as part of a
drinking water supply system of interconnected
rivers and reservoirs located in northeastern New Jersey. Using weather, water quality, hydrologic, and biological input variables, counts for three different algal classes were forecasted one-week and two-weeks ahead. The algal classes consider- ed in this study included the toxic cyanobacteria, better known as blue-green algae, chrysophyta (gold algae), and chlorophyta (green algae) classes.
There is previous work in the scientific litera- ture where ANNs were developed and tested for predicting algal blooms. Rechnagel and others (1997) applies the technology to four different freshwater systems. The paper first introduces the complexity and non-linearity of algal bloom dynamics and used at least six and up to ten years of what appear to be weekly data consisting of limiting nutrients, water temperature, light con- ditions, and, in one case, density data of zooplank- ton groups to train the ANN models to predict phy- toplankton organisms. Maier and others (1998) forecasted cyanobacteria in the River Murray using seven years of weekly data, consisting of eight input variables, was used to provide fore- cast algae counts four weeks into the future. As in the work presented in this paper, the authors concluded that adequate nutrients were available for algal growth, and hence were not limiting fac- tors for the river system studied. Lee and others (2003) developed ANNs to predict algae bloom dynamics of a coastal water system using water quality data that could be used in real-time. Kim and others (2012) used ANNs to forecast algae in a surface water reservoir using hydrologic, weather, and water quality data collected from an auto- matic data collection system.
The three primary study objectives in this pro- ject were: 1) to assess the feasibility of using arti- ficial neural networks (ANNs) as a real-time tool for accurately forecasting algae counts of three species, in surface water systems; 2) identify criti- cal climate, hydrologic, and water quality factors (i.e. variables) that may influence algae levels; 3) related to points 1 and 2 above; 3) assess the natu- ral time evolution of algae populations, which is particularly relevant to real-time prediction capa- bility.
This research differs from previous work in that two different ANN paradigms were developed and tested; multiperceptron nets for predicting final algal counts as a single (i.e. discrete) numerical output value, and radial basis function nets for predicting the bin or classification range of values
(pre-specified) within which final algal counts would fall. In addition, two different time schemes were used for assigning input variable values with their corresponding final algal counts; for the first case, model input values corresponded with measurements taken at the beginning of the pre- diction period, which would be most applicable for real-time forecasting, and for the second case, input value measurements generally correspond- ed with the conclusion of the prediction period.
Lastly, two different data sets were used; the first consisting of more input variables, but fewer his- torical data events, and the second excluded five select water quality variables that were measur- ed less frequently, but consisting of more histori- cal data events.
ARTIFICIAL NEURAL NETWORKS
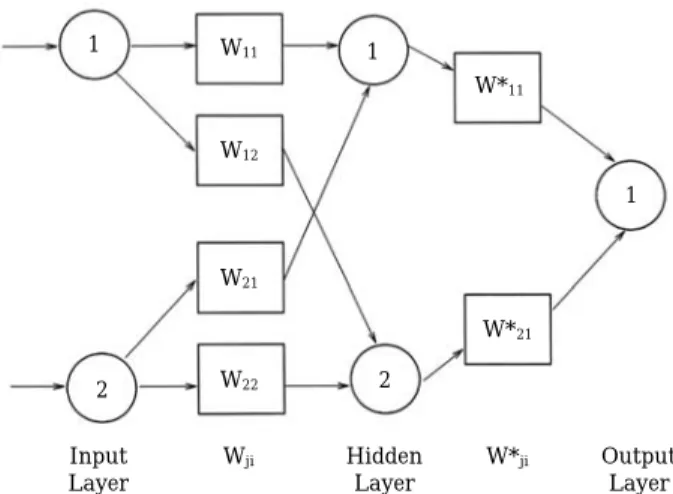
ANN architecture (Fig. 1) is based upon Kolmo- gorov’s theorem (Sprecher, 1965; Hecht-Nielsen, 1987) which asserts that any continuous function (in this case algal counts) can be represented exactly by a three-layer, feed-forward neural net- work with n elements in the input layer, 2n + + 1 elements in the hidden layer, and m elements in the output layer, where n and m are arbitrary positive integers. The presence of common arcs in its architecture allows ANN to identify impor- tant inter-relationships that may exist between output variables. ANN technology is a compelling alternative to physical-based modeling approaches (Poulton, 2001). ANN “learns” system behavior by processing representative data through its archi-
Fig. 1. Architecture for a simple multi-perceptron ANN.
Input Layer
Output Layer Hidden
Layer
W
jiW*
ji1 1
1
2 W
11W*
11W*
21W
12W
21W
222
tecture. ANN is different from physical-based models because it does not rely upon the govern- ing physical laws for making its predictions, and consequently, traditional model parameters are often not required for ANN development and ope- ration.
In this study, 50% of the available data was used for “training,” that is to “learn” cause and effect relationships if present. Another 25% of the data was used to “verify” the model, to guard against over-training or over-fitting the data. Fol- lowing training, the remaining 25% of the data was used to validate or assess how well the model learned to generalize system behavior. During training, data patterns are processed through the ANN and “connection weights” are adaptively adjusted until a minimum acceptable error bet- ween the ANN-predicted output and the actual output is achieved. At this point, the ANN has
“learned” to predict the system behavior of inter- est (in this case algal counts or classes) in res- ponse to the various input parameter values.
There are a variety of ANN model design fea- tures and options. To design an appropriate model, a variety of factors must be considered, including the functional form of the transfer functions, the number of hidden layers and nodes in the archi- tecture, the most appropriate set of input vari- ables, and the algorithm(s) used to minimize the objective function (i.e. training error). This process is typically conducted in an iterative manner within the context of professional judgment and modeling experience. For example, selection of an appropriate set of input parameters during initial ANN development requires a basic understand- ing of the governing system dynamics (e.g., factors known to influence AB). However, a “sensitivity analysis,” in conjunction with trial and error, can help the modeler converge on the most appropri- ate and feasible set of predictor variables. The sensitivity analysis, which quantifies the relative importance of each input variable for accurately predicting each output variable, can be used in lieu of common statistical methods.
ANNs require sufficient data that spans the range of expected system conditions to allow robust learning. Based upon the number of input and output parameters, heuristic equations were used to estimate the minimum number of train- ing data sets required for robust model develop- ment. Calculated estimates of the number of train- ing events (data sets) necessary for robust train-
ing in this study ranged from 200 to 500, depend- ing upon the ANN model used. Because of the number and complexity of environmental factors and their interactions which control AB dynamics, and given the expected “noise” in the data, the number of required training data sets is probably closer to 500. In this study, the number of data sets available in this study was well below 200.
STUDY AREA AND DATA
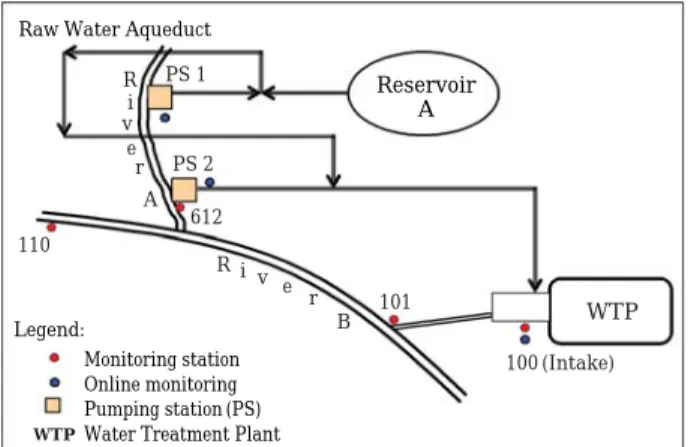
Fig. 2 represents the system modeled in this project, where for water security reasons, speci- fics are omitted. Two rivers and a reservoir sup- ply water to the water treatment plant (WTP).
River A flows into River B upstream of the WTP’s intake canal, while River B water is gravity fed to the WTP intake by way of the canal. Rivers A and B have historically exhibited variable and unique water quality characteristics that impart different treatment challenges. River B is consi- dered to be of lower water quality because of more numerous upstream contaminant sources. How- ever, River A has a higher incidence of AB events.
Because of their desire to forecast algae blooms and monitor overall water quality, the utility has an extensive watershed water quality monitoring program in place to assist with decision making for source water selection and prediction of water quality changes. Grab and online sample data are supplemented by United States Geological Sur- vey flow and water quality monitoring stations located throughout the watershed. The existing algal monitoring program consists of analyzing key water quality parameters and correlating
Fig. 2. Raw water configuration and station locations.
Reservoir A
Raw Water AqueductLegend:
Monitoring station Online monitoring Pumping station (PS) Water Treatment Plant WTP
PS 1
PS 2 612
101 110
R
R i
i v
v e
e r
r A
B
100 (Intake)
WTP
changes in concentrations to predictions of algal concentrations.
Previously collected (1999~2004) water quality data from Stations 100, 101, and 612 were provid- ed by the utility and used for model development and assessment. A total of 302 measurement events consisting of water quality, hydrologic, weather, pumping, and extraction data collected over the period January 1999 to August 2004 were used in the study. Climate data was obtain- ed from National Oceanographic and Atmospheric Administration (NOAA) and included total daily precipitation, average daily temperature, wind speed, and wind direction. There was no available
data for solar radiation; hence data for sky cover, heating degree days, and length of day were also used, with values for the two first variables also obtained from NOAA, and the last obtained from sunrise and sunset tables obtained on-line.
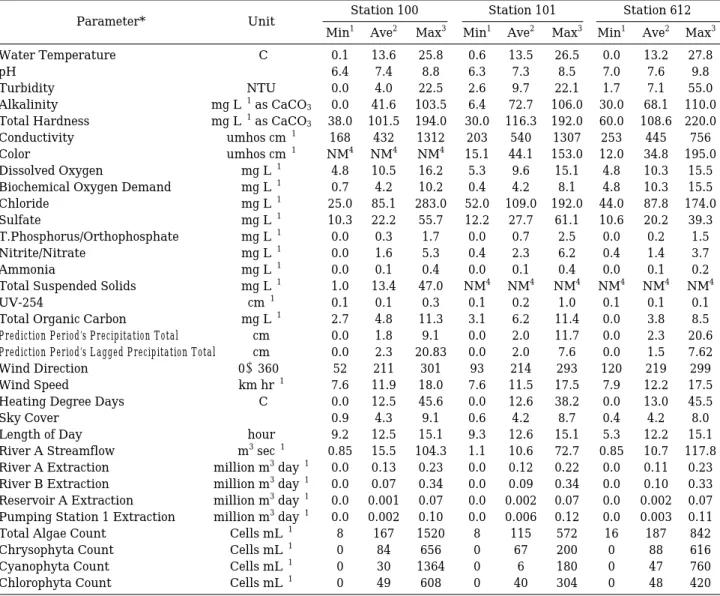
A listing of the model variables input values, as well as their minimum, average, and maximum values by station, are presented in Table 1.
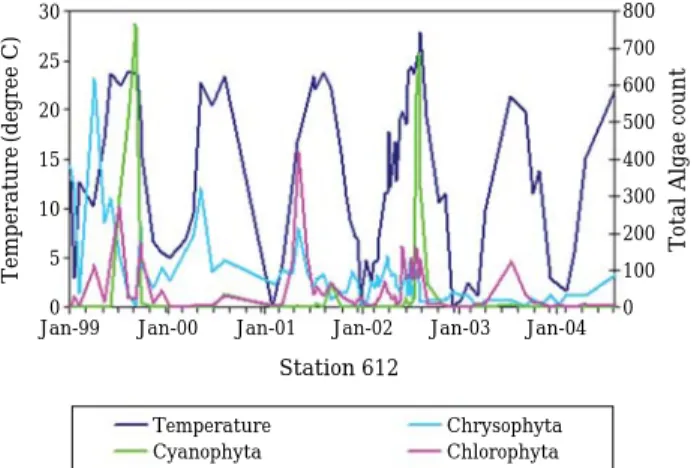
System conditions for algal populations, water quality, physical, and weather conditions vary by season. Representative time-series figures depict- ing algal counts for the three classes are plotted versus dissolved oxygen, nitrate, and water tem- perature in Figs. 3 through 5, respectively, provid-
Table 1. Statistical tabulation for all model variables used by Station.
Parameter* Unit Station 100 Station 101 Station 612
Min
1Ave
2Max
3Min
1Ave
2Max
3Min
1Ave
2Max
3Water Temperature � C 0.1 13.6 25.8 0.6 13.5 26.5 0.0 13.2 27.8
pH 6.4 7.4 8.8 6.3 7.3 8.5 7.0 7.6 9.8
Turbidity NTU 0.0 4.0 22.5 2.6 9.7 22.1 1.7 7.1 55.0
Alkalinity mg L
-1as CaCO
30.0 41.6 103.5 6.4 72.7 106.0 30.0 68.1 110.0 Total Hardness mg L
-1as CaCO
338.0 101.5 194.0 30.0 116.3 192.0 60.0 108.6 220.0
Conductivity umhos cm
-1168 432 1312 203 540 1307 253 445 756
Color umhos cm
-1NM
4NM
4NM
415.1 44.1 153.0 12.0 34.8 195.0
Dissolved Oxygen mg L
-14.8 10.5 16.2 5.3 9.6 15.1 4.8 10.3 15.5
Biochemical Oxygen Demand mg L
-10.7 4.2 10.2 0.4 4.2 8.1 4.8 10.3 15.5
Chloride mg L
-125.0 85.1 283.0 52.0 109.0 192.0 44.0 87.8 174.0
Sulfate mg L
-110.3 22.2 55.7 12.2 27.7 61.1 10.6 20.2 39.3
T.Phosphorus/Orthophosphate mg L
-10.0 0.3 1.7 0.0 0.7 2.5 0.0 0.2 1.5
Nitrite/Nitrate mg L
-10.0 1.6 5.3 0.4 2.3 6.2 0.4 1.4 3.7
Ammonia mg L
-10.0 0.1 0.4 0.0 0.1 0.4 0.0 0.1 0.2
Total Suspended Solids mg L
-11.0 13.4 47.0 NM
4NM
4NM
4NM
4NM
4NM
4UV-254 cm
-10.1 0.1 0.3 0.1 0.2 1.0 0.1 0.1 0.1
Total Organic Carbon mg L
-12.7 4.8 11.3 3.1 6.2 11.4 0.0 3.8 8.5
Prediction Period’s Precipitation Total cm 0.0 1.8 9.1 0.0 2.0 11.7 0.0 2.3 20.6 Prediction Period’s Lagged Precipitation Total cm 0.0 2.3 20.83 0.0 2.0 7.6 0.0 1.5 7.62
Wind Direction 0~360 � 52 211 301 93 214 293 120 219 299
Wind Speed km hr
-17.6 11.9 18.0 7.6 11.5 17.5 7.9 12.2 17.5
Heating Degree Days � C 0.0 12.5 45.6 0.0 12.6 38.2 0.0 13.0 45.5
Sky Cover 0.9 4.3 9.1 0.6 4.2 8.7 0.4 4.2 8.0
Length of Day hour 9.2 12.5 15.1 9.3 12.6 15.1 5.3 12.2 15.1
River A Streamflow m
3sec
-10.85 15.5 104.3 1.1 10.6 72.7 0.85 10.7 117.8 River A Extraction million m
3day
-10.0 0.13 0.23 0.0 0.12 0.22 0.0 0.11 0.23 River B Extraction million m
3day
-10.0 0.07 0.34 0.0 0.09 0.34 0.0 0.10 0.33 Reservoir A Extraction million m
3day
-10.0 0.001 0.07 0.0 0.002 0.07 0.0 0.002 0.07 Pumping Station 1 Extraction million m
3day
-10.0 0.002 0.10 0.0 0.006 0.12 0.0 0.003 0.11
Total Algae Count Cells mL
-18 167 1520 8 115 572 16 187 842
Chrysophyta Count Cells mL
-10 84 656 0 67 200 0 88 616
Cyanophyta Count Cells mL
-10 30 1364 0 6 180 0 47 760
Chlorophyta Count Cells mL
-10 49 608 0 40 304 0 48 420
1
minimum,
2average,
3maximum,
4not measured
*Total Amorphous Materials measured as Light, Medium and Heavy
ing an overview of the complexity and a general lack of transparent consistency in system condi- tions and algal counts.
MODELING METHODOLOGY
Because reliable weather forecasts generally do not extend beyond one- to two-week time periods, ANN models were developed for one-week and two-week ahead forecasting periods. Two differ- ent time schemes were used for computing the values of the ANN model inputs variables. The first, referred to as “original”, consisted of input values measured at the beginning of the predic- tion periods. The second, referred to as “revised”, used input values measured at the end of the pre-
diction period, coinciding with the final or predict- ed algal count.
Both the original and revised approaches were assessed using two distinct data sets. The first set consisted of a smaller number of time-coinci- dent events, but which included a higher number of input variables. The second set, by excluding several less-frequently-sampled water quality parameters (total phosphorous/ortho-phosphate, nitrite/nitrate, sulfate, and total organic carbon for all stations and biological oxygen demand for Stations 101 and 612), consisted of a larger num- ber of data events but with fewer input variables.
In order to help identify potentially important predictor variables, time series were developed depicting different variables versus algae counts.
For example, Figs. 3, 4, and 5 depict oxygen con- centrations, temperature, and nitrite/nitrate ver- sus algae counts, respectively. As can be seen, there are not obvious relationships between poten- tial predictor and prediction (i.e., algae count) variables. In addition, a sensitivity analysis was performed by computing a sensitivity ratio, math- ematically defined as the root mean squared error of ANN predictions without a particular input variable divided by the mean squared error of ANN predictions with the input variable. For example, a sensitivity ratio of 2.0 indicates that removing the particular input variable increases the RMSE by a factor of 2, while a value of 1.06 indicates that inclusion of the predictor variable has minimal effect on improving prediction accu- racy.
As an alternative to developing ANN models
Fig. 3. Total algae counts versus dissolved oxygen concen- tration measured at Station 101.
16 14 12 10 8 6 4 2 0
Jan-00 Oct-00 Aug-01 Jun-02 Apr-03 Feb-04
Station 101
Dissolved Oxygen Chrysophyta
Cyanophyta Chlorophyta
350 300 250 200 150 100 50
-1
Dissolved Oxygen (mg L )
0Total Algae count
Fig. 4. Total algae counts versus temperature measured at Station 612.
30
25
20
15
10
5
0
Jan-99 Jan-00 Jan-01 Jan-02 Jan-03 Jan-04
Station 612
Temperature Chrysophyta
Cyanophyta Chlorophyta
800 700 600 500 400 300 200 100 0
Temperature (degree C) Total Algae count
Fig. 5. Total algae counts versus Nitrite/Nitrate concentra- tion measured at Station 100.
6
5
4
3
2
1
0
Apr-99 Jan-00 Nov-00 Sep-01 Jul-02 May-03
Station 100
Nitrite/Nitrate Chrysophyta
Cyanophyta Chlorophyta
1600 1400 1200 1000 800 600 400 200 0
Nitrite/Nitrate (mg L
-1) Total Algae count
that explicitly predict final measured algal counts, RBF nets were developed to predict the pre-spe- cified bins or classification ranges within which the final measured algal counts fall. For this modeling exercise, the following four bins or clas- sification ranges were selected: 0 to 10 counts, 11 to 50 counts, 51 to 200 counts, and 201 and above counts. The original model input sets were used and included both the complete and reduced para- meter sets. Station 101 was used for predicting chlorophytes bins one-week ahead and chryso- phytes bins two-weeks ahead. Station 612 was selected for predicting chrysophytes bins one-week ahead and chlorophytes bins two-weeks ahead.
The ANN models consisted of multiple input variables to predict a single output variable, con- sisting of the algae counts for the multi-percep- tron ANN, and the bin or classification range for the radial basis nets. Various different combina- tions of input variables listed in Table 1 were used to forecast the final algae counts at the end of the forecast period (i.e., one week ahead or two weeks ahead), and using sensitivity analyses, input variables were reduced. The number of historical data events available for the different station and algae ranged from just 32 to 270. The profession- al software Statistica was used to perform the ANN modeling work presented in this study.
RESULTS
The models developed with both one-week and two-week ahead prediction periods accurately predicted formation and dissipation of AB events, as well as the relative increase and decrease in cell counts. On the basis of validation correlation coefficients, the ANN models that used inputs measured at the beginning of the prediction period slightly outperformed the models that used inputs measured at the conclusion of the prediction periods, but the difference in validation perfor- mance was not significant (r= =0.72 vs. 0.69). The importance of this result, however, indicates that real-time predictive accuracy can be achieved.
The models that forecasted discrete algal count values achieved the highest performance in most cases when the less-frequently measured water quality parameters were excluded as input vari- ables (r of 0.77 versus 0.63). In this case, r repre- sents the correlation coefficient. Correlation coef- ficients range between -1 and + + 1, with values
close to + + 1 indicating a strong positive correla- tion between predicted and measured values, and values closer to 0 indicating little correlation.
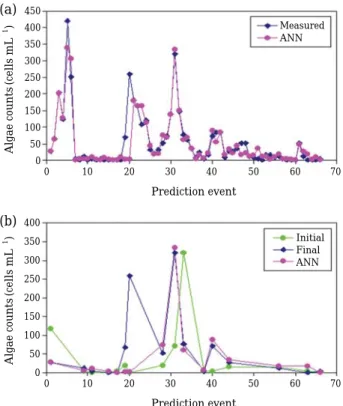
Figs. 6 through 8 provide a visual assessment of model performance for three representative cases, where the validation data show the initial algal count corresponding to the prediction event.
The validation series labeled “initial” in the fig- ures designates the initial count measured at the beginning of the prediction period, “final” desig- nates the final algal count measured at the con- clusion of the prediction period (i.e., that which is being predicted), and “ANN” designates the final count predicted by the ANN model.
The models that predicted algal concentration ranges (i.e., classification nets or “bins”) rather than actual counts also achieved high forecasting performance. Three of the eight models that in- cluded all of the input parameters achieved 100 percent classification accuracy. The worst-per- forming net correctly classified 83 percent of the events. For this approach, the models that includ-
Fig. 6. Time-series plots of measured Chlorophyte counts and ANN one-week ahead predicted values for (a) complete and (b) validations data sets at Station 101 (Revised Model excluding five water quality inputs).
450 400 350 300 250 200 150 100 50 0
Measured ANN
Initial Final ANN 400
350 300 250 200 150 100 50 0
(a)
(b)
0 10 20 30 40 50 60 70
Prediction event
0 10 20 30 40 50 60 70
Prediction event
Algae counts (cells mL
-1) Algae counts (cells mL
-1)
ed the less-frequently-sampled inputs (phosphate, nitrate, etc.) slightly outperformed those that did not, with correct classification percentages of 96 and 92 percent, respectively. However, the models that excluded these parameters had approximate- ly three times the number of available data sets and hence had more events which bordered two adjacent classification bins. All incorrect classifi- cations for all models occurred within an adjacent bin (e.g., a measured count of 8 which placed the count in the 0~10 bin, while the predicted bin was 11~50). Given the inherent imprecision of algal counts (Maier et al., 1998) this performance is more than acceptable for informed water utility decisions.
CONCLUSIONS
The results of this study demonstrate that ANN technology can be used to accurately forecast algal population counts in real-time for periods ranging
from one-week to two-weeks ahead using readily available water quality, hydrologic, weather, and water extraction data. The major findings of this research include:
�Despite a very limited number of available data sets, the ANN models performed well in most cases during validation, accurately predicting large changes in algal cell populations. The degree of accuracy was surprising, given the complexity and non-linear behavior of algal populations, inherent data “noise”, and the rela- tively small number of historical events avail- able for model training.
�The ANN models that forecasted algal count values (instead of classification ranges) achieved the highest performance when the less-frequ- ently measured water quality variables (phos- phate, nitrate, sulfate, TOC and BOD) were excluded as input variables. This may be due to a data quantity issue rather than inherent importance of these parameters to algal cell growth, but it could also be that, at the concen-
Fig. 7. Time-series plots of measured Chlrophyte counts and ANN one-week ahead predicted values for (a) complete and (b) validations data set at Station 101 (Original Model excluding five water quality inputs).
450 400 350 300 250 200 150 100 50 0
Measured ANN
Initial Final ANN 350
300 250 200 150 100 50 0
(a)
(b)
0 10 20 30 40 50 60 70 80 90 100 110
Prediction event
0 10 20 30 40 50 60 70 80 90 100 110
Prediction event Algae counts (cells mL
-1) Algae counts (cells mL
-1)
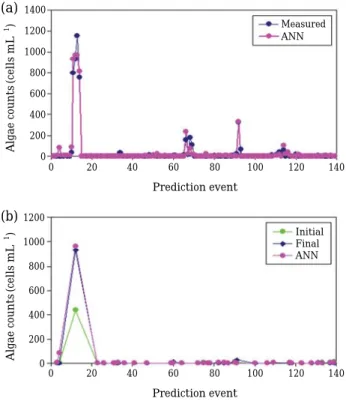
Fig. 8. Time-series plots of measured Cyanobacteria counts and ANN two-week ahead predicted values for (a) complete and (b) validations data set at Station 612 (Original Model excluding five water quality inputs).
1400 1200 1000 800 600 400 200 0
Measured ANN
Initial Final ANN 1200
1000
800
600
400
200
0
(a)
(b)
0 20 40 60 80 100 120 140
Prediction event
0 20 40 60 80 100 120 140