Prediction of Corn Yield based on Different Climate Scenarios using Aquacrop Model in Dangme East District of Ghana
Aquacrop 모형을 이용한 Ghana Dangme 동부지역 기후변화 시나리오 기반 옥수수 생산량 예측
George Blay Twumasi*・ Ahmad Mirza Junaid*・ Yongchul Shin**・ Kyung Sook Choi**,† 죠지 블레이 투마시 ・ 아흐메드 미르자 주네이드 ・ 신용철 ・ 최경숙
Abstract
Climate change phenomenon is posing a serious threat to sustainable corn production in Ghana. This study investigated the impacts of climate change on the rain-fed corn yield in the Dangme East district, Ghana by using Aquacrop model with a daily weather data set of 22-year from 1992 to 2013. Analysis of the weather data showed that the area is facing a warming trend as the numbers of years hotter and drier than the normal seemed to be increasing.
Aquacrop model was assessed using the limited observed data to verify model’s sufficiency, and showed credible results of R2 and Nash-Sutcliffe efficiency (NSE). In order to simulate the corn yield response to climate variability four climate change scenarios were designed by varying long-term average temperature in the range of ±1 °C ~ ±3 °C and average annual rainfall to ±5 % ~ ±30 %, respectively. Generally, the corn yield was negatively correlated to temperature rise and rainfall reduction. Rainfall variations showed more prominent impacts on the corn yield than that of temperature variations. The reduction in average rainfall would instantly limit the crop growth rate and the corn yield irrespective of the temperature variations.
Keywords:corn yield; climate change; aquacrop; Ghana
* Department of Agricultural Civil Engineering, Kyungpook National University
** Department of Agricultural Civil Engineering, Institute of Agricultural Science & Technology, Kyungpook National University
† Corresponding author
Tel.: +82-53-950-5731 Fax: +82-53-950-6752 E-mail: [email protected]
Received: October 28, 2016 Revised: November 15, 2016 Accepted: December 1, 2016
Ⅰ. INTRODUCTION
Many studies have explicitly demonstrated the negative climate change impacts on the agricultural production throughout the world (Waongo et al., 2015). The most prominent and obvious consequences of climate change include the temperature rise and varying rainfall patterns governing the warmer and drier weather conditions along with an anticipated increase in frequency and intensity of extreme climatic events such as droughts and floods (Masanganise et al., 2012).
The agriculture sector of sub-tropical and tropical African countries is distinctively vulnerable to these climate changes
since most of the crops have already reached the upper limits of their temperature sensitivity. Moreover, majority of the food and cereal production in these countries comes from the small-scale rain-fed farming systems with limited options of irrigation water availability. This constitutes a very fragile agricultural system that is extremely vulnerable to adverse climate change impacts on crop productions, thus greatly influencing the regional food security issues (Waongo et al., 2015; Tachie-Obeng et al., 2010).
For Ghana, like many other African countries, agriculture plays a pivotal role for economic development and food security. According to Ministry of Food and Agriculture (MOFA) of Ghana, the annual contribution of agriculture sector in gross domestic production (GDP), foreign exchange revenue, employment and provision of food is over 35 %.
Corn is the most important agricultural product, mostly grown under rain-fed conditions and consumed as the staple food to meet the country’s growing food demands (Doss and Morris, 2000). Corn production accounts for 45 % of the total agri- cultural production whereas, corn and corn-based food items accounted for 10.8 % of total food expenses of all the
Fig. 1 Study area: Dangme East District households in Ghana (Browne Klutse et al., 2013). Therefore,
sustainable corn cultivation is crucial to address the critical food security issues.
Review of the previously conducted studies in West Africa has emphasized that the projected future climate changes would have negative impacts on crop yields. For the West African countries located within the lower latitudes such as Ghana, yields of the cereal crops are projected to decrease in the range of 10 % to 20 % by 2050 mainly because of the warmer and drier weather, whereas, crop yields from the rain-fed agriculture are expected to decline up to 50 % by the end of 2020 (Thornton et al., 2006; IPCC, 2007; Roudier et al., 2011; Jones and Thornton, 2003). These studies mostly predict the general climate change impacts on the crop yields under the Sahelian climatic conditions characterized by downward trend of rainfall and upward trend of temperature.
Although these results are helpful to portray an overall picture of the situation but may not be useful for modeling and planning purposes at regional scale as the rainfall mechanism in the drier Sahel regions and humid coastal regions are quite different. The former region experiences a single rainfall peak in summer season whereas the later has a bimodal seasonal rainfall distribution (Owusu and Waylen, 2009).
In Ghana, several kinds of rainfall regimes coexist from the coast in the south to the Sahelian region in the north with highly variable spatial and temporal trends (Manzanas et al., 2014). Recent studies regarding the climate change impacts
on crops and socioeconomic conditions are mainly confined to savanna and forest savanna transitional zones in the northern Ghana as most of the corn producing areas falls under these regions (Tachie-Obeng et al., 2013; Tachie-Obeng et al., 2010; Armah et al., 2011; Armah et al., 2010). These studies cannot fully explain the climate change impacts on crops in the coastal regions of Ghana. This necessitates the need of a study analyzing the corn yield response towards climate change in the coastal regions of Ghana.
In this study, Aquacrop model (version 4) was used to estimate the corn yield responses towards climate variability.
Aquacrop is a water-driven crop growth-simulating model and is preferred in the climatic conditions where water is the main limiting factor for crop production. The model was selected as it has been tested and verified to simulate the yields of various crops under contrasting environmental and management conditions (Abedinpour et al., 2012; Mkhabela and Bullock, 2012). The main objective of the study was to estimate the probable adverse climate change impacts on the rain-fed corn yield in the coastal region of Ghana.
Ⅱ. MATERIALS AND METHODS
1. Study area
The study was conducted for the corn producing area of the Dangme East District, located in the coastal region of Ghana as shown in Fig. 1. The study area covers 909 km2 of
Table 1 Site specific crop information used in the study
Parameter Description
Soil type Sandy loam
Cultivar/Variety Obaatampa
Days to maturity 120 days
Sowing date 22 March
Harvesting date 19 July
Plant density 62,500 plants/hectare Fertilizer rate 0.7 ton/hectare for NPK
0.5 ton/hectare for urea land mass about 60 % of which is used for agricultural activities.
The major crops cultivated in the area include corn, watermelon, tomato and pepper. The corn covers approximately 70 % of the total cultivated area. The area receives bimodal rainfall between March and July and between mid-October and November. The climate of study area is predominately humid with average humidity of 87 % and mean annual air tem- perature of 28 °C. The soils in the study area are of deep well-drained sandy loam structure.
2. Aquacrop application
Aquacrop model (Version 4.0) developed by the Food and Agriculture Organization (FAO) was used to simulate the corn yield response to climate change. The detailed discussion about the model’s theoretical background and calculation procedure can be referenced from Raes et al. (2009) and Steduto et al. (2009).
The model simulates the yield by incorporating different sub-model components including the soil, climate, crop and management modules, each requiring a specific set of infor- mation as input parameters. The required soil parameters include the hydraulic conductivity, permanent wilting point, field capacity and saturated moisture contents. These para- meters were taken from the Raes et al., 2009 and Heng et al., 2009 for the sandy loam soil textural class. The model requires maximum and minimum temperature, reference evapotranspi- ration (ETo) and rainfall data as input in the climate interface.
A weather data set of 22 years from 1991 to 2013 including daily maximum temperature, minimum temperature, relative humidity, wind speed, sunshine hours and rainfall, for the study area, was collected from the Ghana Metrological Agency.
FAO-Penman-Monteith equation was used to estimate the
ETo.
The site-specific crop related information such as cultivar, number of days to maturity, sowing and harvesting dates, duration of crop growth stages, planting density and sowing depths was collected from the regional office of the Directo- rate of Crops, MOFA, Ghana as shown in Table 1. The conservative parameters which are considered constant for a specific crop irrespective of the location, were referenced for corn from Heng et al., 2009 and Hsiao et al., 2009. No irrigation was considered as majority of the farmers in the study area grow corn under rain-fed conditions.
3. Model verification and evaluation criterion The Aquacrop model performance was evaluated statistically using the Nash-Sutcliffe efficiency (NSE) and Coefficient of determination (R2) as shown in Eq. (1) and Eq. (2). The observed corn yield data were collected from the MOFA.
The model was calibrated with the observed yield data from 1992 to 2002 and verified using the data from 2003 to 2013.
NSE ∑i n Oi Omean
∑i n Oi Si
(1)
where Oi = Observed yield for the ith year Si = Simulated yield for the ith year Omean= Mean of the observed yield n = Number of observations
R
∑i n Oi Omean
∑i n Si Smean∑i n Oi OmeanSi Smean
(2)where Oi = Observed yield for the ith year Si = Simulated yield for the ith year Omean= Mean of the observed yield Smean= Mean of the simulated yield n = Number of observations.
4. Design of climate change scenarios
Historically, during the last 40 years of twentieth century the recorded temperature of Ghana has risen up to 1 °C whereas runoff and rainfall has decreased up to 30 % and 20
%, respectively. These climate variables in combination with
Table 2 Detail of the designed climate change scenarios
Scenario Description Range of variation
Temperature Rainfall
Scenario A Increase in temperature and decrease in rainfall +1 °C ~ +3 °C -5 % ~ -30 % Scenario B Decrease in temperature and increase in rainfall -1 °C ~ -3 °C +5 % ~ +30 % Scenario C Decrease in both temperature and rainfall -1 °C ~ -3 °C -5 % ~ -30 % Scenario D Increase in both temperature and rainfall +1 °C ~ +3 °C +5 % ~ +30 %
Fig. 2 Trend of rainfall and temperature other environmental factors particularly affected the cereal
crop production. Rainfall variability has also significantly influenced the root crop yields in Ghana during 1970 to 2003 (Armah et al., 2011).
In order to predict the climate change impacts on crop yield in a study domain, it is essential to define the climate scenarios based on the most influential climate variables (Roudier et al., 2011). In this study, four climate change scenarios were designed based on the temperature and rainfall variations. The scenario A involves the rise in temperature and decrease in rainfall; the scenario B involves the increase in rainfall and decrease in temperature; the scenario C represents the decrease in both the temperature and rainfall and the scenario D shows the increase in both temperature and rainfall. Under each climate scenario, temperature was varied in the range of ±1 °C ~ ±3 °C with 1 °C interval along with ±5 %, ±10 %, ±20 % and ±30 % variation in the rainfall.
The detail of the climate scenarios is presented in Table 2.
Long-term average values of temperature and rainfall were used to generate the climate scenarios. The corn yield was simulated using the Aquacrop model under the climatic conditions of each scenario.
Ⅲ. RESULTS AND DISCUSSION
1. Climatic trends in the study area
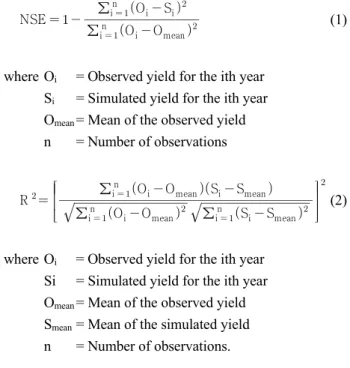
Variations in annual rainfall, maximum temperature and minimum temperature were analyzed, for each year from 1991 to 2013, to detect the possible change trend in these variables and the results are shown in Fig. 2 (a-c). The difference between the long-term average values of the variables with each individual year value was also calculated as shown in Fig. 3 (a-c). The area received an annual average rainfall of 785 mm. The average minimum and maximum
Fig. 3 Difference from the long-term average value
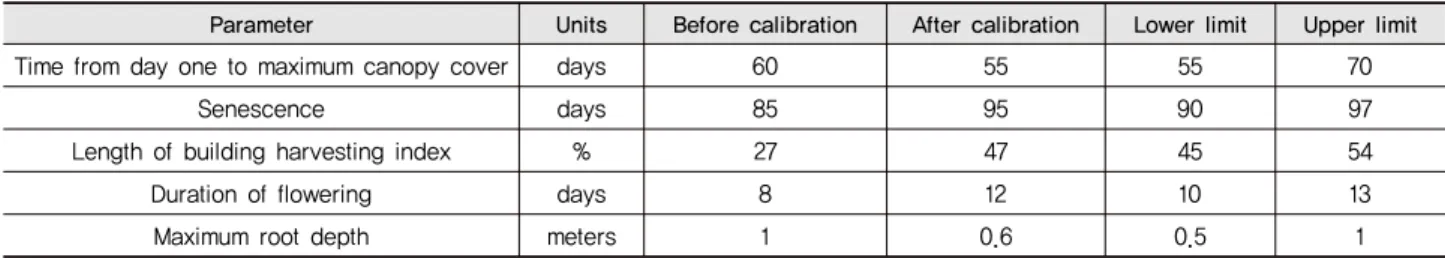
Table 3 Adjusted parameters used to calibrate the model
Parameter Units Before calibration After calibration Lower limit Upper limit
Time from day one to maximum canopy cover days 60 55 55 70
Senescence days 85 95 90 97
Length of building harvesting index % 27 47 45 54
Duration of flowering days 8 12 10 13
Maximum root depth meters 1 0.6 0.5 1
temperatures of the study area were 25.3 °C and 31.6 °C, respectively.
The annual rainfall showed a slightly increasing trend as can be seen from Fig. 2 (a) but the number of years when the average rainfall was less than the long-term average were more than the years when the annual rainfall exceeded the long-term average as illustrated in Fig. 3 (a). The minimum temperature showed a visible increasing trend with more number of years when the minimum temperature remained higher than the long-term averaged value which can be seen from Fig. 2 (b) and Fig. 3 (b). On the contrary, maximum temperature clearly showed a decreasing trend especially during the recent years since 2005 and onwards but before 2005 the maximum temperature was consistently higher than the average during most of the years as shown in Fig. 2 (c) and Fig. 3 (c).
These results indicated that area is facing the abrupt climate variations during different years. Although the rainfall showed an increasing; and maximum temperature showed a decreasing trend frequency of the hotter and drier years seemed to be gradually rising in the area. The temperature of the study area did not show much monthly and inter-seasonal fluctuation as indicated by a small difference between the average values of maximum and minimum temperature. Therefore, an increasing minimum temperature trend could significantly contribute towards warming of the study area.
2. Simulation of corn yield
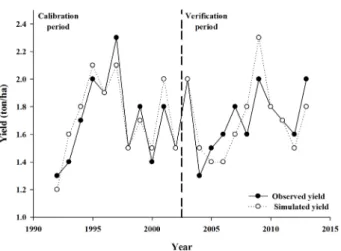
The Aquacrop model was calibrated using observed yield data from 1992 to 2002 and verified using the data from 2003 to 2013. The input parameters adjusted to calibrate the model are presented in Table 3. The model showed satisfactory results with R2 of 0.82 and NSE of 0.81 for the calibration period whereas R2 and NSE for the verification period were 0.6 and 0.4, respectively as shown in Fig. 4. This implied
Fig. 4 Comparison of the simulated and the observed corn yields
that the model is credible for its performance to predict the climate change impact on corn yield in the study area.
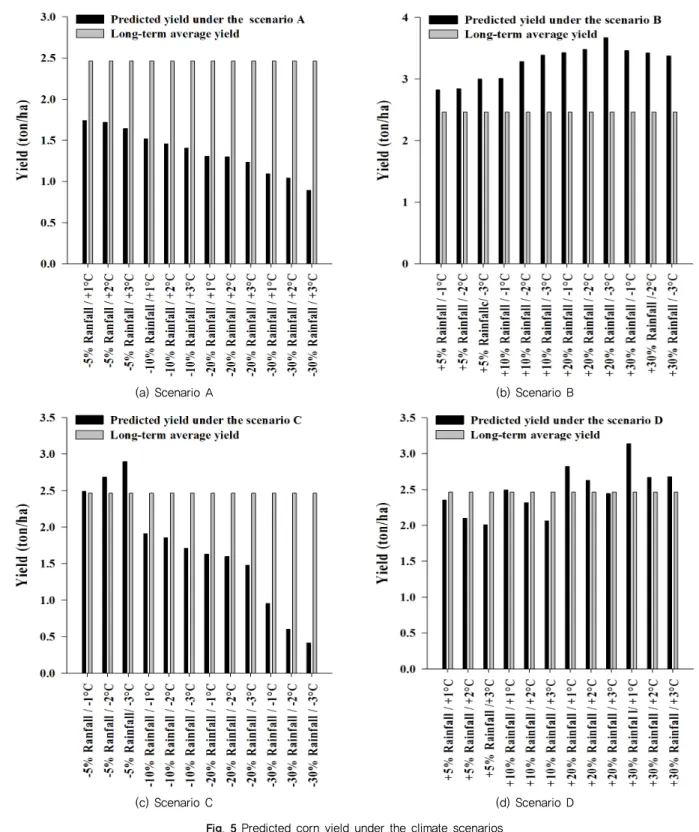
3. Corn yield prediction under the climate scenarios After the calibration of the Aquacrop model for the study area, it was employed to predict the corn yield under the four climate scenarios and the results are shown in Fig. 5. The average of 22-years observed corn yield in the study area was 2.4 ton/ha, and the predicted climatic impacts on the corn yield were compared based on this value. Generally, the corn yield showed declining trends in response to increase in temperature and decrease in rainfall. The rainfall variations more prominently influenced the corn yield than that of temperature. The yield was increased with increase in rainfall but after a certain threshold value it started to decline.
Similarly, the corn yield was decreased at much higher tem- peratures such as +3 °C even though sufficient amount of water was available as rainfall.
The area received an average rainfall of 570 mm during the corn-growing season from March to July against the average water requirement of 450 ~ 550 mm by the corn.
The average temperature during the growing season was 28.6 °C. The predicted corn yield followed a continuous decreasing trend under scenario A in the range of -29 % ~ -64 %. This indicated that a temperature rise of 1 °C ~ 2 °C combined with rainfall reduction of more than 20 % could result in the significant yield reduction and crop failure.
Under the scenario B, the crop showed a substantial tendency of yield increment in the range of +15 % ~ +49 %.
This lead to the conclusion that average corn yield of the study area could be increased if sufficient amount of water is available either in the form of rainfall or irrigation. However, the yield started to decline after 655 mm or 20 % increase in average rainfall indicating that excessive rainfall could also result in the yield reduction.
Increase in rainfall during crop growing season usually tends to increase the yield. However, in case of an extreme rainfall event, apart from direct flood damage, excess soil moisture could be a major reason behind the crop failure.
Excessive rainfalls and increased soil moisture could cause a number of problems such as water logging, increased risk of plant diseases and pest attacks as well as the hindrance in the field operations (Rosenzweig et al., 2002; Rosenzweig et al., 2001). This could explain the corn yield behaviour in scenario B. At 684 mm or 30 % increase in average rainfall, the corn yield started following a declining trend though it remained above the average corn yield. It was concluded that an average seasonal rainfall of more than 650 mm would be detrimental for corn production in the study area.
Under the climatic condition of scenario C, the corn yield was increased initially in response to the decrease in tem- perature at 5 % reduction in average rainfall. Further rainfall reduction caused the corn yield to decrease persistently even if the temperature kept on falling. The optimum temperature range for corn growth is 25 °C ~ 28 °C. Low temperature during germination and early growth stages could be harmful for the subsequent corn productivity and yield (Farooq et al., 2009). Moreover, decreasing temperatures could prolong the corn growing periods by slowing the photosynthesis process and subsequently affecting the yields negatively. On the other hand, reduced rainfall would lead to inadequate water available for corn survival that would eventually result in poor and stunted growth and drastic corn yield reduction. That is why, the combined effect of low temperature and rainfall resulted in a significant yield reduction under scenario C.
Comparing with the results of scenario A, the corn yield reduction was more prominent under the climatic conditions of scenario C. The possible explanation behind this anomalous behaviour could be the sensitivity of corn to lower temperature.
Farooq et al., 2009 argued that for corn, being a summer and chilling-sensitive crop, lower temperature during spring sowing could be harmful as the average time required for seed
(a) Scenario A (b) Scenario B
(c) Scenario C (d) Scenario D
Fig. 5 Predicted corn yield under the climate scenarios
germination and seedling emergence increases. Late seed germination accompanied by lesser amount of rainfall caused dramatic corn yield reduction under scenario C. Thus, it was inferred that temperature and rainfall reduction would signifi-
cantly influence the crop growth process. It was also concluded that decrease in average temperature would have more negative influence on corn production in the study area.
The predicted corn yield did not follow a particular trend
under the scenario D as it showed both increasing and decreasing trends under different climatic conditions. A key implication of the results could be the strong influence of rainfall over yield even if the temperature is increasing.
Constant yield increment was shown because of increased rainfall accompanying by temperature rise. This indicated that sufficient amount of rainfall could significantly minimize the adverse effects of temperature rise in the study area.
Ⅳ. CONCLUSIONS
Corn plantation is the major agricultural activity in Ghana, which is susceptible to endure the adverse climate change impacts. This study analyzed the probable impacts of climate change on the corn yield in the Dangme East district of Gahan by using weather data from 1992 to 2013. Aquarcrop model was used to simulate the corn yield under four different climate change scenarios designed by varying average tem- perature in the range of ±1 °C ~ ±3 °C and average annual rainfall to ±5 % ~ ±30 %, respectively.
Analysis of the 22-years daily weather data showed a vivid increasing trend of annual rainfall and a clear decreasing trend of maximum temperature in the study area, especially from 2005 and onwards. On the other hand, frequency of the years hotter and drier than the average seemed to be increasing.
This lead to the conclusion, that the area is facing abrupt climate variations during different years.
Aquacrop model was assessed using the limited observed data to verify model’s sufficiency, and showed credible results of R2 and Nash-Sutcliffe efficiency (NSE). Corn yield response towards climate variability was evaluated under climate change scenarios. Generally, the yield was negatively correlated to increase in temperature and decrease in rainfall. Compared to temperature, corn was more sensitive to rainfall variability.
The corn yield declined up to 84 % under relatively cooler and drier climate conditions and reduced up to 64 % under the extremely hotter and drier climate conditions. This indicated that the corn production in the study area would be more sensitive to decrease rather than increase in average temperature under the same downward trends of rainfall. A substantial yield increment of up to 49 % was predicted for the cooler and wet climate conditions. However, an excessive amount of rainfalls resulted in corn yield reduction. The
results showed that an average seasonal rainfall of more than 650 mm in the area would have negative impacts of corn production.
It is concluded that the rainfall variations would have strong influence on corn production in the study area. Under the rain-fed conditions, less rainfall coupled with low tem- perature affected the growth rate and yield of the crop, drastically. Although a temperature rise of 2 °C ~ 3 °C resulted in significant yield loss but these affects were marginal when sufficient amount of rainfall was available during the growing season.
REFERENCES
1. Abedinpour, M., A. Sarangi, T. B. S. Rajput, M. Singh, H.
Pathak, and T. Ahmad, 2012. Performance evaluation of Aquacrop model for maize crop in a semi-arid environment.
Agricultural Water Management 110: 55-66.
2. Armah, F. A., J. O. Odoi, G. T. Yengoh, S. Obiri, D. O. Yawson, and E. K. A. Afrifa, 2011. Food security and climate change in drought-sensitive savanna zones of Ghana. Mitigation and Adaptation Strategies for Global Change 16(3): 291-306.
3. Armah, F. A., D. O. Yawson, G. T. Yengoh, J. O. Odoi, and E.
K. A. Afrifa. 2010. Impact of floods on livelihoods and vulnerability of natural resource dependent communities in northern Ghana. Water 2(2): 120.
4. Browne Klutse, N. A., K. Owusu, D. C. Adukpo, F. Nkrumah, K. Quagraine, A. Owusu, and W. J. Gutowski, 2013. Farmer’s observation on climate change impacts on maize (zea mays) production in a selected agro-ecological zone in Ghana. Research Journal of Agriculture and Environmental Management 2(12):
394.
5. Doss, C. R. and M. L. Morris, 2000. How does gender affect the adoption of agricultural innovations? The case of impoved maize technology in Ghana. Agricultural Economics 25(1):
27-39.
6. Farooq, M., T. Aziz, A. Wahid, D. -J. Lee, and K. H. Siddique, 2009. Chilling tolerance in maize: Agronomic and physiological approaches. Crop and Pasture Science 60(6): 501-516.
7. Heng, L. K., T. Hsiao, S. Evett, T. Howell, and P. Steduto, 2009. Validating the FAO Aquacrop model for irrigated and water deficient field maize. Agronomy Journal 101(3): 488-498.
8. Hsiao, T. C., L. Heng, P. Steduto, B. Rojas-Lara, D. Raes, and E. Fereres, 2009. Aquacrop—the FAO crop model to simulate yield response to water: Iii. Parameterization and testing for maize. Agronomy Journal 101(3): 448-459.
9. IPCC 2007. Climate change 2007: Synthesis report. Contribution of working groups i, ii and iii to the fourth assessment report of the intergovernmental panel on climate change. Geneva, Switzerland.
10. Jones, P. G. and P. K. Thornton, 2003. The potential impacts of climate change on maize production in Africa and Latin America in 2055. Global Environmental Change 13(1): 51-59.
11. Manzanas, R., L. K. Amekudzi, K. Preko, S. Herrera, and J. M.
Gutiérrez, 2014. Precipitation variability and trends in Ghana:
An intercomparison of observational and reanalysis products.
Climatic Change 124(4): 805-819.
12. Masanganise, J., B. Chipindu, T. Mhizha, and E. Mashonjowa, 2012. Model prediction of maize yield responses to climate change in north-eastern Zimbabwe. African Crop Science Journal 20(2): 505-515.
13. Mkhabela, M. S. and P. R. Bullock, 2012. Performance of the FAO Aquacrop model for wheat grain yield and soil moisture simulation in western Canada. Agricultural Water Management 110: 16-24.
14. Owusu, K. and P. Waylen, 2009. Trends in spatio-temporal variability in annual rainfall in Ghana (1951-2000). Weather 64(5): 115-120.
15. Raes, D., P. Steduto, T. C. Hsiao, and E. Fereres, 2009. Aquacrop the FAO crop model to simulate yield response to water: Ii.
Main algorithms and software description. Agronomy Journal 101(3): 438-447.
16. Rosenzweig, C., A. Iglesias, X. Yang, P. R. Epstein, and E.
Chivian. 2001. Climate change and extreme weather events;
implications for food production, plant diseases, and pests.
Global change & human health 2(2): 90-104.
17. Rosenzweig, C., F. N. Tubiello, R. Goldberg, E. Mills, and J.
Bloomfield, 2002. Increased crop damage in the US from excess precipitation under climate change. Global Environmental Change 12(3): 197-202.
18. Roudier, P., B. Sultan, P. Quirion, and A. Berg, 2011. The impact of future climate change on west African crop yields:
What does the recent literature say? Global Environmental Change 21(3): 1073-1083.
19. Tachie-Obeng, E., P. B. I. Akponikpè, and S. Adiku, 2013.
Considering effective adaptation options to impacts of climate change for maize production in Ghana. Environmental Development 5: 131-145.
20. Tachie-Obeng, E., E. Gyasi, S. Adiku, M. Abekoe, and G.
Zierrogel, 2010. Farmers’ adaptation measures in scenarios of climate change for maize production in semi-arid zones of Ghana. 2nd International Conference: Climate Sustainability and Development in Semi-arid Regions, August 16-20,2010, Fortaleza-Ceara, Brazil.
21. Thornton, P., P. Jones, T. Owiyo, R. Kruska, M. Herrero, P.
Kristjanson, A. Notenbaert, N. Bekele, A. Omolo, With Contributions from Orindi V, A. Adwerah, B. Otiende, A.
Ochieng, S. Bhadwal, K. Anantram, S. Nair, and Kumar 2006.
Mapping climate vulnerability and poverty in Africa. Report to the department for international development, ilri, nairobi, kenya. Pp 171.
22. Waongo, M., P. Laux, and H. Kunstmann, 2015. Adaptation to climate change: The impacts of optimized planting dates on attainable maize yields under rainfed conditions in Burkina Faso. Agricultural and Forest Meteorology 205: 23-39.