1. Introduction
To investigate NPS pollution and their effects on water quality in Korea, a series of programs and projects have been carried out for many years (KME, 2006). They cover most types of agricultural activities. However,
NPS pollution involved in the reclaimed rice paddy and its influence were less known.
Many people have thought that water quality problem in the estuary dike dam is a result of the intensive and large-scale operation of rice paddy, mainly due to the NPS pollution caused by rainfall runoff.
계화 간척지구 강우 유출수의 비점오염원 유출특성에 관한 연구
여 미 미* / 이 제 도** / 우 강 화*** / 김 영 철****+
Characteristics of Nonpoint Source Pollution from a Reclaimed Rice Paddy Field
Weiwei Lu* / Qitao Yi** / Jianghua Yu*** / Youngchul Kim****+
요약 : 본 연구에서는 계화간척농지로부터 발생 되는 비점원 오염물질 유출현황을 조사하였다. 간척 논면적은 2,988ha로 크게 1,181ha와 1,817ha 크기의 두개의 소유역으로 구성되어 있다. 두개의 소유역에 대해 각각 3번 의 강우사상에 대해 조사가 이루어졌으며 강우량은 각각 66.0, 23.5, 23mm이었다. 간척농지에서 오염물질 유출 특성은 일반 내륙의 논에서와 다른 양상을 나타내었다. 일반적으로 우리나라 논에서는 발생되는 비점오염부하는 큰 반면에 연구대상 간척농지에서 발생되는 TSS, TN, TP의 비점오염 유출수준은 일반 임야지역 수준으로 나타 났다. 다른 유역과 다르게 질소의 경우 용존성 유기질소가 주종을 이루고 있으며 인의 경우에는 용존성 인이 주 종을 이루고 있었다.
핵심용어 : 농지, 비점오염, 질소, 인
Abstract : This research addressed nonpoint source (NPS) pollution characteristics in a reclaimed rice paddy field.
The paddy has an area of around 2,998 ha and is divided as two sub-watersheds, whose areas are 1,181 ha and 1,817 ha, respectively. Monitoring of hydrologic runoff and NPS pollution was undertaken during three-month period from June to August, 2008. Totally, three sampling trips were made when rainfall depth were 66.0 mm, 23.5 mm, and 23.0 mm, respectively. Generally pollution load increased with the heavier cultivation activity in Korea.
Exported pollutants from the rice paddy, including TSS, TN and TP, have same levels as forest discharge. Organic nitrogen is main pattern but it mainly exists in the forms of dissolved organic nitrogen (DON). For phosphorus, dissolved inorganic phosphorus (DIP) takes the main part although part of them is associated with fine particles.
This is different compared with other watersheds, where particles-associated phosphorus is the main form.
Keywords : Nitrogen, Nonpoint source pollution, Phosphorus, Rice paddy, Runoff
+ Corresponding author : [email protected]
* 한서대학교 환경공학과 석사과정
** 한서대학교 환경공학과 박사과정
*** 한서대학교 환경공학과 박사과정
**** 한서대학교 환경공학과 교수
However, quite a few researches indicate that the paddy field have an capability to function in removing nitrogen and phosphorus nutrients. Generally, paddy field had relatively high concentrations of nitrogen and phosphorus in the irrigation water as well as adequate retention time, both of which facilitate purification processes (Zulu et al., 1996; Feng et. al, 2004). In addition, another research demonstrate that purification function was related to the hydraulic retention time.
Critical retention time that determines pollutant sink or pollutant source was approximately 4 days for total phosphorus (TP) and chemical oxygen demand (COD) loads and 7 days for total nitrogen (TN) load (Takeda and Fukushima, 2006). Kim et al.
(2006) investigated nutrient runoff from a Korean rice paddy watershed during multiple storm events in the growing season and found that nitrogen runoff from paddy field watersheds depends on fertilization rate, while phosphorus runoff is controlled by pond conditions.
The most important feature of rice cultivation is water logging. This leads to anaerobic conditions in paddy soil. Nitrogen tends to be conserved more in paddy soils than in other soils. Because in anaerobic conditions, nitrification is hard to occurs.
Meanwhile, NH4-N is retained as a cation on negatively charged soil mineral and organic particles, the leaching of NH4-N from paddy fields is not significant. In the process of anaerobiosis in paddy soils, iron phosphate tends to be reduced, with a release of phosphorus in available forms (Kyuma, 1995).
The reduction of paddy soils under submerged conditions is accompanied by an
elevation of soil pH. The rise in pH enhances the solubility of iron phosphate and aluminum phosphate, by a factor of 10 times per unit rise in pH. This is a typical mechanism to raise the availability of phosphorus in paddy soils (Kyuma, 1995).
The overall objective of the study is to investigate a status of NPS pollution discharge during storm flow condition from a large cultivated rice paddy field which was reclaimed from coastal sea. And then its characteristics will be compared with other land use types.
2. Materials and methods
2.1 Site description in the reclaimed rice paddy field
The watershed examined in this study is Gaehwa area which was reclaimed from shallow coastal sea. It is located in North Jeolla Province of the southwestern part of Korea. The construction of this reclamation project started in 1964 as a part of first five-year developing strategy and completed in 1978. It has a goal of producing 100,000 tons of grain per year. The total area involved in project covered around 3,976 ha which include rice paddy of 2,740 ha and other area (reservoir and channel) of 1,246 ha.
The watershed totally consists of rice
paddy and includes small residential area
(less than 1%). Originally the lake was not
constructed to supply irrigational water but
temporally store the return flow from paddy
before discharging it to the coastal sea, and
control the flooding of the paddy area during
rainy season.
2.2 Monitoring methods
As shown in Fig. 1, the paddy field can be largely divided into two sub-watersheds.
Return flow and rainfall runoff from sub-watershed #1 enters into the southern part of the lake and those from sub- watershed #2 are discharged into the northern part.
Fig. 1. Sub-watersheds and selected sites for NPS monitoring
At the each sub-watershed, we selected five candidate sites for hydrologic station and NPS monitoring. Based on easiness of flow monitoring, sampling, and accessibility, two sites were finally determined and they are located in two main drainage channels of the reclaimed rice paddy (Fig. 1). The watershed areas of Site #1 and Site #2 are 192 ha and 197 ha, respectively. The watershed is
almost flat (mean watershed slope is less than 0.5 %).
The Ultrasonic Doppler instruments (Model 6526, Product from Australia) were installed at the monitoring site to obtain flow velocity, flow depth and water temperature. Ten minutes interval step was set to record these hydrologic data. According to the relationship between cross-sectional area and depth, the instant flow rate was calculated. The flow meter was tested with manually measured and metered data which were collected during storm flow conditions to look at the reliability of instrument.
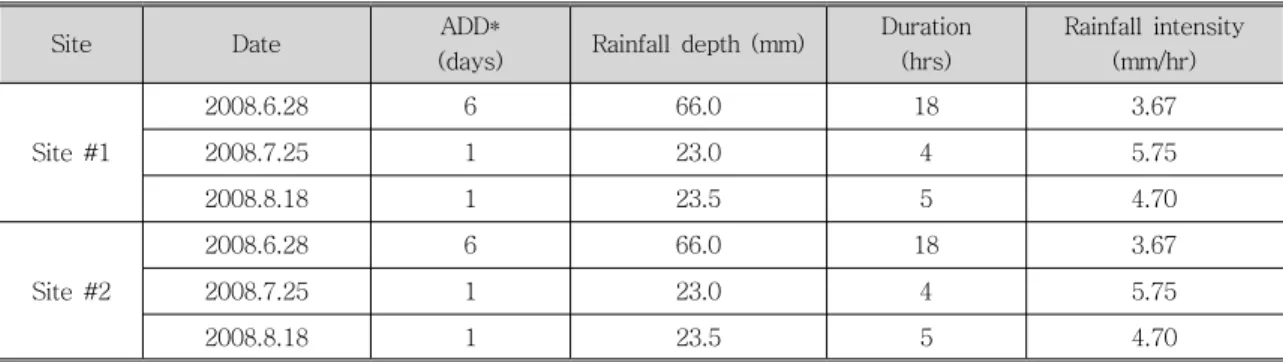
The flow meters were operated starting from June 25 to September 30 in 2008, and we obtained three months flow data including the dry days and all the rainfall events during the period of monitoring. Hydrologic runoff and NPS monitoring were undertaken during three-month period between June and August, 2008. Totally, three sampling trips for NPS were made (Table 1). On the day of sampling, base-flow samples were taken before the rainfall. And continuously water samples were taken based on flow rate.
Finally 15 samples reflecting increase and decrease of the hydrograph were selected for laboratory analysis.
Site Date ADD*
(days) Rainfall depth (mm) Duration (hrs)
Rainfall intensity (mm/hr)
Site #1
2008.6.28 6 66.0 18 3.67
2008.7.25 1 23.0 4 5.75
2008.8.18 1 23.5 5 4.70
Site #2
2008.6.28 6 66.0 18 3.67
2008.7.25 1 23.0 4 5.75
2008.8.18 1 23.5 5 4.70
Table 1. Information of sampling rainfall events
* ADD : antecedent dry days
The measurement of all water quality parameters was performed in accordance with standard methods (APHA et al., 1995). Total 90 samples (3 rainfall events and 15 samples per events) from two watersheds were collected and analyzed. The specific parameters include pH, EC, Turbidity, TSS, CODcr, BOD and nutrients constituents. In order to determine the particles-related components of the nutrients, dissolved-TN and dissolved TP were also measured.
2.3 Comparison with other agricultural watersheds
The data for comparison comes from NPS pollution monitoring projects carried out mostly by the Institute of Environment Research, Hanseo University, Korea. It has been working on many different NPS programs in last decades which covered various types of land use and rainfall events.
These data sources are available in this research.
3. Results and discussion
3.1 Hydrology characteristicsThe flow rates measured continuously during the investigation period are presented (Fig. 2).
The rainfall events during this period were indicated in the Fig. 2. It can be observed that there is a relatively higher base flow even in the dry period. Sometimes, even the return flow of irrigational water causes peak flows during dry days. High base flow is due to return flow of irrigational water supplied by the reservoir located in the upper part of
0 2000 4000 6000 8000 10000 12000 14000 16000
26/06 27/06 28/06 29/06 30/06 01/07 02/07 03/07 04/07 05/07 06/07 07/07 08/07 09/07 10/07 11/07 Flowrate (m3/hr)
0 2000 4000 6000 8000 10000 12000 14000 16000
11/07 12/07 13/07 14/07 15/07 16/07 17/07 18/07 19/07 20/07 21/07 22/07 23/07 24/07 25/07 26/07 Flowrate (m3/hr)
66mm 6mm
5.5mm 10mm 13mm 5mm3mm 31mm 23mm
0 2000 4000 6000 8000 10000 12000 14000 16000
11/08 12/0813/08 14/08 15/08 16/08 17/08 18/0819/08 20/0821/08 22/08 23/0824/08 25/08 26/08 Flowrate (m3/hr)
0 2000 4000 6000 8000 10000 12000 14000 16000
26/0727/07 28/07 29/0730/0731/0701/08 02/0803/08 04/0805/08 06/08 07/0808/08 09/0810/08 11/08 Flowrate (m3/hr)
4mm
4mm6mm23mm 116mm 23.5mm 26.5mm
0 2000 4000 6000 8000 10000 12000 14000 16000
26/08 27/08 28/08 29/08 30/08 31/08 01/09 02/09 03/09 04/09 05/09 06/09 07/09 08/09 09/09 10/09 11/09 12/09 13/09 14/09 15/09 16/09 Flowrate (m3/hr)
9.5mm
0 2000 4000 6000 8000 10000 12000 14000 16000
26/06 27/06 28/06 29/06 30/06 01/07 02/07 03/07 04/07 05/07 06/07 07/07 08/07 09/07 10/07 11/07 Flowrate (m3/hr)
0 2000 4000 6000 8000 10000 12000 14000 16000
11/07 12/07 13/07 14/07 15/07 16/07 17/07 18/07 19/07 20/07 21/07 22/07 23/07 24/07 25/07 26/07 Flowrate (m3/hr)
66mm 6mm
5.5mm 10mm 13mm 5mm3mm 31mm 23mm
0 2000 4000 6000 8000 10000 12000 14000 16000
11/08 12/0813/08 14/08 15/08 16/08 17/08 18/0819/08 20/0821/08 22/08 23/0824/08 25/08 26/08 Flowrate (m3/hr)
0 2000 4000 6000 8000 10000 12000 14000 16000
26/0727/07 28/07 29/0730/0731/0701/08 02/0803/08 04/0805/08 06/08 07/0808/08 09/0810/08 11/08 Flowrate (m3/hr)
4mm
4mm6mm23mm 116mm 23.5mm 26.5mm
0 2000 4000 6000 8000 10000 12000 14000 16000
26/08 27/08 28/08 29/08 30/08 31/08 01/09 02/09 03/09 04/09 05/09 06/09 07/09 08/09 09/09 10/09 11/09 12/09 13/09 14/09 15/09 16/09 Flowrate (m3/hr)
9.5mm
Fig. 2. The observed flow rate during the investigation period
Gaehwa area, and partly caused by ground water supply from rice paddy.
Actually, the average base flow from Site 1 during dry days is around 34,200 m 3 /day.
According to monitored flow rate data, small
rainfall events(less than 14mm)do not give a
storm runoff because of high infiltration rate
through sandy soil layer of the reclaimed rice
paddy. At the same time, the discharged
runoff generally increases with the rainfall
depth during the investigation period (Fig. 3),
which is in accordance with other research
y = 1866.7x - 21650 R2 = 0.9233
0 50000 100000 150000 200000 250000
0 10 20 30 40 50 60 70 80 90 100 110 120
Rainfall depth (mm) Runoff Volume (m3)
Point for storm flow
Fig. 3. Relationship between rainfall depth and storm flow runoff
,
F lo w ra te (m
3/h r)
100008000
6000
4000
2000 0
2008.6.28 2008.7.25 2008.8.18
,
F lo w ra te (m
3/h r)
100008000
6000
4000
2000 0
2008.6.28 2008.7.25 2008.8.18
Fig. 4. Hydrograph in the reclaimed rice paddy (Site 1)
SS concentration (mg/L)
100
80
60
40
20 0
2008.6.28 2008.7.25 2008.8.18
SS concentration (mg/L)
100
80
60
40
20 0
2008.6.28 2008.7.25 2008.8.18
TN concentration (mg/L)
10
8
6
4
2 0
2008.6.28 2008.7.25 2008.8.18
TN concentration (mg/L)
10
8
6
4
2 0
2008.6.28 2008.7.25 2008.8.18
TP concentration (mg/L)
1.0
0.8
0.6
0.4
0.2 0
2008.6.28 2008.7.25 2008.8.18
TP concentration (mg/L)
1.0
0.8
0.6
0.4
0.2 0
2008.6.28 2008.7.25 2008.8.18
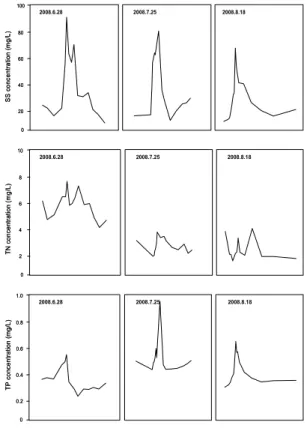
Fig. 5. Pollutograph in the reclaimed rice paddy (Site 1)
(Takeda and Fukushima, 2006). The first sampling case has higher peak flow than other two cases due to higher rainfall depth of 66 mm, compared with 22.0 mm, and 23.5 mm in other two times (Fig. 4).
3.2 Pollutograph and pollutants patterns
In individual watershed, the storm flow hydrograph will be determined by many factors, such watershed types and soil characteristics as well. Accordingly, pollutants carried by storm flow will perform specific characteristics in different watersheds (Yi et al, 2008).
SS, COD, and TP show concentration peaks along with the process of storm flow (Fig. 5).
However, the concentration change of TN is not obvious like others. In the first time, TN concentration is greatly higher than other two times, probably due to antecedent activity of fertilization and then washout by the storm flow. This result is same as the result presented by Kim et al. (2006).
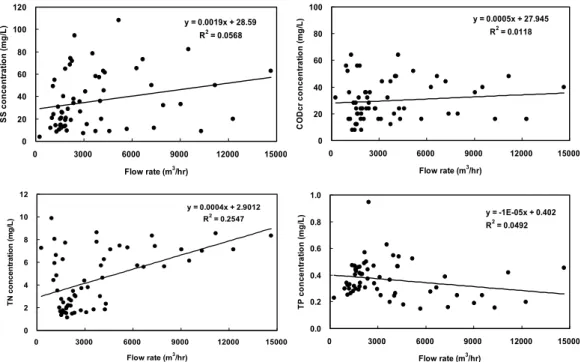
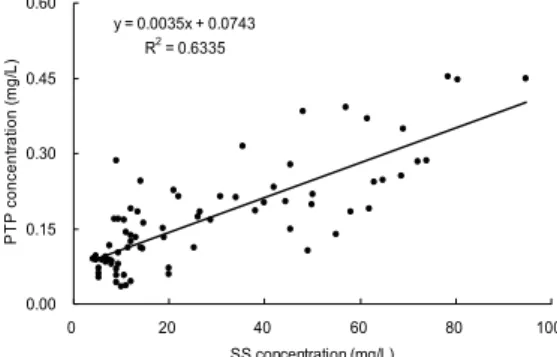
Fig. 6 and Fig. 7 give the relationships between flow rate, SS and other pollutants.
Obviously there are no linear relationships among them except that TP shows significant relationship with TSS. Generally, TP used to be associated with SS resulted from soil erosion under storm flow conditions.
The following factors would affect soil
erosion; (1) slope, (2) rainfall factors, and (3)
vegetation surface. The soil erosion from the
paddy is not heavy due to its smaller slope,
denser vegetation cover and pond system.
y = 0.0019x + 28.59 R
2= 0.0568
0 20 40 60 80 100 120
0 3000 6000 9000 12000 15000
Flow rate (m
3/hr)
S S c o n c e n tr at ion ( m g/ L)
y = 0.0005x + 27.945 R
2= 0.0118
0 20 40 60 80 100
0 3000 6000 9000 12000 15000
Flow rate (m
3/hr)
C O D c r conc e n tr a ti on (m g/ L)
y = -1E-05x + 0.402 R
2= 0.0492
0.0 0.2 0.4 0.6 0.8 1.0
0 3000 6000 9000 12000 15000
Flow rate (m
3/hr)
T P c onc e n tr a ti o n ( m g/ L )
y = 0.0004x + 2.9012 R
2= 0.2547
0 2 4 6 8 10 12
0 3000 6000 9000 12000 15000
Flow rate (m
3/hr)
TN co nc e n tr a ti o n ( m g /L)
Fig. 6. Relationships between pollution constituents and flow rate
y = 0.0229x + 3.9486 R
2= 0.1539
0 2 4 6 8 10 12
0 20 40 60 80 100 120
SS concentration (mg/L)
BO D c oncen tr at ion (m g/ L)
y = 0.1836x + 23.304 R
2= 0.0972
0 15 30 45 60 75 90
0 20 40 60 80 100 120
SS concentration (mg/L)
CO Dcr co nc en tr at ion ( m g/ L)
y = 0.0034x + 4.3096 R
2= 0.0011
0 2 4 6 8 10 12
0 20 40 60 80 100 120
SS concentration (mg/L)
TN co nce n tr at io n (m g /L )
y = 0.0033x + 0.2464 R
2= 0.3807
0.0 0.2 0.4 0.6 0.8 1.0
0 20 40 60 80 100 120
SS concentration (mg/L)
T P con c en tr at ion ( m g/ L)
Fig. 7. The relationship between SS and the other pollutants
These conditions are not favorable for soil erosion and transport if compared with other
watersheds. For example, in croplands, it
generally present linear regression relationships
Site
Concentration of base flow (mg/L)
Average concentration (mg/L)
Peak concentration (mg/L)
Total load (kg) S
S C O D
T N
NH 3-N
S S
C O D
T N
NH 3-N
S S
C O D
T N
NH 3-N
S S
C O D
T N
NH 3-N
S i t e 1
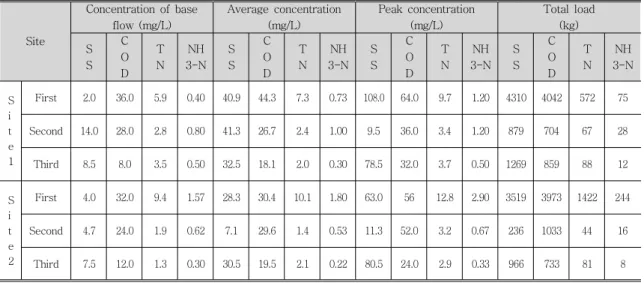
First 2.0 36.0 5.9 0.40 40.9 44.3 7.3 0.73 108.0 64.0 9.7 1.20 4310 4042 572 75
Second 14.0 28.0 2.8 0.80 41.3 26.7 2.4 1.00 9.5 36.0 3.4 1.20 879 704 67 28
Third 8.5 8.0 3.5 0.50 32.5 18.1 2.0 0.30 78.5 32.0 3.7 0.50 1269 859 88 12
S i t e 2
First 4.0 32.0 9.4 1.57 28.3 30.4 10.1 1.80 63.0 56 12.8 2.90 3519 3973 1422 244
Second 4.7 24.0 1.9 0.62 7.1 29.6 1.4 0.53 11.3 52.0 3.2 0.67 236 1033 44 16
Third 7.5 12.0 1.3 0.30 30.5 19.5 2.1 0.22 80.5 24.0 2.9 0.33 966 733 81 8
Table 2. Characteristics of NPS pollutants in the storm flow
Site
Concentration of base flow (mg/L)
Average concentration (mg/L)
Peak concentration (mg/L)
Total load (kg) NO3-
N T P
PO4- P
NO3- N
T P
PO4- P
NO3- N
T P
PO4- P
NO3- N
T P
PO4- P
S
i t e 1
First 0.47 0.33 0.03 0.59 0.32 0.04 0.73 0.52 0.07 62.9 27.8 3.5
Second 0.36 0.47 0.16 0.30 0.50 0.20 0.50 0.90 0.40 8.9 13.5 5.1
Third 0.06 0.26 0.07 0.10 0.40 0.09 0.20 0.60 0.11 5.5 16.2 4.5
S i t e 2
First 0.58 0.23 0.02 0.55 0.27 0.02 0.73 0.45 0.048 78.3 37.9 2.8
Second 0.34 0.24 0.09 0.30 0.23 0.09 0.37 0.27 0.12 9.5 7.4 3.0
Third 0.09 0.22 0.08 0.12 0.37 0.09 0.39 0.60 0.12 3.04 12.2 3.5
Table 3. Characteristics of NPS pollutants in the storm flow (continued)
between flow rate and particles-related pollutants (SS, COD and TP).
3.3 Comparison with other agricultural watersheds
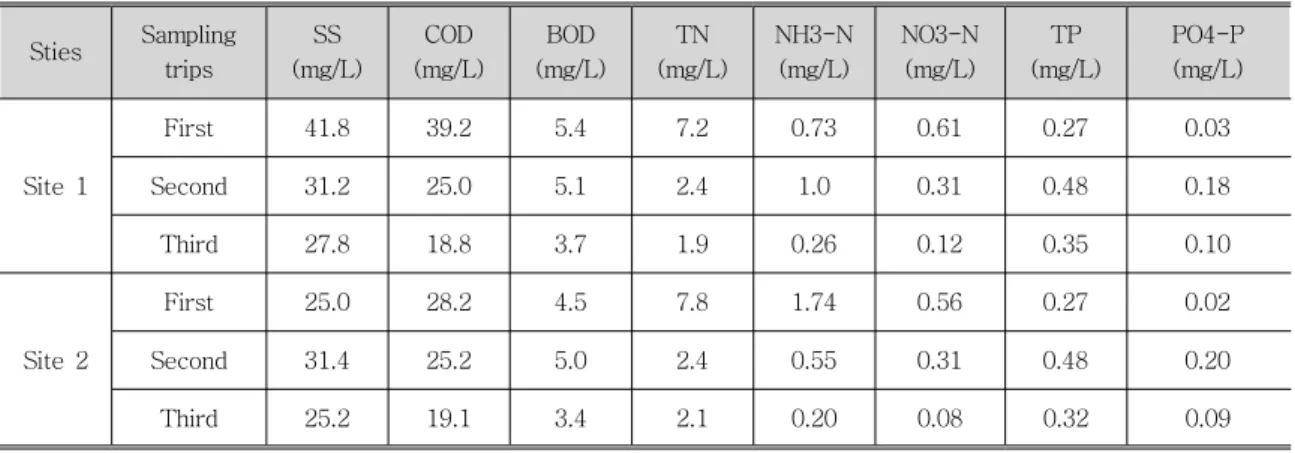
The characteristics of NPS pollutants in the storm flow from the reclaimed rice paddy are presented in Table 2 and Table 3. Event mean concentration (EMC) values are calculated in individual rainfall event at each site (Table 4). EMC can be calculated by the following equation.
EMC = ∑QiCi/∑Qi
Where Qi is the flow rate at time t (m 3 /hr), Ci is the concentration of the pollutant (mg/L), and EMC is flow weighted mean concentration in a storm event (mg/L).
The distribution of the EMC values is
shown in Fig. 8. TSS concentration has a
range of 25.0 to 41.8 mg/L while CODcr
ranges from 18.8 to 39.2 mg/L. TN
concentration is relatively lower in the
second and third events compared with the
Sties Sampling trips
SS (mg/L)
COD (mg/L)
BOD (mg/L)
TN (mg/L)
NH3-N (mg/L)
NO3-N (mg/L)
TP (mg/L)
PO4-P (mg/L)
Site 1
First 41.8 39.2 5.4 7.2 0.73 0.61 0.27 0.03
Second 31.2 25.0 5.1 2.4 1.0 0.31 0.48 0.18
Third 27.8 18.8 3.7 1.9 0.26 0.12 0.35 0.10
Site 2
First 25.0 28.2 4.5 7.8 1.74 0.56 0.27 0.02
Second 31.4 25.2 5.0 2.4 0.55 0.31 0.48 0.20
Third 25.2 19.1 3.4 2.1 0.20 0.08 0.32 0.09
Table 4. EMC values in the two sites
first one, which was due to the antecedent fertilization activity, and subsequent washout within this storm evens as discussed previously.
Fig. 8 shows comparison result with other agricultural watersheds in terms of EMC values (Fig. 8). The paddy has low TSS concentration, which is located on the same level as that in a forest area. It would be explained mainly from three facts. Firstly, the
paddy can act as a pond system for sediments settling. Secondly, rice paddies are covered well with vegetation, which can prevent the loss of soils. Thirdly, the slope of paddy is rather flat, which is not favorable for transport of soil particles. TP has the same trends since it is generally associated with suspended solids and transported with particles as discussed before.
Fig. 8. EMC comparison between different land uses
Fig. 9. Unit load comparison between land use types
(Forest I: 285 ha, cultivation area occupies 2.5%; forest II: 338.4 ha, cultivation area occupies
0.5%; Hybrid area: 496 ha, cultivation area occupies 14.8%; Agricultural area: 2737 ha, cultivation
area occupies 35.9%; data from Kim, 2006)
Actually, there are many researches presenting that rice paddy has a pollution purification function. Takeda et al. (2006) made an investigation on the water quality and hydrology for 8 years in a paddy watershed using a circular irrigation system.
The results showed that rice paddy performedpurification for TP and COD. And Kim et al. (2006) also found that ponding on rice paddy played very important role in reducing soil-erosion-related phosphorus export.
The unit load comparison of different pollution constituents during individual rain events are shown in Fig. 9, which also support the above discussion. Note that the exported loads of SS, TN and TP are on the same level as that in forest watershed.
3.4 Characteristics of nutrients export