Effects of Strain Rate and Temperature on Tangent Modulus Method
M. Makasi and Y. Fujii, (Hokkaido University, Graduate School of Engineering, Japan)
1. INTRODUCTION
The measurement of in-situ rock stress state is a critical aspect in the design of underground excavations. In mining, initial stress condition data is essential for design of openings and the mining method and also for monitoring stability during the life of the mine. This is so because post-excavation stress state is directly related to the redistribution of initial stresses. Measurement of initial stress is done by the following methods:
(a) In-situ stress measurement
This is done through borehole techniques such as hydraulic fracturing, stress relief, borehole breakouts and interpretation of drilling induced fractures as core dicing.
(b) Methods using oriented cores in the laboratory
Examples include Deformation Rate Analysis, Differential Strain Curve Analysis, Acoustic Emission and Tangent Modulus Method.
(c) Back analysis
Stress and mechanical properties are determined by comparing monitoring with calculated results.
(d) Using geophysical data analysis such as focal plane mechanism and others.
Although in situ measurements would give more accurate measurements, they are not so often used because of the high costs associated with them. Laboratory tests based on oriented core specimens are cheap and have the advantages of being usable for rough estimations of stress state at great depths and are expected to become more popular1.
In the Tangent Modulus Method (TMM) of rock stress measurement, two cycles of uniaxial
compressive loading are carried out for rock specimen (Fig. 1a.). The stress-tangent modulus curve, based on the local slope of stress-axial strain relationship, shows a bending point. The stress value at the bending point is regarded as the normal stress component of in-situ rock stress in the direction of rock specimen. The stress value at this point is regarded as the initial stress2.
Oriented core methods use a rock's ability to accumulate, retain and reproduce information on the stresses experienced in the past. Lavrov (2003) stated that this ability is essentially due to irreversible damage accumulated in rock when it is subjected to loads3.
Fujii (2008) explained the physical phenomenon that is utilized to detect stress memory in TMM to be based on a model, which consists of two springs and a slider. In the model, one spring represents the elasticity of rock, while another spring, which is connected in parallel to the slider, represents inelasticity.
The inelasticity is due to the irreversible closure of voids. The model clearly simulates decrease of the tangent modulus at the preloaded stress4.
This paper seeks to address the question of how the loading rate and temperature affect the recall of the previous maximum stress.
한국암반공학회 국제학술회의
2008 / 2008.10.21 - 10.23
2. PRINCIPLE OF TMM
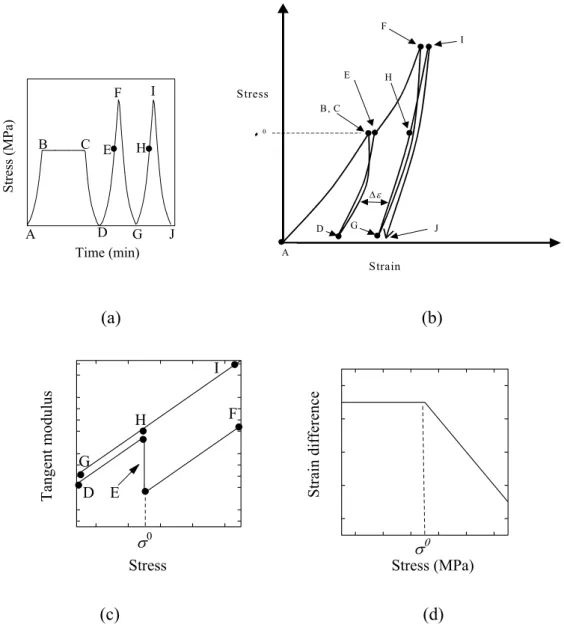
Assume that a very non-linear rock specimen is subjected to a preloading and cyclic loading (Fig. 1a.).
The stress-strain curve would be like Fig. 1b. In the first cycle (D-F), tangent modulus is large when the stress is below preloaded value (D-E). However, it becomes small when the stress is beyond the
preloaded value (E-F). Tangent modulus is large during the entire second cycle. Therefore, the preloaded original stress is estimated as the stress value at the bending point in the first cycle (Fig. 1c). The non- linearity is mainly due to irreversible closure of voids.
Strain difference used in DRA is also shown in Fig. 1b and 1d. It is clear that the strain difference- stress plot is expected to show a bending point at preloaded stress. The stress value at the bending point can be simply observed in stress-strain curve if the non-linearity is so large. However, TMM or DRA should be used since actual non-linearity of rocks is not so large.
Time (min)
Stress (MPa)
H I
J A
B C
D E
F
G
A
0
B, C
D
Ι
E H
F
G J Δε Stress
Strain
(a) (b)
Stress
Tangent modulus
σ0 G
H
I
D E
F
Stress (MPa)
Strain difference
σ0
(c) (d)
Fig. 1. Illustrat ㅠ ion of TMM method (a) Stress-time graph of TMM. A-D is preloading, which is followed by two cycles of loading namely D-F and G-I respectively. The unloading cycles are FG and IJ for the first and second cycles
respectively. (b) Stress- strain curve during preloading and cyclic loading. (c) Tangent modulus-stress curve in TMM (d) Strain difference-stress curve for DRA.
Preload stress, σ 0, is observed at the bending point.
3. THE EFFECTS OF STRAIN RATE
3.1 Specimen preparationKimachi sandstone cylindrical cores of 60 mm length and diameter 30 mm were cored off the main block. The specimen ends were smoothened. They were then dried in an oven at 80°C for 24 hours.
Before use, the specimens were kept under room temperature condition for 3 years.
(a) (b)
Fig. 2. Preparation of Kimachi sandstone specimens (a) Specimen drilling (b) Cutting and smoothening to specification.
3.2 Experimental procedure
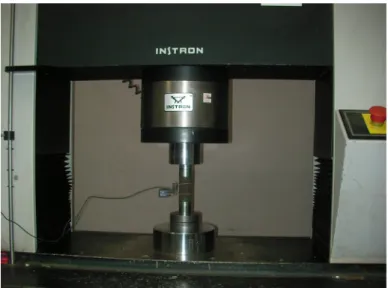
Fig. 3. Experimental setup during cyclic loading. An axial extensometer is attached to the rock specimen
.
Rock specimens were attached to end pieces at both sides and then placed on a spherical seat. Loading was done using an Instron 5586 loading frame that has a maximum load of 300 kN (Fig. 3.). The Kimachi sandstone used had a predetermined uniaxial compressive strength (UCS) of 40.8 MPa. The preload stress was 30% UCS, equivalent to a load of 8.5 kN, and the sample was left for one hour under the load. After one hour the specimen was unloaded and the end pieces and spherical seat were detached so as to delete
stress memory. An axial extensometer was attached to the specimen using rubber bands. End pieces were attached again. The specimen was cyclic loaded at 50% UCS for 2 cycles. The data recording was per every 0.2µm of platen displacement. Rock stress estimation is regarded as precise when the stress value at the bending point lies within ±20% of the preload stress value.
3.3 Results
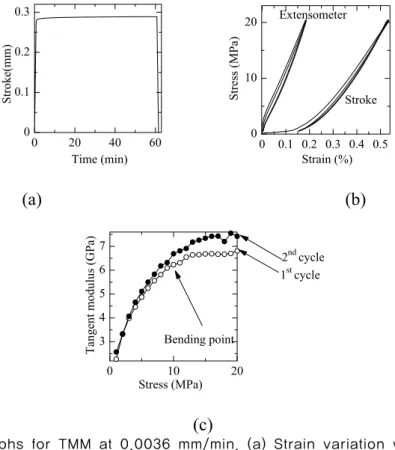
Examples of strain variation versus time at preloading, stress-strain curve as well as stress-tangent modulus curves are shown in Fig. 4. For the strain rates in the range from 0.0036 mm/min to 0.36 mm/min, the stress value at bending point were within the ± 20% allowable error margins for TMM (Fig.
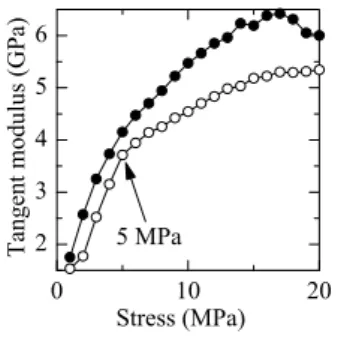
5.) There was not a significant difference between stroke-based and extensometer based bending point stress values. The cyclic loading of specimens at 0.00036 mm/min lasted on average 52 hours (Fig. 6.) and the stress at the bending point is too small (Fig. 7.). At 36 mm/min, all specimens failed as soon as cyclic loading began because of the limit of control of the loading frame. There seems to be a positive correlation between bending point stress value and strain rate. However, this correlation is within error and has to be investigated further.
0 20 40 60
0 0.1 0.2 0.3
Time (min)
Stroke(mm)
0 0.1 0.2 0.3 0.4 0.5 0
10 20
Strain (%)
Stress (MPa) Stroke
Extensometer
(a) (b)
0 10 20
3 4 5 6 7
Stress (MPa)
Tangent modulus (GPa)
Bending point
1st cycle 2nd cycle
(c)
Fig. 4. Graphs for TMM at 0.0036 mm/min. (a) Strain variation with time at preloading. (b) Stress-strain curve in cyclic loading .The two curves represent strain values based on stroke and extensometer respectively. (c) A typical curve for stress -tangent modulus based on stroke showing a clear bending point at the
preload stress value.
10-4 10-3 10-2 10-1 100 7
8 9 10 11 12 13
Displacing rate (mm/min)
Stress at bending point (MPa)
extensometer stroke
10-3 10-2 10-1 100 101 100
101 102 103
Displacing rate (mm/min)
Cyclic loading duration (min)
Fig. 5. Variation of cyclic loading times with Fig. 6. Variation of TMM stress with strain rate.
strain rate.
0 10 20
2 3 4 5 6
Stress (MPa)
Tangent modulus (GPa)
5 MPa
Fig. 7. Stress-tangent modulus curve stroke based on stroke for strain rate of 0.00036mm/min.
4. THE EFFECTS OF TEMPERATURE
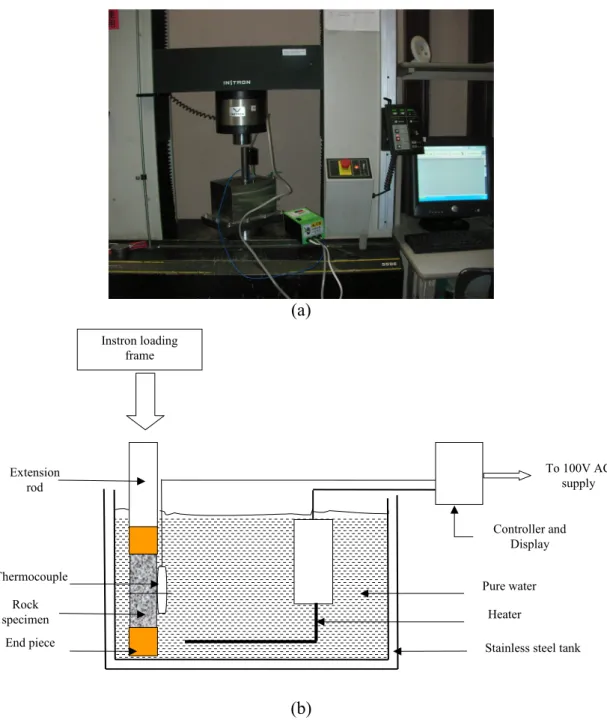
4.1 Experimental procedureRock specimens, which were prepared the same way and vacuum saturated by pure water, were attached to end pieces and placed in a stainless steel tank. A heater was placed in the tank. The rock specimen was fully immersed in pure water. A 150 mm long extension rod was used. A thermocouple was attached to the rock specimen (Fig. 8.). The water was heated to a preset temperature for a period of 4 hours. The specimen was then preloaded under a constant load for one hour. Cooling in pure water for one hour followed this. Cyclic loading to 14.3 kN for 2 cycles at a strain rate of 0.36 mm/min was then done on the cooled specimen, with an axial extensometer attached to measure axial strain. The duration of cyclic loading was ranging between 2 - 3 minutes for all temperatures.
(a)
Pure water Controller and
Display
End piece Rock specimen Thermocouple
Extension rod
To 100V AC supply
Heater
Stainless steel tank Instron loading
frame
(b)
Fig. 8. Effects of temperature on TMM stress value experiment (a) Rock specimen being preloaded at set temperature as indicated on the display
unit. (b) Schematic diagram of experimental setup at preloading.
4.2 Results
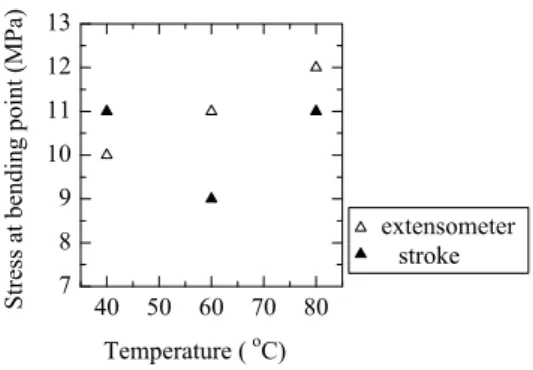
The stress values at bending points were within ±20% preloading stress except for one datum in the stress-temperature results curve (Fig. 9.). It can be said that the temperature that the specimens were preloaded under did not affect the stress value at bending point. Results based on platen displacement and extensometer showed the same trend.
40 50 60 70 80 7
8 9 10 11 12 13
Temperature ( oC)
Stress at bending point (MPa)
extensometer stroke
Fig. 9. TMM stress variation with temperature
5. CONCLUDING REMARKS
Kimachi sandstone core specimens were preloaded and cyclic loaded under different conditions to investigate the effects of strain rate and temperature on the value of stress at the bending point in TMM.
The results are as follows:
1. The stress values by TMM lie within 82% and 98% of the actual preloaded stress value for strain rates in the range from 0.0036 mm/min to 3.6 mm/min.
2. The upper threshold strain rate was not clarified because of the limit of loading frame control.
3. The surrounding water temperature, between 40°C and 80°C at preloading has no effect on the stress value in TMM.
REFERENCE
1. Ljunggren C, Chang Y, Janson T, Christiansson R, 2003, An overview of rock stress
measurement methods, International Journal of Rock Mechanics and Mining Sciences Vol.40, 975-989.
2. Fujii Y, Ohtaka N, Nakagawa Y, Kodama J, 2006( in Japanese), A Study of rock stress based on variation of Tangent Modulus, Journal of the Mining and Materials Processing Institute of Japan Vol.122, 483-488.
3. Lavrov, A, 2003, The Kaiser effect in rocks: principles and stress estimation techniques, International Journal of Rock Mechanics and Mining Sciences Vol. 40, 151-171.
4. Fujii Y, Ohtaka N, Nakagawa Y, Kodama J, 2008(in Japanese), Tangent Modulus Method, Applicability to three types of rock and influence of confining pressure, Journal of the Mining and Materials Processing Institute of Japan Vol. 124, 120-128.