Half-hourly Rainfall Monitoring over the Indochina Area from MTSAT Infrared Measurements: Development of Rain Estimation Algorithm
using an Artificial Neural Network
Nguyen Vinh Thu1 and Byung-Ju Sohn2,*
1National Hydro-Meteorological Service, No 4 Dang Thai Than, Hoan Kiem, Hanoi, Vietnam
2School of Earth and Environmental Sciences, Seoul National University, Seoul 151-747, Korea
Abstract: Real-time rainfall monitoring is of great practical importance over the highly populated Indochina area, which is prone to natural disasters, in particular in association with rainfall. With the goal of determining near real-time half-hourly rain estimates from satellite, the three-layer, artificial neural networks (ANN) approach was used to train the brightness temperatures at 6.7, 11, and 12-µm channels of the Japanese geostationary satellite MTSAT against passive microwave- based rain rates from Tropical Rainfall Measuring Mission (TRMM) Microwave Imager (TMI) and TRMM Precipitation Radar (PR) data for the June-September 2005 period. The developed model was applied to the MTSAT data for the June- September 2006 period. The results demonstrate that the developed algorithm is comparable to the PERSIANN (Precipitation Estimation from Remotely Sensed Information using Artificial Neural Networks) results and can be used for flood monitoring across the Indochina area on a half-hourly time scale.
Keywords: Rainfall retrieval, Indochina, IR remote sensing, MTSAT
Introduction
In the Indochina area, rainfall is highly variable across a range of time scales over daily, seasonal, and decadal intervals. Too much rainfall can lead to devastating floods, such as those which occurred in Central Vietnam in October 1999, November 2000 and in Hanoi, Vietnam in October 2008, whereas too little rain can result in crop failure, famine, and high risk of forest fires. Therefore, real-time rainfall estimation is important for allowing a timely response to potential natural disasters associated with heavy rainfall, particularly in the highly populated Indochina area where proper surface observation facilities are not sufficient. At least a half-hourly to hourly rain estimation is desirable for flood monitoring, forecasting, and agricultural purposes. Because ground-based observation facilities are not located as densely or as frequently as needed, satellite measurements of rainfall appear to be more feasible and effective for the
purpose of real-time rainfall measurement.
The Tropical Rainfall Monitoring Mission (TRMM) has provided a new platform for precipitation monitoring because of its microwave sensor and precipitation radar capabilities (Kummerow et al., 1998). The TRMM Precipitation Radar (PR), as the first space-borne precipitation radar, provides vertical rain profiles for use as a more refined reference than other available satellite methods. In contrast, the multi-frequency TRMM Microwave Imager (TMI) provides physically sound rain distributions. However, due to the rather limited spatial and temporal coverage of the TRMM satellite, and also due to the need for more frequent rain estimation for flood monitoring, it is desirable to combine high-quality TRMM data with more frequent IR-based geostationary measurements.
In response to such needs, there have been efforts toward maximizing and extracting rain information from the TRMM/TMI-PR data to obtain more frequent and spatially homogeneous rain distributions from the geostationary images (Adler et al., 1993;
Huffman et al., 1997; Kummerow and Giglio, 1995;
Xu et al., 1999, Sorooshian et al., 2000; Joyce et al., 2004, Huffman et al., 2007 among many others).
*Corresponding author: [email protected]
*Tel: 82-2-880-7783
*Fax: 82-2-872-8156
466
Nguyen Vinh Thu and Byung-Ju SohnMore recently, by combining and merging TRMM- based products with geostationary measurements, rainfall products with higher spatial and temporal resolution (with 0.25o spatial and 3-hour temporal scales) have become available [e.g., PERSIANN (Precipitation Estimation from Remotely Sensed Information using Artificial Neural Networks, Sorooshian et al., 2000), CMORPH (Climate Prediction Center Morphing Method, Joyce et al., 2004), TMPA (TRMM Multi-satellite Precipitation Analysis, Huffman et al., 2007), and the National Research Laboratory (NRL) blended precipitation dataset (NRL-blended, Turk and Miller, 2005)]. Although the commonly called High Resolution Precipitation Products (HRPPs) data are used more often in various areas, the three-hourly estimates may not be frequent enough to monitor the evolution of floods in the Indochina area, which has an eastern coast that ranges from 5oN to 25oN over a distance of nearly 2,000 km. Furthermore, direct application of these algorithms to local weather phenomena has remained elusive, as the rain estimation algorithm may vary with the specific climate regime. In other words, locally dependent algorithms may be necessary for locally focused purposes.
Being motivated by those needs, we adopted an artificial neural network (ANN) approach (Lippmann, 1987) to estimate a half-hourly rainfall from Japanese MTSAT infrared brightness temperature measurements.
It is because rainfall variability over the Indochina area is very high due to the tropical convective rain characteristics. Thus the training using ANN method can help to extract the non-linear behavior existing between surface rainfall and satellite-measured brightness temperatures. The ANN model we used in this study is designed to be capable of extracting and combining information from various datasets, including brightness temperatures at 11, 12, and 6.7 µm and rainfall rates from combined TRMM TMI and PR data. In the long run, these half-hourly rain products will then be used to improve the operational weather and hydro-forecast in Vietnam and other countries across the Indochina region, in particular
where conventional meteorological measurements are lacking.
Methodology and Datasets Used
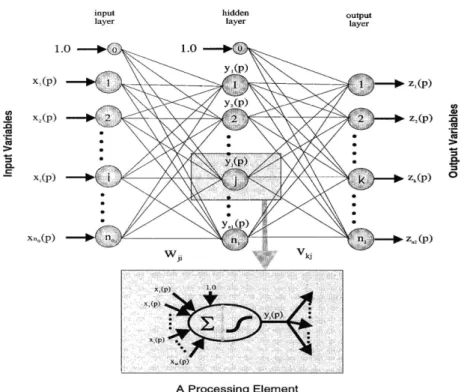
Use of the artificial neural network (ANN) The ANN provides a convenient and powerful means of performing non-linear classification and regression, by partitioning the input space into sub- domains, which may then be associated with a desired set of output values (Freeman and Skapura, 1991). The basic form of the ANN is called a multilayer feedforward network. We used a three-layer feedforward neural network consisting of three layers of processing nodes (neurons) with connections linking the nodes in successive layers, as shown in Figure 1. The first layer (the input layer) consists of no input nodes with one node for each normalized input variable xi, (i=1, …, no). The intermediate layer (the hidden layer) consists of n1 hidden nodes, yj, (j=
1, …, n1), and it may have many hidden layers. The final layer (the output layer) consists of n2 output nodes with one node for each output variable zk, (k=
1, …, n2). The input-to-hidden layer transformation performs a continuous nonlinear mapping of the no input values xi to the intermediate variable yj; these transformations are weighted according to . In a similar fashion, the hidden-to-output layer transformation performs a linear or nonlinear mapping of the n1 intermediate variables yj to the output values zk; the parameters of this transformation are weighted according to .
The configuration of the ANN constructed for this study is shown in Fig. 1. Twelve input values define the essential characteristics of the MTSAT data. These are scaled to a range between zero and one and are connected to each of ten Sigmoidal artificial neurons in the first hidden layer. The hidden layer contributes to the rainfall estimate through a linear combination of outputs from the hidden layer. If the output values are smaller than zero, then no rainfall is assumed.
Rainfall estimation from satellite data poses a considerable challenge to a simple neural network
wjih
wkjo
approach due to the presence of many contradictory exemplars in the training data. Contradictory exemplars are cases in which similar inputs are associated with very different outputs and particularly occur around the edges of rain areas where cloud features may vary
only marginally across the rain or no-rain boundary. In many cases, these problems are found to prevent a single-layer feedforward network from effectively training against the example data. A three-layer network is an effective way of providing considerable Fig. 1. The structure of a three-layer feedforward Artificial Neural Network (ANN) and details of each internal processing ele- ment (adopted from Freman and Skapura, 1991). Twelve input parameters are given in Table 1. The linear combination of out- puts from the hidden layers and through 10 Sigmoidal artificial neurons is schematically given in the lower panel.
Table 1. List of input variables used for the current ANN model
Order Variable Name Explanation
1 GEO Geographic location of the pixel 2 DD The Julian day of the year
3 SURF Surface types (land, mountain, coast, ocean) 4 TB11 The 11 µm brightness temperature
5 TB11-12 The brightness temperature difference between 11 and 12µm (Tb11-Tb12)
6 TB11-6.7 The brightness temperature difference between 11 and 6.7µm water vapor channel (Tb11-Tb6.7) 7 TB11-3x The brightness temperature at 11 µm channel averaged over surrounding 3×3 pixels
8 TB11-12-3x The difference of brightness temperature between 11 and 12µm averaged over surrounding 3×3 pixels 9 TB11-6.7-3x The difference of brightness temperature between 11 and 6.7µm averaged over surrounding 3×3 pixels 10 TB11-5x The brightness temperature at 11mm channel averaged over surrounding 5×5 pixels
11 TB11-12-5x The difference of brightness temperature between 11 and 12µm averaged over surrounding 5×5 pixels 12 TB11-6.7-5x The difference of brightness temperature between 11 and 6.7µm averaged over surrounding 5×5 pixels
468
Nguyen Vinh Thu and Byung-Ju Sohnadditional complexity at a relatively modest additional computational cost and is generally thought to be most effective when the input data are clustered within the arbitrarily defined space (Oki et al., 1998).
Training dataset
Images of brightness temperatures at the 11-µm and 12-µm windows and of the 6.7-µm water vapor channels from the MTSAT satellite every 30 minutes from June 1st to September 30th 2005 were obtained, over the analysis domain of Equator to 30oN and 100oE to 115oE.
The raw data at a resolution of 4 km were remapped to a grid resolution of 0.04o. These data were then spatially and temporally collocated with TRMM/TMI and PR combined data to construct a training dataset for the neural networking. Combined TRMM TMI and PR rain- rate products for the same training period across the Indochina region were used as target values during the training processes by the ANN model.
In addition, rainfall is assumed to be dependent on natural conditions such as the surface type, solar geometry, and geographical location. Although the training period used was only four months, rainfall behavior over the Indochina region varies significantly
from June to September, even for the same measured values of radiance or brightness temperature. Thus, in addition to the physical variables that are more directly related to rainfall, three indirect parameters were used. The observation time (day of the year), surface type, and geographical location are considered as indirect input parameters that may augment the rainfall detection capability. For the collocation, data were kept when the difference between the observation time of the MTSAT and TRMM was less than ten minutes. Selected pixels were kept for training data only if the TRMM data demonstrated a rain event at a given location.
All of the input data are scaled with values between zero and one. If these values approach zero or one, the network approaches a saturated stage. Since the outputs of the model are given as a ratio between zero and one, we need to convolve this ratio to the corresponding rainfall amount. Note that the amplitudes of the scale function as well as the formulas applied to the input layer should be equal to the inverse of the outputs. By assuming that negative and zero values indicate no rain, only the positive rainfall values were kept.
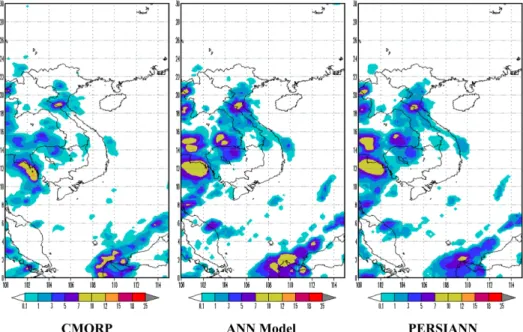
Fig. 2. Geographical distributions of rain rates for 2100 UTC August 29th 2006 from CMORPH, ANN, and from PERSIANN.
Units are given in mm/hr.
Monthly training processes yield one set of weights for each month (here a total of four sets for the four months in the June to September period). The obtained weights for a particular month can then be applied for the same month of any year (here June to September 2006). In this case, four different datasets of weights with about 130 weighting values for each dataset were prepared. Rain rates were obtained at each 0.25o grid. The regionally based ANN method employed herein is called the ‘ANN model’ for the sake of convenience.
Results
When training the outputs against noisy input data through the ANN approach, it is essential to ensure that the non-linear function employed in the training process is generally applicable. This general applicability can be tested by applying the obtained model to a different set of exemplars that are not included in the training process. In this study, the obtained ANN model for the rain-rate estimate across the Indochina area was applied to produce the rain rates at a half- hourly time scale for the period from 1st June to 30th September 2006. Thus, the weights derived for each month in 2005 were applied for the same month in 2006.
In order to assess the performance of the developed ANN model, we compared rainfall products from the ANN model against products from other satellite rainfall techniques and surface rain gauge measurements during the 2006 rainy season. Satellite products used for the validation of ANN rain estimates are high resolution precipitation products (HRPPs) by CMORPH and PERSIANN, which offer a global rainfall map every 3 hours with a 0.25° resolution. These HRPPs use somewhat similar inputs: microwave measurements from the Special Sensor Microwave Imager (SSM/I), TRMM Microwave Imager (TMI), Advanced Microwave Sounding Unit (AMSU), and Advanced Microwave Scanning Radiometer of Earth Observing System (AMSR-E). Here, for SSM/I, TMI, and AMSR-E, rainfall estimates were obtained from the Goddard Profiling algorithm (GPROF, Kummerow et al., 1996). For AMSU, estimates were obtained from an NOAA operational algorithm (Weng et al., 2005).
In all of the algorithms, microwave-based precipitation measurements were augmented by geostationary-based infrared brightness measurements. A good summary of the algorithms and their inputs is found in Sapino and Arkin (2009), and a brief description of CMORPH and PERSSIAN algorithms is provided herein.
The CMORPH algorithm aims to provide global distributions of rainfall every three hours, with a Fig. 3. Scatter diagrams of grid-based rainfall for 2100 UTC August 29th 2006 for ANN vs. CMORPH (left panel), and ANN vs. PERSIANN (right panel). Each point represents instantaneous rainfall at each grid area of 0.25o×0.25o.
470
Nguyen Vinh Thu and Byung-Ju Sohnresolution of approximately 8 km (Joyce et al., 2004).
It combines various PMW rain estimates (such as TMI, SSM/I, AMSU, and AMSR-E). After calibrating PMW estimates against TMI values, all PMW estimates are counted as CMORPH rainfall data, regardless of the presence of IR measurements.
However, because the global coverage is insufficient due to microwave measurements being taken on a 30- minute time scale, vast areas may have gaps in which PMW estimates are not available. To fill these gaps, microwave-based rainfall values are interpolated with time by counting the propagation of cloud systems obtained from geostationary IR-based motion vectors (Joyce et al., 2004).
The PERSIANN algorithm is based on a neural network approach that is operated at a space resolution of 0.25o to determine the global rainfall
from geostationary IR measurements (Hsu et al., 1997;
Sorooshian et al., 2000). In this algorithm, rain rate at one location is calculated by using target brightness temperatures at window channels and its surrounding temperature textures in terms of average and standard deviations based on the ANN method.
First, the ANN-estimated rain rates are compared against CMORPH and PERSIANN data. As a case in point, the 2100 UTC August 29th 2006 case was selected. Since CMORPH and PERSIANN products are only available in the form of a three-hourly mean rain rate, the ANN-estimated half-hourly rain rates were taken to calculate the three-hourly mean rain rates. The geographical distributions of rain rates for the 2100 UTC August 29th 2006 case are given in Figure 2. This figure shows that the rain distributions obtained using the three methods are generally in Fig. 4. Scatter diagrams of ANN-produced rain rates vs TRMM/TMI and PR combined products for (a) June, (b) July, (c) August, and (d) September 2006. The dotted lines denote best fits. Related statistics are given in Table 2.
good agreement with each other. In terms of magnitude, the ANN method shows slightly stronger rain rates, in comparison to the CMORPH method;
this is particularly true for light rain that falls at less than 2.0 mm/hr, as is clearly evident along the coast of Central Vietnam.
In addition to the similarities in geographical distribution, the magnitudes obtained using our method and the PERSIANN method were also very similar. The close agreement is not surprising when we consider that the two methods are based on the neural network approach of training geostationary
satellite-observed IR brightness temperatures against microwave-based rainfall measurements.
To examine the statistical behaviors amongst the three methods, pixel-based rain rates from the three methods are compared using scattergrams, as shown in Fig. 3. As also examined in Fig. 2, rain-rate estimates by the ANN method are generally greater than CMORPH rain rates, with a correlation coefficient of approximately 0.65 and a mean bias of approximately 0.2. Again, rain rates from the ANN method are very similar to PERSIANN products, with a correlation coefficient of 0.94. However, the ANN rain rates tend to be greater than the PERSIANN rates in the case of light rain.
Combined TRMM TMI and PR rain rates and the ANN-produced rain-rate data were processed into the same 0.25o×0.25o grid format, collocated and coincident data were collected to allow intercomparison. Rain rates from the ANN were obtained by taking three consecutive images centered at the time closest to the TRMM observation time. Scatter diagrams of the rain rates for each month from June through September 2006 are presented in Fig. 4 with associated statistics.
The dotted lines in Fig. 4 denote the best-fit lines.
Although the comparison is made for each month using instantaneous rain rates, the performance appears to be slightly dependent on the season; the correlation coefficients of June, July, August and September are 0.55, 0.60, 0.59, and 0.57, respectively. The mean biases and root mean square difference (RMSD) appear to be relatively small.
The ANN results were also compared with rain gauge measurements from across Vietnam, obtained from 120 gauge sites (operated by National Hydro- Meteorological Service of Vietnam, NHMS), the geographical locations of which are presented in Fig.
5. For comparison, the daily surface rainfall data were acquired for the 2006 rainy season. The ANN half- hourly rain rates for July 2006 were added together to produce the daily rainfall, because rain gauges report only the daily accumulated rainfall. The rain gauge data were first collocated to the ANN-produced data by matching with time and location. The surrounding Fig. 5. Locations of 120 rain gauge sites (dots) in Vietnam
operated by NHMS, Vietnam.
472
Nguyen Vinh Thu and Byung-Ju Sohnpixels over the 12 km×12 km area centered at one rain gauge location were chosen, and 48 different measurements from the geostationary MTSAT satellite were used to obtain the daily accumulated value.
The results given in Fig. 6 show the scatterplots of the ANN model results against the rain gauge measurements. The ANN tends to underestimate heavy rainfall, especially in the case of a daily rainfall greater than 70 mm/day. This is probably because the TRMM TMI/PR data used for the training dataset cannot describe the high rainfall well enough to reproduce the IR measurements. The correlation coefficient, the mean bias, and the RMSE from this one-month comparison are 0.56, 2.1 mm/day, and 0.47 mm, respectively. However, by comparison, because results from the Korean peninsula using rainfall from the AWS gauge network indicate that the correlation coefficients over the summer time ranges from 0.38 to 0.58 for four HRPP products (Sohn et al., 2010), correlation coefficients that are around 0.56 appear to be quite significant. In particular, heavy rainfall events are relatively well captured by this ANN method, in comparison to the satellite-based HRPP products over the Korean peninsula.
Summary and Discussion
To estimate rain rates over the Indochina region where highly populated residential areas are prone to natural disasters, in particular those associated with heavy rainfall, we developed an ANN-based retrieval algorithm. The method was developed by training the IR-based cloud top temperature and the temperature difference between the 11-µm and water vapor channels against collocated PMW-based rain rates using the counter propagation network, which consists of three layers and a linear output layer. The surface type and geographical location were also included as initial inputs. We aimed to produce surface rain rates with a 0.04o×0.04o grid area and a 30-minute time interval from the Japanese geostationary satellite MTSAT measurements. Training was carried out for each individual month from June to September 2005, and the results were applied to the same months for 2006.
The results for the June to September 2006 rainy season reveal that the ANN technique appears to enhance our capability for rain estimation from geostationary satellite imagery over the Indochina region, in terms of output quality and temporal resolution. It has also been shown that instantaneous rain rates with a 0.25o grid are well correlated with collocated TRMM TMI and PR rainfall estimates, with correlation coefficients from 0.55 to 0.60 and with a bias of nearly zero. It is also acceptable as far as the surface rainfall observation is concerned, because of the statistical significance shown in the correlation, bias, and root mean square deviation of 0.56, 2.1, and 0.47, respectively.
In general, the ANN technique developed here appears to be comparable to the PERSIANN method, although the ANN results show slightly higher magnitudes in the case of light rain. This result is probably because the PERSIANN method is also based on the neural network that relates the same TRMM data to the same geostationary MTSAT data, Fig. 6. Scatter diagrams of the ANN daily rainfall esti-
mates vs. surface rain gauge observations from 120 sites in Vietnam from 1st to 31st July 2006.
but the PERSIANN method is trained globally.
Furthermore, our model is designed for a small region in the Indochina area with 130 nodes, which is very different from the PERSIANN approach in terms of the number of input nodes and hidden layers. A recent study reported by Sohn et al. (2010) showed that the PERSIANN method performs poorly over the Korean peninsula, which strongly suggests that a local or regional approach is necessary to improve rain estimation for the neural network approach. The results shown herein may provide indirect evidence that the PERSIANN method is heavily weighted against tropical rainfall due to its training. Furthermore, our method developed herein provides half-hourly rain products of similar data quality to those obtainable from three-hourly PERSIANN products. In contrast, this method appears to perform better than the CMORPH data when compared with the TRMM rainfall estimates.
The TRMM TMI and PR-produced rain rates are routinely available over the global tropics and subtropics, enabling the potential application of the ANN technique for flood monitoring and rain observation across the Indochina area. In addition, the ANN method incorporates multi-spectral water vapor and infrared measurements, in contrast to other empirical algorithms that combine the PMW-derived rain rate with single infrared channel measurement, resulting in better output from geostationary satellites.
In the future, this technique may provide more frequent rain estimates for this area when existing measurements from MTSAT and FY satellites are combined with the data from the Korean geostationary satellite COMS.
Acknowledgments
This work was supported by the Korea Meteorological Administration Research and Development Program under Grant CATER 2006-2103.
References
Adler, R.F., Negri, A.J., Keehn, P.R., and Hakkarinen, I.M.,
1993, Estimation of monthly rainfall over Japan and surrounding waters from a combination of low-orbit microwave and geosynchronous IR data. Journal of Applied Meteorology, 32, 335-356.
Freeman, J.A. and Skapura, D.M., 1991, Neural networks:
Algorithms, applications, and programming technique.
Addison Wesley, USA, 305 p.
Huffman, G.J., Adler, R.F., Bolvin, D.T., Gu, G., Nelkin, E.J., Bowman, K.P., Hong, Y., Stocker, E.F., and Wolff, D.B., 2007, The TRMM Multisatellite Precipitation Analysis (TMPA): Quasi-global, multiyear, combined- sensor precipitation estimates at fine scales. Journal of Hydrometeorology, 8, 38-55.
Huffman, G.J., Adler, R.F., Bolvin, D.T., and Nelkin, E.J., 1997, The global precipitation climatology project (GPCP) combined precipitation dataset. Bulletin of American Meteorological Society, 78, 5-20.
Hsu, K.-L., Gao, X., Sorooshian, S., and Gupta, H.V., 1997, Precipitation estimation from remotely sensed information using artificial neural networks. Journal of Applied Meteorology, 36, 1176-1190.
Joyce, R.J., Janowiak, J.E., Arkin, P.A., and Xie, P., 2004, CMORPH: A method that produces global precipita- tion estimates from passive microwave and infrared data at high spatial and temporal resolution. Journal of Hydrometeorology, 5, 487-503.
Kummerow, C., Barnes, W., Kozo, T., Shiute, J., and Sim- pson, J., 1998, The Tropical Rainfall Measuring Mis- sion (TRMM) sensor package. Journal of Atmospheric and Oceanic Technology, 15, 809-817.
Kummerow, C. and Giglio, L., 1995, A method for com- bining passive microwave and infrared rainfall observa- tions. Journal of Atmospheric and Oceanic Technology, 12, 33-45.
Kummerow, C., Olsen, W.S., and Giglio, L., 1996, A sim- plified scheme for obtaining precipitation and vertical hydrometeor profiles from passive microwave sensors.
IEEE Transactions on Geoscience and Remote Sensing, 34, 1213-1232.
Lippmann, R.P., 1987, An introduction to computing with neural network. IEEE ASSP Magazine, 4, 4-22.
Oki, R., Furukawa, K., Shimizu, S., Suzuki, Y., Satoh, S., Hanado, H., Okamoto, K., and Nakamura, K., 1998, Preliminary results of TRMM: Part I, A comparison of PR with ground observations. Journal of Marine Tech- nological Society., 32, 13-23.
Sapiano, M.R. and Arkin, P.A., 2009, An intercomparison and validation of high-resolution satellite precipitation estimates with 3-hourly gauge data. Journal of Hydrom- eteorology, 10, 149-166.
Sohn, B.J., Han, H.-J., and Seo, E.-K., 2010, Validation of satellite-based high-resolution rainfall products over the Korean peninsula using data from a dense rain gauge
474
Nguyen Vinh Thu and Byung-Ju Sohnnetwork. Journal of Applied Meteorology and Climatol- ogy, 49, 701-714.
Sorooshian, S., Hsu, K.L., Gao, X., Gupta, H.V., Imam, B., and Braithwaite, D., 2000, Evaluation of PERSIANN system satellite-based estimates of tropical rainfall. Bul- letin of American Meteorological Society, 81, 2035- 2046.
Turk, F.J. and Miller, S.D., 2005, Toward improving esti- mates of remotely-sensed precipitation with MODIS/
AMSR-E blended data techniques. IEEE Transactions on Geoscience and Remote Sensing, 43, 1059-1069.
Weng, F., Grody, N.C., Zhao, L., Meng, H., Kongli, C., Pellegrino, P., Qiu, S., and Dean, C., 2005, NOAA operational hydrological products derived from the Advanced Microwave Sounding Unit. IEEE Transac- tions on Geoscience and Remote Sensing, 43, 1036- 1049.
Xu, L., Gao, X., Sorooshian, S., and Arkin, P.A., 1999, A microwave infrared threshold technique to improve the GOES precipitation index. Journal of Applied Meteorol- ogy, 38, 569-579.
Manuscript received: July 22, 2010 Revised manuscript received: September 15, 2010 Manuscript accepted: September 18, 2010