1. Introduction
Prestressed tendon has become the key member in a variety of structures such as prestressed concrete bridges. Dealing with prestressing techniques, structures can be bigger, larger and even slimmer. However, risks following with these techniques can be worse due to the loss of prestress forces since the loss can causes serious reduction of load carrying capacity. Therefore, the performance of the prestressed tendon has to be ensured as well as possible for the safety of the structure. Among potential damages in prestressed structures, the damage of tendon-anchorage system such as relaxation of cable stress, failure of connection components usually occurs.
In general, structural health monitoring(SHM) is classified as global and local SHM. Up to
date, many studies have been focused on SHM of prestressed structures by using global and local dynamic characteristics[1-4]. The global SHM which usually deals with acceleration- based methods can monitor prestress force but not sensitive to incipient prestress-loss. On the other hand, impedance-based local SHM is found to be very promising to capture small incipient damage at limited region like cable- anchorage connection. The impedance-based method was first proposed by Liang et al.[5].
Since then, many researchers have improved the method and applied the method to various damage detection problems[7-10]. The method utilizes electro-mechanical impedance(EMI) in high frequency responses, which are typically higher than 30 kHz through surface-bonded PZT patches to monitor changes in structural mechanical impedance. In this method, PZT
Wireless Impedance Sensor with PZT-Interface for Prestress-Loss Monitoring in Prestressed Concrete Girder
Khac-Duy Nguyen*, So-Young Lee* and Jeong-Tae Kim*
Abstract Ensuring the designed prestress force is very important for the safety of prestressed concrete bridge.
The loss of prestress force in tendon could significantly reduce load carrying capacity of the structure. In this study, an automated prestress-loss monitoring system for prestressed concrete girder using PZT-interface and wireless impedance sensor node is presented. The following approaches are carried out to achieve the objective.
Firstly, wireless impedance sensor nodes are designed for automated impedance-based monitoring technique. The sensor node is mounted on the high-performance Imote2 sensor platform to fulfill high operating speed, low power requirement and large storage memory. Secondly, a smart PZT-interface designed for monitoring prestress force is described. A linear regression model is established to predict prestress-loss. Finally, a system of the PZT-interface interacted with the wireless sensor node is evaluated from a lab-scale tendon-anchorage connection of a prestressed concrete girder.
Keywords: Prestress-Loss, Automated Monitoring, Imote2, Impedance Sensor Node, PZT-Interface, Prestressed Concrete Girder
[Original paper]
Journal of the Korean Society for Nondestructive Testing Vol. 31, No. 6 (2011. 12)
[Received: September 8, 2011, Revised: November 18, 2011, Accepted: December 8, 2011] *Department of Ocean Engineering, Pukyong National University, Busan 608-737, Korea Corresponding Author: [email protected]
patches can act as both sensors and actuators based on their electro-mechanical coupling. For prestress-loss monitoring, Kim et al.[3]
successfully utilized variation of impedance of bearing plate due to tendon-force loss. However, the method needed an expensive, bulky impedance analyzer to catch impedance variation in very high frequency range (e.g. over 800 kHz).
One of the important issues for successful SHM is to develop wireless smart sensor nodes for cost efficient and autonomous operation. The high costs associated with wired systems can be greatly reduced through the adoption of wireless[11-17]. Wireless sensor node for impedance-based monitoring was first proposed by Mascarenas et al.[18]. The sensor node then has been modified by Park et al.[4] and Taylor et al.[19] by following the same concept.
Applying to prestress-loss monitoring, Park et al.
[4] utilized impedance variation of embedded interface washer to monitor tendon-force loss using an impedance sensor node. However, their sensor nodes were developed on ATmega128 which has limitations on memory deposition, wireless communication, and energy harvesting.
Moreover, the relationship between impedance signatures and prestress-loss were not clearly identified.
In this study, an automated prestress-loss monitoring system for prestressed concrete girder using PZT-interface and wireless impedance sensor node is presented. The following approaches are carried out to achieve the objective. Firstly, wireless impedance sensor nodes are designed for automated impedance- based monitoring technique. The sensor node is mounted on the high-performance Imote2 sensor platform to fulfill high operating speed, low power requirement and large storage memory.
Secondly, a smart PZT-interface designed for monitoring prestress force is described. A linear regression model is established to predict
prestress-loss. Finally, a system of the PZT- interface interacted with the wireless sensor node is evaluated from a lab-scale tendon-anchorage connection of a prestressed concrete girder.
2. Wireless Impedance Sensor Node
Imote2 sensor platform shows the excellent performance on wireless SHM network for civil engineering applications[20,21]. The large memory and high speed associate with the Imote2 allows it enable for advanced complicated smart SHM techniques. Also, the Imote2 platform is very convenient to integrate with energy harvesting modules.
The specifications of Imote2 are summarized in Table 1. The Imote2 has a high speed microcontroller and large amount of data repository. The main board of the Imote2 incorporates a low-power X-scale process, PXA27x, and a wireless radio, CC2420. The microcontroller PXA27x is designed to run for multiple tasks which include operation schedule, system control, and radio transmission. It allows double-point precision valuables using 8 bytes.
The amount of memory for programming and data repository is also very large. The Imote2 has 256 kB of integrated SRAM, 32 MB of external SDRAM, and 32 MB of program flash memory. For operation, although the Imote2 consumes more power in high-speed mode and the embedded wireless radio has short transmitting distance (i.e., 30 m), the data processing speed of the Imote2 is faster enough to provide good computational capability and the transmitting distance can be expanded to hundreds of meter (e.g., up to 170 m[22]) by using appropriate external antenna. Based on the above-mentioned performances, the Imote2 sensor platform is selected for the smart impedance-based SHM system
According to the excellent above-mentioned
performances of the Imote2, an impedance-based
smart sensor node is designed on the Imote2 platform. The impedance sensor board is named as SSeL-I16. The design schematic of the Imote2/SSeL-I16 sensor node is given in Fig. 1.
Similarly to the previous designs (e.g., Mascarenas et al.[18]; Park et al.[4]), the core component of the sensor node is the AD5933 impedance chip. This impedance chip has the capability of measuring electric impedance up to 100 kHz. The AD5933 impedance chip has the following embedded multi-functional circuits:
function generator, digital-to-analog(D/A) con- verter, current-to-voltage amplifier, anti-aliasing filter, A/D converter, and discrete Fourier transform(DFT) analyzer. The AD5933 outputs real and imaginary values of impedance for a target frequency of interest and transmits the values into a microcontroller. In this design, an
ADG706 multiplexer is integrated into SSeL-I16 board to allow monitoring impedance from up to sixteen PZT sensors by a single sensor node.
A SHT11 sensor is also integrated into SSeL- I16 board to monitor environmental temperature and humidity. For operation, the Imote2 plat- form is utilized for controlling impedance measurement and wireless communication by the on-board microcontroller PXA27x and wireless radio CC2420.
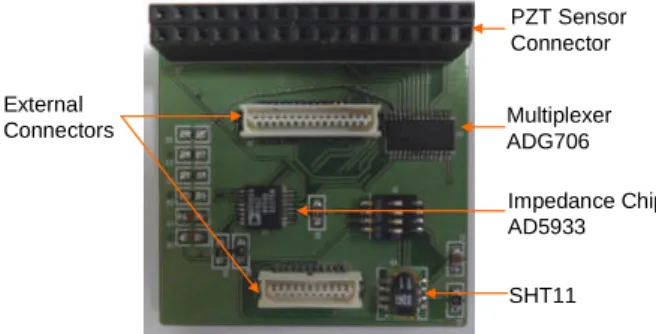
The components of the SSeL-I16 board are shown in Fig. 2. As shown in the figure, the SSeL-I16 board connects to Imote2 through 31-pin and 21-pin connectors at one side. It also allows other external devices to connect to Imote2 by returning the connectors at another side. The full sensor node Imote2/SSeL-I16 is shown in Fig. 3 with three layers: battery board, Imote2 platform and SSeL-I16 board. The specifications of the Imote2/SSeL-I16 along with
Table 1 Specification of Imote2 sensor platform [25]
Feature Imote2
Clock speed (MHz) 13-416
Active power (mW) 44 at 13 MHz 570 at 416 MHz Program flash (bytes) 32 M
RAM 256 K + 32 M external Radio Frequency (MHz) 2400
Data rate (kbps) 250
Outdoor range (m) 30
Power of Radio (mW)
52 (transmitting) 59 (receiving) 0.06 (powered-down) Table 2 Specifications of HIOKI 3532-50 and
Imote2/SSeL-I16
Features HIOKI 3532-50 Imote2/SSeL-I16 Imp. Range 10 mW~200 MW 1 kW~10 MW Freq. Range 42 Hz~5 MHz 1 kHz~100 kHz
No. of Channel 1 16
Excitation
Voltage (Vp-p) 1~14 V 1.98 V
Cost US $ 10,000 US $ 350
Imote2 Sensor Platform Imote2 Sensor Platform
Impedance Converter Analog Devices
AD5933 Impedance Converter
Analog Devices AD5933
I2C 3.2V
Temperature & Humidity Sensor Sensirion
SHT11 Temperature & Humidity
Sensor Sensirion
SHT11 3.2V
16 Channel Multiplexer Analog Devices
ADG706 16 Channel Multiplexer
Analog Devices ADG706
…
PZT 1 PZT 2 PZT n
Fig. 1 Design schematic of impedance senor node
PZT Sensor Connector
Multiplexer ADG706
Impedance Chip AD5933 External
Connectors
SHT11
Fig. 2 Components of impedance sensor board SSeL-I16 Sensor Board
Imote2 Platform
Battery Board External Antenna
Fig. 3 Imote2/SSeL-I16 prototype
a commercial impedance analyzer HIOKI 3532-50 are summarized in Table 2. Compared to the HIOKI 3532-50, although the Imote2/
SSeL-I16 has narrower sensing frequency range, it has a large number of measuring channel (i.e., 16 channels). Most importantly, cost of the sensor node is much cheaper than that of the commercial one.
3. PZT-Interface for Prestress-Loss Monitoring
The impedance-based method has shown the excellent performance in local SHM on many various aspects. However, this method still has some limitations for civil engineering applica- tions. Firstly, a high performance impedance analyzer is usually needed for measuring electro- mechanical impedance of monitored target structures. However, the cost of commercial instrument associated with the wired system is very high. So there have been efforts to overcome these disadvantages by adopting wireless impedance device[18, 4]. In order to apply the new approach, however, the measurable frequency range of 10 kHz-100 kHz of the wireless sensors should be dealt appropriately for impedance measurement as well as feature extraction. This frequency range is relatively low compared with that of the impedance analyzer. The low frequency may interfere with wide applications in real structures.
Secondly, the frequency range which is sensitive to damage has to be identified in order to employ the impedance-based method for damage detection. Generally, the effective frequency range is various depending on target structures and usually determined by trial and error. This causes difficulty when applying the impedance-based method to real structure since the effective frequency range is almost unknown and may take lots of effort to obtain it by trial and error.
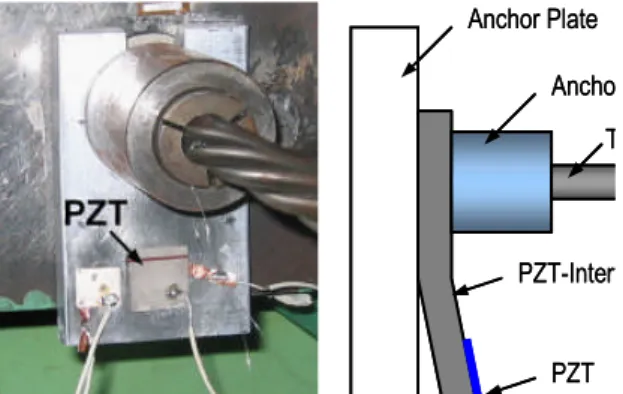
In order to overcome the above-mentioned limitations, Nguyen and Kim[23] proposed the use of PZT-interface associated with impedance sensor node for bolt-loose detection. The principle of the method is to realize changes in boundary of the PZT-interface due to bolt-torque reduction using impedance measurement in low frequency range. Following this principle, a PZT-interface is designed for prestress-loss monitoring in prestressed concrete girder as shown in Fig. 4. The PZT-interface is made of aluminum, and its entire dimension is 100×60×10 mm. The PZT patch is PZT-5A type [24] and its size should be selected based on the target structure and prestress force. For example, a square PZT patch of 20×20×0.5 mm was selected for the evaluation test. Square shape is commonly used because it is conveniently made, easily adjustable in size from a large PZT sheet. Also, square PZT is suitable to one-directional damage detection.
Basically, the PZT-interface is separated into two parts for its functions. Part 1 is installed to a tendon-anchorage connection and controlled by tendon force, and part 2 is the flexible plate which is vibrated by PZT-induced force. As also shown in Fig. 4, the PZT-interface is clamped by an anchorage and a steel plate. Therefore, the PZT-interface behaves like a cantilever plate with an imperfectly fixed boundary. Any change in anchorage prestress force will be represented by the changes in boundary condition and stress field of the PZT-interface, which in turn affects the impedance measured from the PZT patch. It is worth noting that the natural frequencies of the cantilever-like PZT-interface are usually smaller than 100 kHz which is appropriate for impedance-based SHM in low frequency.
Furthermore, by designing dimension and
material of the PZT-interface appropriately, the
resonance frequencies of interest can be
adjusted.
Anchor Plate Anchoage
Tendon
PZT-Interface
PZT Anchor Plate
Anchoage Tendon
PZT-Interface
PZT Fig.4 Tendon-anchorage system with PZT-interface
4. Prestress-Loss Monitoring in Prestressed Concrete Girder
4.1 Impedance Responses versus Prestress-Loss
A lab-scaled tendon-anchorage connection of a prestressed concrete girder as shown in Fig. 5 was utilized to investigate the variation of impedance signatures with the loss of prestress force. A PZT-interface was installed to the tendon-anchorage connection as the way shown in Figs. 4 and 5. The impedance signatures of PZT-interface were measured by an impedance sensor node Imote2/SSeL-I16 placed near the connection. The sensor node was powered by three D-Cell batteries which ensure the power supply for the sensor during the test. A base station which is instrumented with an IIB 2400/Imote2 and a computer was placed at about 5 m distant from the tendon-anchorage connection. The IIB2400 is an interfacial board which separates two ports from the Imote2 to the computer, one for sending command and receiving debug messages from remote node, and one for communicating data. A command- line interface, Cygwin OS[25], was utilized to operate the wireless system. Also, a commercial impedance analyzer HIOKI 3532-50 was utilized to provide precise measurements for comparison purpose. As summarized in Table 3, five prestress force levels which represent various tensile forces of tendon were applied gradually
to the anchorage. The first level C0 (i.e. tendon force is 98 kN) was considered as designed force. Meanwhile, the others represent various prestress-loss levels due to unhealthy conditions.
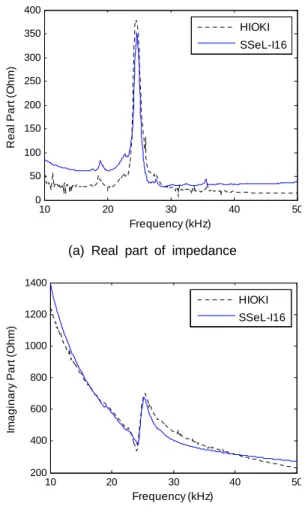
The performance of Imote2/SSel-I16 sensor node is evaluated by comparing its measurement with those by the HIOKI 3532-50. Fig. 6 shows impedance signatures in frequency range 10 kHz- 50 kHz with 501 points by the Imote2/ SSeL- I16 and the impedance analyzer at prestress force level C0. As shown in Fig. 6, both real part and imaginary part of impedance by the sensor node show the good matching with those by the wired commercial system. Note that, the real part of impedance contains much more information of structural behaviors than imagi- nary part[26]. Meanwhile, the imaginary part is useful for monitoring sensor’s health status and bonding condition[27].
Fig. 5 Experimental setup on tendon-anchorage connection of prestressed concrete girder
Table 3 Prestress-loss scenarios for investigating variation of impedance
Case Prestress Force (kN) Relative Loss of Prestress Force (%)
C0 98.00 0
C1 82.32 16
C2 73.50 25
C3 64.68 34
C4 54.88 44
For more sensitive monitoring, impedances of PZT-interface are measured in narrower frequency range, 20 kHz - 30 kHz with 501 sweeping points. Fig. 7 illustrates impedance signatures of the PZT-interface for the healthy state C0 and four loss states C1-C4. As shown
in the figure, the impedance signatures are significantly changed when tendon force decreases. It can be obviously seen that, under gradual loss of prestress force, resonance frequency tends to shift left which indicates the decrement of modal stiffness of the PZT- interface. The frequency shift with the prestress-loss can be graphically shown in Fig.
8(a). The results by the wireless system are very close to those by the wired commercial system.
It is found that the frequency shift varies almost linearly with the prestress-loss. Thus, prestress- loss can be predicted by establishing a linear regression model of frequency shift. It is worth noting that the variation of impedance amplitude which represents the change in modal damping of the PZT-interface can be observed in Fig. 7.
However, this variation is not clear to be considered as a damage indicator.
y = -0.0132x R2= 0.91
-0.8 -0.7 -0.6 -0.5 -0.4 -0.3 -0.2 -0.1 0
0 10 20 30 40 50
Force loss (%)
FrequencyShift(kHz)
SSeL-I16 HIOKI
Linear (SSeL-I16)
(a) Frequency shift
y = 0.0164x R2= 0.9959
0 0.1 0.2 0.3 0.4 0.5 0.6 0.7 0.8 0.9
0 10 20 30 40 50
Force loss (%)
RMSD
SSeL-I16 HIOKI
Linear (SSeL-I16)
(b) RMSD
Fig. 8 Frequency shift and RMSD of impedance signatures with prestress-loss
10 20 30 40 50
0 50 100 150 200 250 300 350 400
Frequency (kHz)
RealPart(Ohm)
HIOKI SSeL-I16
(a) Real part of impedance
10 20 30 40 50
200 400 600 800 1000 1200 1400
Frequency (kHz)
ImaginaryPart(Ohm)
HIOKI SSeL-I16
(b) Imaginary of impedance
Fig. 6 Impedance measurements by Imote2/SSeL-I16 and HIOKI 3532-50
20 22 24 26 28 30
0 50 100 150 200 250 300 350 400
Frequency (kHz)
RealpartofImpedance(Ohm) C0
C1 C2 C3 C4
Fig. 7 Impedance versus prestress force
In order to quantify the amount of variation in whole impedance signatures due to damage, RMSD index is utilized. The RMSD index is calculated by following equation:
* 2
1
2 1
Re( ( )) Re( ( )) Re( ( ))
n
i i
i n
i i
Z Z
RMSD
Z
(1)
where
and
are the real parts of the impedance signatures of the i
thfrequency measured before and after damage occurrence, respectively. Also, n signifies the number of frequency points in the sweep band.
Fig. 8(b) shows the RMSD results of impedance by the wired and wireless systems. The results by the two systems are very close to each other.
It is found that the RMSD index increases almost linearly with the prestress-loss. Thus, prestress-loss can also be predicted by establish- ing a linear regression model of RMSD.
4.2 Automated Estimation of Prestress-Loss
Since the relationship of impedance variation and prestress-loss was investigated, the prestress- loss can be estimated by monitoring the fre- quency shift or the RMSD index. Based on the linear regression equations shown in Fig. 8, amount of prestress-loss can be estimated by the following linear relationships:
0.0132
P f
P
(2)
and
0.0164
P R M SD P (3)
where ∆ is the amount of prestress-loss, is the designed load, and ∆ is the frequency shift.
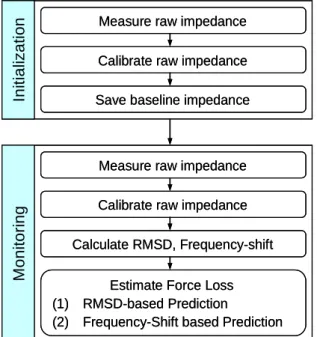
Based on the empirical eqns. (2) and (3), the following automated monitoring process is embedded to the impedance sensor node for calculating RMSD index and frequency-shift.
The monitoring scheme is outlined in Fig. 9.
Firstly, in the initialization stage, the impedance sensor node first measure impedance signatures at healthy state to obtain the baseline impedance. Subsequently, the sensor node changes to the monitoring stage. In the monitoring stage, impedances are continuously measured and compared with the baseline one.
The prestress-loss is estimated based on both RMSD index and frequency shift. Note that raw impedance measurements in each stage must be calibrated in magnitude and phase by appropriate linear functions to give accurate impedances of the structural system. The linear functions are established by comparing raw impedance from the sensor node with real one from the commercial impedance analyzer[23].
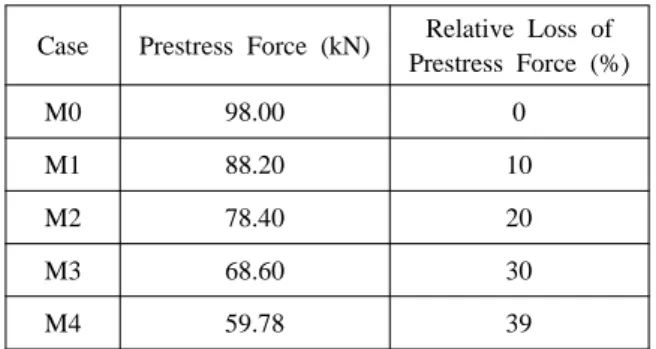
Another experiment on the same tendon- anchorage connection was carried out to evaluate the performance of the sensor node on prediction of prestress-loss. Five levels of prestressing were applied to the tendon- anchorage system as outlined in Table 4. The tendon was first stressed to designed load as 98 kN in case M0. For damaged cases, gradual losses of about 10% were released off the tendon. Among them, the maximum loss of 39%
(i.e. case M4) can be considered as severe damage. The prediction results by the Imote2/
SSeL-I16 are illustrated in Fig. 10. As shown in Fig. 10, by both RMSD-based and frequency- shift based methods, the prestress- losses predicted by the sensor node are very close to the infliction.
Table 4 Prestress-loss scenarios for estimation phase Case Prestress Force (kN) Relative Loss of
Prestress Force (%)
M0 98.00 0
M1 88.20 10
M2 78.40 20
M3 68.60 30
M4 59.78 39
Measure raw impedance
Calibrate raw impedance
Save baseline impedance
Measure raw impedance
Calibrate raw impedance
Estimate Force Loss (1) RMSD-based Prediction
(2) Frequency-Shift based Prediction Calculate RMSD, Frequency-shift
In it ia liz a ti o n M o n it o ri n g
Measure raw impedance
Calibrate raw impedance
Save baseline impedance
Measure raw impedance
Calibrate raw impedance
Estimate Force Loss (1) RMSD-based Prediction
(2) Frequency-Shift based Prediction Calculate RMSD, Frequency-shift
In it ia liz a ti o n M o n it o ri n g
Fig. 9 Embedded monitoring software
0 10 20 30 40 50
M0 M1 M2 M3 M4
ForceLoss(%)
Infliction
RMSD-based Prediction Frequency Shift-based Prediction
Fig. 10 Prestress-loss estimation by Imote2/SSeL-I16