로그 데이터를 이용한 하둡기반 맞춤형 관광시스템
Ding Ya*ㆍ김강철**
A Customized Tourism System Using Log Data on Hadoop
Ding Ya*ㆍKang-Chul Kim**
요 약
인터넷 사용이 증가함에 따라 많은 사용자 행위가 로그 파일에 기록되고, 최근에 이들을 이용한 연구와 산업 이 활성화되고 있다. 본 논문은 오픈 소스 기반 분산 컴퓨팅 플랫폼인 하둡을 사용하고, 로그 파일에 기록된 사 용자 행위를 분석하여 맞춤형 관광 정보를 제공하는 시스템을 개발한다. 제안된 시스템은 사용자들이 검색한 웹 사이트로부터 로그 파일을 얻기 위하여 구글의 Analytics를 사용하고, 하둡의 MapReduce를 사용하여 검색 항목 을 추출하여 HDFS에 저장한다. Octopus 프로그램을 사용하여 여행안내 웹사이트로부터 여행관련 관광지나 도 시에 대한 정보를 모으고, MapReduce를 사용하여 관광지의 특징을 추출한다. 그리고 관광지의 특징과 사용자 검색항목을 매칭하여 사용자에게 관광하고 싶은 맞춤형 도시를 제안한다. 본 논문에서는 매칭의 확률을 높이기 위하여 NBP(next bit permutation)알고리즘을 사용하여 검색항목과 관광지 특징을 재정렬하는 기법을 도입한다.
그리고 개발된 시스템의 효용성을 확인하기 위하여 39 명의 사용자에 대한 로그 데이터를 분석하여 맞춤형 관광 도시를 제안한다.
ABSTRACT
As the usage of internet is increasing, a lot of user behavior are written in a log file and the researches and industries using the log files are getting activated recently. This paper uses the Hadoop based on open source distributed computing platform and proposes a customized tourism system by analyzing user behaviors in the log files. The proposed system uses Google Analytics to get user’s log files from the website that users visit, and stores search terms extracted by MapReduce to HDFS. Also it gathers features about the sight-seeing places or cities which travelers want to tour from travel guide websites by Octopus application. It suggests the customized cities by matching the search terms and city features.
NBP(next bit permutation) algorithm to rearrange the search terms and city features is used to increase the probability of matching. Some customized cities are suggested by analyzing log files for 39 users to show the performance of the proposed system.
키워드
Hadoop, User Behavior, Website Log, Search Terms, City Features, Big Data 하둡, 사용자 행위, 웹 페이지 로그, 검색어, 도시 특징, 빅데이터
* 전남대학교 대학원 컴퓨터공학과 Ding Ya, [email protected]
** 교신저자 :전남대학교 전기전자통신컴퓨터공학부 ㆍ접 수 일 : 2017. 12. 19
ㆍ수정완료일 : 2018. 02. 15 ㆍ게재확정일 : 2018. 04. 15
ㆍReceived : Dec. 19, 2017, Revised : Feb. 15, 2018, Accepted : Apr. 15, 2018 ㆍCorresponding Author : Kang-Chul Kim
Dept. of Computer Engineering, Graduate School, Chonnam National University, Email :[email protected]
http://dx.doi.org/10.13067/JKIECS.2018.13.2.397
Ⅰ. Introduction
With the rapid and mature development of Internet technology, the network has become an indispensable part of people's learning, work and life. When users use Internet, a large number of user behavior data are generated and stored in the server every day. How to excavate the hidden value and potential benefits has become the key issue of today's Internet business research. In the big data era, data processing method become more diverse and more data values are found and exploited.
Because big data is so voluminous and complex, the traditional data processing applications are inadequate to deal with them. Big data can be analyzed for better decision-making and strategic business initiatives. Lately, big data tends to refer to the use of predictive analytics, user behavior analytics, or certain other advanced data analytics methods that extract value from data[1].
Hadoop is an open source distributed computing platform under the Apache Software Foundation.
Users can use Hadoop to organize computer resources and build their own distributed computing platform easily. And user can take full advantage of the calculation and storage capacity of the cluster to complete the massive data processing[2].
Hadoop Distributed File System (HDFS) and MapReduce framework are cores of Hadoop[2][3].
HDFS’s high fault tolerance and high scalability allow user to deploy Hadoop in inexpensive hardware. MapReduce distributed programming model allows user to develop parallel applications without knowing the underlying details of the distributed system.
Log files contain huge information about users who surf in websites and analyzing log files is the easy way to gather the user’s behavior. So many companies are focusing on analyzing the log files and many papers are represented[4-6].
By users' online activities, people can get information on sight-seeing places or cities that they want to travel. The log files in the website that users visit leave a lot of information.
NBP(next bit permutation) algorithm is proposed by Stanford University[7]. It divides inputted elements into 0 or 1 state and convenes all elements’ states to constitute a binary number. It gets results by binary addition. When an element’s state is 0, that means this element won’t exist in the new group and when state is 1 means exist.
This paper needs to use user’s search terms to assume all possibilities about user preferences.
Because this algorithm uses binary addition to get combinations of search terms so it makes sure that every search term won’t be repeated or missed.
In this paper, a customized tourist system based on Hadoop is proposed to recommend the customized cities for tourists. It analyzes log files and NBP(next bit permutation) algorithm is used to rearrange search terms extracted from log files and features of cities. 39 users’ search terms in log files are used to show the results of the proposed system.
This paper is organized as follows. Section II introduces the related works about data analysis in Hadoop. Section III describes the structure of this system. Section IV shows the system implementation and experimental results. The conclusion is described in section V.
Ⅱ. Related works
With the progress of big data, more researches on network data analysis have been doing in recent years. Tong Guoping analyzed users’ behavior from query string, query methods, statistical analysis and clustering analysis[8]. According to the users’ query string analysis, the result shows that the search engine can find more resources so people need to
use more query words to find the interested information exactly. Yiqun Liu provided a new method for analyzing enterprise user usage[9]. The authors used a statistical algorithm to process web log and made two tables for the result. One table is for real-time and other one is for day-time.
Those two tables show the different characteristic tendency changing with time. Enterprise managers can adjust their company by this results. The characteristics, channel and solution for big data enterprises is shown at [10][11]. The author compared big data with traditional data and did an experiment for extracting meaningful data from log file. Bina Kotiyal used Hadoop to classify web logs by different IP-address and time-stamp[12]. The authors run their method in different number of nodes and found optimum amount of data processing for each node. Renata used Apache Hadoop and Hadoop HDFS, Apache Flume and Apache Hive, and some other platforms to build a Hadoop ecosystem[13][14]. This Hadoop ecosystem is used to get and process data from an E-learning system named “Moodle”. The result shows the learning situation about students and teachers.
All papers above show that the Big Data processing and analysis are becoming increasingly important and also show how we can get benefit from data processing. To suggest effectively customized sight-seeing places for tourists, this paper uses Hadoop and analyzes web log files.
III. The proposed system structure
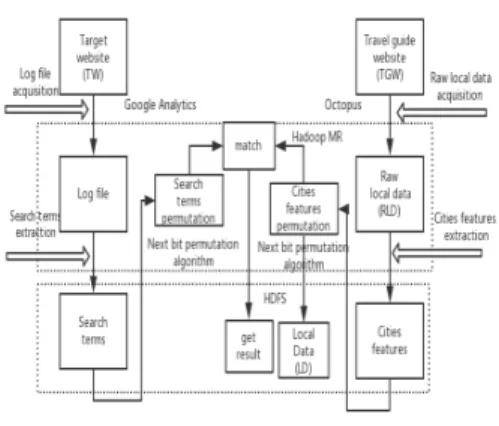
The proposed system structure is shown in Fig.1. A target website (TW) is the website that users surf to get information on the cities which they want to travel, for example, www.google.com, www.yahoo.com. A travel guide website (TGW) is the website that gives users a lot of information on sighting-seeing places, nations and etc. Log file is
produced by user in TW. The log file records the behavior of user after accessing the TW, such as the IP address, the timestamp and query etc.
Search terms are the key words that the users use to get information about the sight-seeing places in TW. Raw local data (RLD) is the description sentences that TGW shows about the sight-seeing places, cities or nations. Features are the key words that represents the sight-seeing places in TGW, and the city features are the aggregation of features in the sight-seeing places and cities.
There are seven parts in the system like Fig.1:
1) Raw local data acquisition. 2) City features extraction. 3) City features permutation. 4) Log file acquisition. 5) Search terms extraction. 6) Search terms permutation. 7) Data matching.
Octopus is a data acquisition application used to get cities description from TGW. Google Analytics[15] is a free web analytics service offered by Google that tracks and reports website usage information. The Google Analytics is used to obtain the log file in TW. Search terms in log file and the city features in RLD can be extracted in Hadoop MapReduce and stored in HDFS. The NBP is used to arrange the search terms and city features. The arranged city features are stored in HDFS as local data(LD). The search terms are used to predict the users’ preference and different tourist preferences are diverse. Each combination of search terms represents a user's preference, so the search terms should be arranged as long as high possibility. The results are used to find the customized cities for tourist in MapReduce.
1.CHINA Hong Kong: beauty; sea; mountain; flourishing strong local characteristics; art; shopping;
2.CHINA Bei Jing: history; flourishing; ancient town; petty bourgeoisie ethnic culture; strong local characteristics; art;
3.CHINA Shang Hai: history; flourishing; petty bourgeoisie; exotic culture; parent-child; art; technology;
ancient town;
… Fig. 1 System structure
Ⅳ. system implementation and experimental results
In general, most websites don’t support users’
log files, so we designed a new website to get users’ log files for experiments, the URL is www.rspt.org.cn, which is used as a target website in this paper. www.Lonelyplanet.com is one of the most famous travel guide websites[16]. It contains almost all the sight-seeing places and cities around the world. So it is used as a travel guide website in this paper.
This experiment is executed at Mac OS system and Hadoop2.7.3 is used for building single pseudo - distributed system.
4.1 RLD acquisition
Octopus is used to obtain city descriptions from Lonely Planet. After writing the URL in URL blank, Octopus shows TGW pages and we choose some contents related to the interesting things.
Octopus generates some files that have information about the interesting things and we download that files. The selected city names and city’s descriptions in Lonely Planet are shown in Fig.2.
Fig. 2 Data acquisition from TGW
4.2 City feature extraction
RLD includes a lot of descriptions about cities.
City name and the city features are extracted from RLD. There are so many features for cities in TGW, so 25 kinds of cities’ features are chosen to simplify the data processing. The 25 key words are as follows: nature, history, beauty, sea, mountain, Buddhist, catholic, Nazarene, food, country, flourishing, ancient town, petty bourgeoisie, exotic culture, ethnic culture, strong local characteristics, parent-child, romantic, alone, art, technology, adventure, shopping, animal, lakes. If some of those key words appear in a city’s description, the appeared key words are extracted and stored as the city features.
Table 1 shows the city features that we get from Lonely Planet.
Table 1. City features
adventure, alone, ancient town, beauty, 9.CHINA Zhe jiang. 10. CHINA Yun nan, 13.CHINA Chong qing
adventure, alone, ancient town, beauty, country, 10.
CHINA Yun nan
adventure, alone, ancient town, beauty, country, ethnic culture, 10. CHINA Yun nan
adventure, alone, ancient town, beauty, country, ethnic culture, food, 10. CHINA Yun nan
adventure, alone, ancient town, beauty, country, ethnic culture, food, lakes, 10. CHINA Yun nan
…
1 <script>
2 (function(i,s,o,g,r,a,m){i['GoogleAn 3 alyticsObject']=r;i[r]=i[r]||function(){
4
5 })(window,document,'script','https://
6 www.google-analytics.com/analytics.js','ga') 7 ga('create', '******(tracking ID)', 'auto');
8 ga('send', 'pageview', 'query', ' query_text ', );
</script>
4.3 City features permutation
Fig.3 shows how to arrange the features of cities. The city features are put in a MapReduce job. The function of Map is to split city names and features and use NBP to arrange city features. As a city with one feature is not enough to predict user’s preference, more than 4 features should be chosen for one city.
Fig. 3 MapReduce of arranging city features
Table 2 shows the arranged city features in experiment. The keys of key-value pairs are all possible combinations of city features and they are ordered from A to Z with at least 4 features. The 9th, 10th and 13th city have same features like adventure, alone, ancient town, beauty. The result is stored in HDFS as the LD.
Table 2. Arranged local data
3.4 Log file acquisition
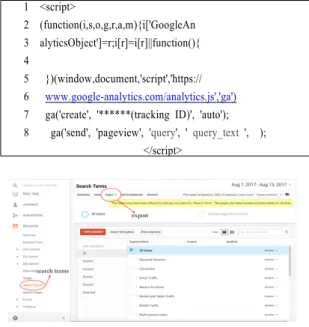
Giving the TW's name and URL, Google Analytics provides a unique track ID and a piece of JavaScript code for the TW, like Table 3. After
adding the JavaScript code to target website server, a lot of user information like the user’s ID, location and search terms are shown in Fig.4.
Table 3. JavaScript code provided by Google Analytics
Fig. 4 User behavior in Google Analytics
Google Analytics reports log file in JSON form whose format of JSON file is {name: value}, every time user opens the target website, the behaviors are recorded as an “event”. All of user’s behaviors are recorded in this event. Fig.5. shows the log file we get from Google Analytics.
Fig. 5 Log file from Google Analytics
3.5 Search terms extraction
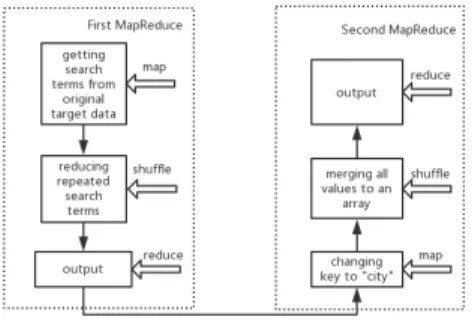
MapReduce is used twice to sort out the search terms. Fig. 6 shows the structure of those two MapReduce jobs.
Fig. 6 The process of search terms extraction
As some city features might be searched more than once, the first MapReduce is used to reduce the repeated search terms. The frequency of search terms is the key and the values are search terms.
Key-value pairs are ordered from high-search-frequency to low. The result of experiment is shown in Fig.7.
Fig. 7 Result of first MapReduce job
The result of first MapReduce job inputted to the second MapReduce job. Since all the search terms are independent keys after first MapReduce, search terms have to be a whole array for permutation and the keys should be changed to
“city” in this step. The Map changes all keys to
“city”. All search terms are merged in one value and the key is “city” after Shuffle. In order to match LD like Table 2, the key of the arranged
search terms should be the search terms’
permutations. But the key is “city”, so the key and value should be exchanged in the Reduce. Fig.8 shows the experimental result.
Fig. 8 Search terms
3.6 Search terms Permutation
The search terms are used to predict tourist’s preferences and should be arranged with high possibility. NBP is also used to arrange search terms like arranging city features in Fig.3. Fig.9 shows the process of arranging the search terms.
The key and value are split and the key is arranged by NBP in Map. The Reduce generates the result like Fig.10.
Fig. 9 The process of arranging the search terms
The keys are ordered from A to Z with at least 4 features by NBP.
Fig. 10 Arranged search terms
3.7 Data matching
The key of LD is a city’s all possible combinations of city features and the values are city names which have the same city features. Due to Shuffle’s principle, if the key of LD is the same with the arranged search terms, the key’s value is added a “city” at the end. Next step is to put LD and the arranged search terms to the Shuffle, and find that all the values have “city”. The result shows that the values with “city” are the customized cities for a tourist in Fig.11. It means CHINA Yun nan is the first customized city after analyzing user log data in this system. And then Tibet, Hu nan and so on.
Fig. 11 The system result
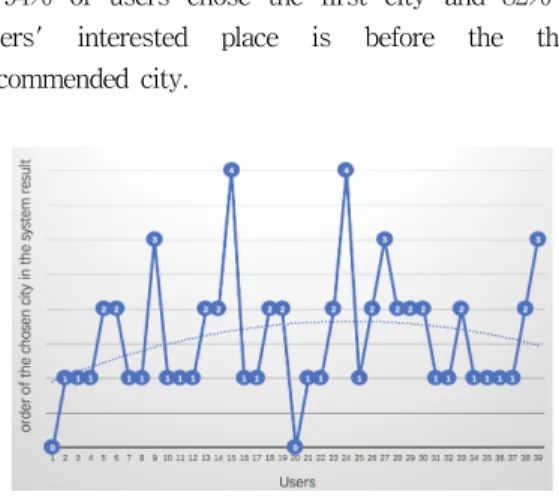
In this paper, log files of 39 users are used to show the performance of this system.
In Fig.12, the x-axis represents 39 users and the y-axis is the order of the city which users want to visit in the system result.
The result shows that 19 users chose the first city and 13 users chose the second city, and 2 uses didn't find any city in this system result.
94% of users chose the first city and 82% of users' interested place is before the third recommended city.
Fig.12 Users’ data analysis
Ⅴ. Conclusion
This paper implemented a customized tourism system on Hadoop. It includes data collection, data processing and data analysis. Local data and log file are collected from website, analyzed and stored in Hadoop. Hadoop MapReduce framework and next bit permutation algorithm are used to process log file for speculating the user preferences. The paper used 39 users' log file to test the reliability of our system and the result shows this system is reliable. In the future, this system will be implemented on Hadoop cluster and more researches will be done for industrial applications.
References
[1] V. Mayer-Schonberger, K. Cukier, Big data : a revolution that will transform how we live, work, and think, New York: John Murray 2013.
[2] T. White, Hadoop - The Definitive Guide:
Storage and Analysis at Internet Scale (2. ed.), San Diego California: DBLP 2011.
[3] D. Miner, A. Shook, MapReduce Design Patterns: Building Effective Algorithms and Analytics for Hadoop and Other Systems, California: O'Reilly Media 2012.
[4] Y. Chen, C. Yang, Y. Liau, C. Chang, P.
Chen, and P. Cang. “User behavior analysis and commodity recommendation for point-earning apps,” IEEE Technologies and Applications of Artificial Intelligence 2017, pp.170-177.
[5] H. Hingave and R. Ingle, “An approach for MapReduce based log analysis using Hadoop,” IEEE Int. Conf. on Electronics and Communication Systems 2015, pp.1264-1268.
[6] Y. Peng and K. Yu, “User behavior analysis of automobile websites based on distributed computing and sequential pattern mining,”
IEEE Int. Conf. on Network Infrastructure and
Digital Content, 2017.
[7] NextBitPermutation:
graphics.stanford.edu/~seander/bithacks.html
#NextBit Permutation
[8] T. Guoping and J. Sun, “User Behavior Analysis Based on Search Engine Log,” New Technology of Library & Information Service China, 2015.
[9] Y. Liu, J. Miao, M. Zhang, S. Ma, and L. Ru,
“How do users describe their information need: query recommendation based on snippet click model,” Expert Systems with Applications vol. 38, 2011, pp.13847-13856.
[10] G. He, S. Ren, D. Yu, and X. Wu, “Analysis of Enterprise User Behavior on Hadoop”, IEEE Int. Conf. on Intelligent Human-Machine Systems & Cybernetics Vol. 2, 2014, pp.230-233.
[11] K. Young-geun, K. Won-jung, K. Seung-Hyun,
“The Design of Method for Efficient Processing of Small Files in the Distributed System based on Hadoop Framework,” The Journal of The Korea Institute of Electronic Communication Sciences 2015, vol.10, no.10, pp.1115-1122.
[12] B. Kotiyal, A. Kumar, B. Pant, and R.
Houdar, “Big data: Mining of log file through hadoop,” IEEE Int. Conf. on Human Computer Interactions, 2014, pp.1-7.
[13] S. K. Dewangan, S. Pandey, and T. Verma,
“A distributed framework for event log analysis using MapReduce,” IEEE Int. Conf.
on Advanced Communication Control and Computing Technologies 2017, pp.503-506.
[14] K. Seung-Hyun, K. Won-jung, K. Young-geun, and J. min-hui, “Learning System for Big Data Analysis based on the Raspberry Pi Board,” The Journal of The Korea Institute of Electronic Communication Sciences 2014, vol.9, no.7, pp.791~797.
[15] Alexa L. Mokalis, Joel J. Davis, Google Analytics Demystified (4th Edition), Swedish:
Engelska 2018.
[16] China Williams, G. Bloom,Lonely Planet Southeast Asia on a Shoestring, Australia:
Lonely Planet, 2014.
저자 소개
Ya-Ding
2012년 9월 ~ Beijing Institute of Pe trochemical Technology University, 졸업(공학사)
2016년 9월 ~ 전남대학교 대학원 컴퓨터학과 석사과정
※ 관심분야 : Hadoop, Big data, Data analysis
김강철(Kang-Chul Kim) 1981년 서강대학교 전자공학과 학사 1983년 서강대학교 전자공학과 석사 1996년 경상대학교 전자공학과 박사 현재 전남대학교 전기전자통신컴퓨터공학부 교수
※ 관심분야 : 임베디드시스템, NoC, IoT Pattern Recognition