Imaging-Based Tumor Treatment Response Evaluation: Review of Conventional, New, and Emerging Concepts
20
0
0
전체 글
(2) Kang et al.. Table 1. Summary of Major Changes from WHO to RECIST 1.1 Guidelines WHO RECIST 1.0 Lesion measurement No particular mention CT, MRI and chest radiography Imaging modality of imaging modality are recommended modalities Definition of No limitation on minimal CT: 10 mm spiral, 20 mm measurable lesions size of the lesion non-spiral Clinical: 20 mm. Lymph node. Method of measurement No. lesions to be measured Response evaluation Complete Response (CR). Partial Response (PR). Stable Disease (SD). Progressive Disease (PD). Not mentioned Cross-product of the longest diameter and the greatest perpendicular diameter No particular no. lesions specified Disappearance of all lesions ≥ 50% decrease in the sum of the area (longest diameters multiplied by longest perpendicular diameters) Neither PR nor PD ≥ 25% increase in the sum of the area. Not mentioned. RECIST 1.1 Update with detailed guidance on use of MRI, PET/CT CT: 10 mm; delete reference to spiral scan Clinical: 10 mm (must be measurable with calipers) CT: ≥ 15 mm short axis for target ≥ 10 - < 15 mm for non-target < 10 mm is non-pathological. Longest diameter in the axial plane. Longest diameter in the axial plane. 10 lesions (5 per organ). 5 lesions (2 per organ). Disappearance of all lesions. Disappearance of all lesions and pathologic lymph nodes. ≥ 30% decrease in the sum of the longest diameter. ≥ 30% decrease in the sum of the longest diameter. Neither PR nor PD. Neither PR nor PD ≥ 20% increase smallest sum on study (including baseline if that is smallest) and at least 5 mm increase or new lesions. ≥ 20% increase smallest sum on study or new lesions. RECIST = Response Evaluation Criteria in Solid Tumor, WHO = World Health Organization, CT = computed tomography, MRI = magnetic resonance imaging, PET = positron emission tomography. in existing lesions or the development of new lesions. However, there are limitations in the evaluation of tumor response when employing conventional response criteria alone. In this new era of molecular-targeted therapy for cancer treatment, the need for more accurate and earlier response-assessment methods is increasing. In this review, the authors briefly review the currently used tumor response evaluation criteria, morphologic changes occurring after target therapy that are not considered under the current criteria, current issues, and new concepts in the evaluation of tumor response in the era of personalized medicine (targeted chemotherapy).. 372. Anatomic or Morphological Approaches A variety of new morphological approaches to assess tumor response to anti-tumor treatments have been introduced since the traditional methods of measuring tumor size were developed in the 1980s and 1990s largely for those who undergo cytotoxic chemotherapy. Tumor Size Measurement In 1979, the World Health Organization (WHO) established the first standardized approach in order to classify treatment responses of solid tumors, based on imaging studies. WHO categorized responses as complete Korean J Radiol 13(4), Jul/Aug 2012. kjronline.org.
(3) Tumor Response Evaluation. response (CR), partial response (PR), stable disease (SD), and progressive disease (PD). According to the WHO evaluation scheme, individual tumor size is determined by bidimensional measurements of tumor size in the axial plane (3). However, some problems have emerged while using the WHO criteria: 1) the methods for integrating changes in evaluable lesions into response assessments, as defined by the WHO criteria, vary among research groups, 2) the minimum lesion size and number of lesions to be recorded also vary, 3) definitions of PD are related to change in a single lesion by some and to a change in the overall tumor load (sum of the measurements of all lesions) by others, and 4) the arrival of new technologies has led to some confusion about how to integrate three-dimensional measures into response assessments. Response Evaluation Criteria in Solid Tumor guidelines were published in 2000 by a task force that comprised the European Organization for Research and Treatment in Oncology, the National Cancer Institute of the United States, and the National Cancer Institute of Canada. The RECIST guidelines defined the minimum size of measurable lesions, the number of lesions to follow, the imaging technique to be used, and the needs for uni-dimensional rather than bi-dimensional measurements for the evaluation of tumor burden (4). However, a number of questions and issues have arisen which have led to the development of a revised RECIST guideline (version 1.1) (5, 6). Major changes from the WHO criteria to RECIST version 1.1 are summarized in Table 1. Since the publication of the RECIST criteria, several reports have been published regarding the low reliability of RECIST criteria in evaluating response in different types of tumors, such as prostate cancer (7), malignant pleural mesothelioma (MPM) (8-10), soft tissue sarcoma (11), neuroendocrine tumors (12), and disseminated pediatric malignancy (13). The WHO criteria and RECIST are mainly focused on the evaluation of anatomic tumor responses, and thus clinically meaningful responses may be underestimated because new targeted therapies can cause tumor necrosis without marked tumor size reduction. Tumor Enhancement/Attenuation Evaluation In 2000, the European Association for the Study of the Liver agreed that estimating the reduction in viable tumor volume (recognized as non-enhanced areas using dynamic CT or magnetic resonance imaging [MRI]) should be considered the optimal method for assessing the local kjronline.org. Korean J Radiol 13(4), Jul/Aug 2012. response to treatment in patients with hepatocellular carcinoma (HCC) (14). Therefore, most authors reported on response to locoregional therapy such as arterial chemoembolization or radiofrequency ablation for HCC evaluated tumor response according to this recommendation (15-18). Riaz et al. (19) have shown good correlation between tumor enhancement characteristics and degree of HCC necrosis after radioembolization using yttrium-90 at explants. Thin rim enhancement with a lack of central enhancement on enhanced scans after treatment of the tumor was an imaging characteristic that correlated well with complete pathologic necrosis. Forner et al. (20) addressed that, when applying RECIST criteria, CRs obtained by tumor necrosis are missed and the extent of partial tumor response is underestimated because of attendant tissue necrosis particularly in patients who received percutaneous ablation. Gastrointestinal stromal tumor (GIST) is the mesenchymal neoplasm of the gastrointestinal tract expressing the c-kit receptor tyrosin kinase which is treated with imatinib mesylate (Gleevec; Novartis, Basel, Switzerland), a tyrosine kinase inhibitor (TKI) (21). In initial tumor response to imatinib in patients with malignant GISTs, dramatic changes were noted in tumor attenuation values, in the extent of enhancing intratumoral nodules, and in the extent of tumor vessels (22) (Fig. 1). RECIST underestimated the effect of imatinib on metastatic GISTs especially at this early stage of treatment, and was a poor predictor of clinical benefit. According to the Choi criteria (Table 2), a decrease in tumor size of more than 10% or a decrease in tumor attenuation of more than 15% on CT correlates well with good response by 18 F-fluorodeoxyglucose (FDG) positron emission tomography (PET) (23) and shows excellent prognostic value (24). Similarly, Chun et al. (25) reported that the morphological change of a colorectal liver metastasis after bevacizumab treatment from a heterogeneously enhancing mass with ill-defined margins to a well-circumscribed homogenously hypoattenuating appearance correlated well with pathologic response and patient survival, whereas RECIST did not correlate with patient survival. Also, in metastatic renal cell carcinoma (RCC) patients treated with sunitinib, the Choi criteria were helpful to define early metastatic RCC patients who benefit from sunitinib therapy (26). According to RECIST, seven patients had PR, 38 SD, and 10 PD, whereas according to Choi criteria 36 patients had PR, 6 SD, and 13 PD. In patients with PR, Choi criteria had a significantly better predictive 373.
(4) Kang et al.. value for progression-free survival and overall survival than RECIST. Other response criteria such as size and attenuation CT (SACT) (27) or morphology, attenuation, size and structure (MASS) criteria (28) are more accurate than response assessment by RECIST in the assessment of metastatic RCC. Anti-angiogenic agents sometimes cause intratumoral hemorrhage, necrosis, or cavitation which usually represents a good response to the agents and may actually lead subsequently to the inhibition of tumor growth (29). Among these responses, intratumoral hemorrhage may require particular caution as it might cause error in interpreting. the treatment response according to tumor attenuation change. High CT attenuation from acute hemorrhage may be confused with an enhancing solid component or may mask the decreased tumor enhancement due to treatment if unenhanced images are not available. Intratumoral hemorrhage may also cause overestimation of tumor size and, thus, may lead to a misinterpretation of SD or PR as PD with the traditional tumor size-based response criteria (Fig. 2). Tumor Texture Evaluation Computed tomography texture analysis is an image processing algorithm that can be used to quantify tissue. A B Fig. 1. Patient with recurrent malignant gastrointestinal stromal tumor and multiple metastases.. A. Contrast-enhancement axial CT scan in portal phase shows 25-mm-sized enhancing metastatic nodule in left hepatic lobe (arrow) and its mean CT number was measured 67 HU. B. Contrast-enhancement axial CT in portal phase scan obtained after chemotherapy shows metastatic nodule has not significantly decreased in size (25 mm in diameter) but demonstrates markedly decreased attenuation (34 HU) (arrow), suggesting tumor response.. Table 2. Choi Response Criteria (23) Response Definition Disappearance of all lesions CR No new lesions A decrease in size ≥ 10% or a decrease in tumor attenuation (HU) ≥ 15% on CT PR No new lesions No obvious progression of non-measurable disease Does not meet criteria for Cr, PR or PD SD No symptomatic deterioration attributed to tumor progression An increase in tumor size ≥ 10% and does not meet criteria of PR by tumor attenuation on CT PD New lesions New intratumoral nodules or increase in the size of the existing intratumoral nodules Note.— CR = complete response, PR = partial response, SD = stable disease, PD = progressive disease. 374. Korean J Radiol 13(4), Jul/Aug 2012. kjronline.org.
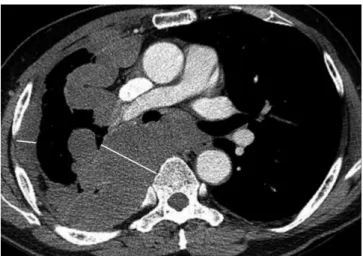
(5) Tumor Response Evaluation. heterogeneity by assessing the distribution of texture coarseness and irregularity within a lesion. Goh et al. (30) found that CT texture analysis was an independent factor associated with time to progression and had potential as a predictive imaging biomarker after the treatment of metastatic RCC with TKIs. Heterogeneity at relevant scales could be quantified by using a range of parameters including entropy and uniformity. Entropy is a measure of texture irregularity while uniformity reflects the distribution of gray. A. B. levels within the tumor: higher entropy and lower uniformity represent increased tumor heterogeneity. Tumor entropy decreased by 3-45% and uniformity increased by 5-21% for the different scale values after administration of a TKI. Much of the heterogeneity visible at CT represents photon noise, which can mask any underlying biologic heterogeneity. By using filters that select for image features at larger scales, CT texture analysis can be used to reduce the effect of photon noise while enhancing biologic heterogeneity.. C. Fig. 2. Patient with non-small cell lung cancer.. A. Pre-treatment contrast enhancement CT scan shows 41-mm-sized homogeneous enhancing mass (arrow) and malignant effusion in right pleural space. B. Post-treatment CT scan shows mass was not significantly changed in diameter (41 mm in diameter) but demonstrates heterogeneously decreased attenuation within tumor on contrast enhancement CT. This area shows increased attenuation of 54 HU (arrowheads) on non-contrast CT, suggesting internal hemorrhage. C. Mass has shrunk (17 mm in diameter) and demonstrates internal cavity formation, suggesting tumor necrosis on follow-up CT scan obtained after additional 2 cycles of target therapy.. A B Fig. 3. Patient with epidermal growth factor receptor mutation positive lung adenocarcinoma (exon 19 microdeletion).. A. Pretreatment CT scan on lung window image shows 11-mm and 8-mm-sized predominant solid nodules (arrows). B. CT scans obtained after 2 cycles of gene target therapy with Gefitinib (Irresa) shows that only ground-glass opacity components of lesions remain without significant change of diameter (arrowheads).. kjronline.org. Korean J Radiol 13(4), Jul/Aug 2012. 375.
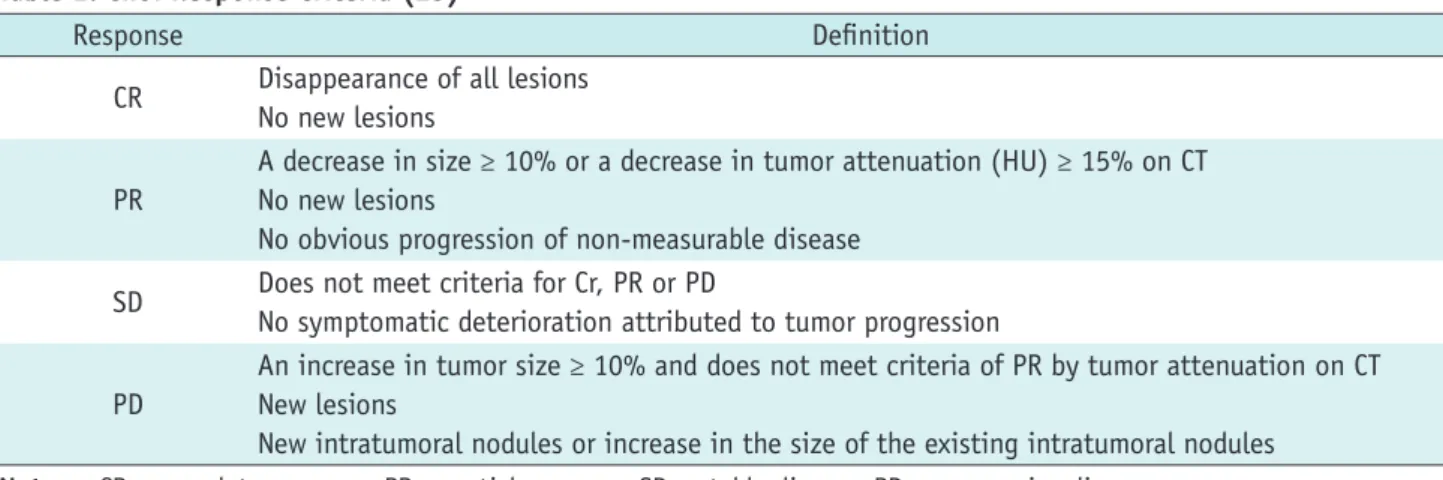
(6) Kang et al.. Special Considerations in Lung Cancer Conventionally, lung cancer size is generally measured on lung window images and includes both ground-glass opacity (GGO) areas and solid components in case of a part-solid nodule. However, the spatial extent of GGO within part-solid lung cancer generally does not vary profoundly (albeit the density may change) with anti-cancer treatments, demonstrating no remarkable size decrease even after effective chemotherapy (Fig. 3). Therefore, size change in only the solid component of a part-solid peripheral lung cancer, excluding the GGO area, may be a more accurate reflection of the actual tumor response to cancer chemotherapy. In addition, cavitation within a tumor caused by hampered angiogenesis and resultant tumor necrosis may constitute a type of tumor response (Fig. 4). Lee et al. (31, 32) proposed that novel CT response criteria devised in consideration of tumor constituents (solid and GGO components), the presence of cavitation and attenuation changes within a target lesion can be used for response evaluation in non-small cell lung cancer (NSCLC) patients who underwent epidermal growth factor receptor (EGFR) TKI therapy (Fig. 5) because the criteria reflecting additional morphological characteristics of target lesions are. A Fig. 4. Patient with non-small cell lung cancer.. reproducible and have a statistically significant association with patient overall survival. Special Considerations in Bone Metastasis Bone is one of the most common organs of metastatic. RECIST measurement = x Lee’s measurement = y - z. Fig. 5. Diagram depicting target lesion measurement by RECIST method and new response criteria (31). According to RECIST measurement, size of target lesion is measured by including both solid and ground-glass opacity components (x). According to our measurement, size of target lesion is measured by including solid component alone and by assessing size on mediastinal window images (y). If target lesion has internal cavitation, size of lesion is measured by including only soft-tissue wall thickness component and by excluding air component of cavity (subtraction of cavity diameter from longest diameter of cancer mass) (y - z). RECIST = Response Evaluation Criteria in Solid Tumor. B. Axial CT scans on lung window images before (A) and after (B) chemotherapy show internal cavity formation (arrow) due to necrosis of tumor.. 376. Korean J Radiol 13(4), Jul/Aug 2012. kjronline.org.
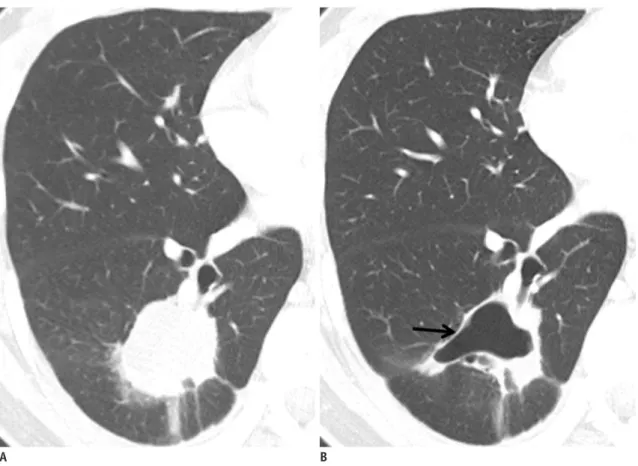
(7) Tumor Response Evaluation. tumor spread in patients with breast or prostate cancer. Standard treatments for bone metastasis are anticancer agents such as chemotherapy and endocrine therapy. Imaging modalities such as radiography, skeletal scintigraphy (SS), CT and MRI, and PET can be used to assess the response of bone lesions to treatment. Accurate response assessment of bone metastases to treatment requires visualizing not only the tumor burden but also structural changes in the bone (Fig. 6). Hamaoka et al. (33) reported that the MDA criteria (University of Texas MD Anderson Cancer Center) (Table 3), which incorporate information obtained from CT scans into that of the WHO criteria (based primarily on SS), are superior to the WHO criteria for predicting progression free survival in patients with bone-only metastatic breast cancer who respond to treatment. The lower correlation between the primarily SSbased WHO criteria and the treatment response of bone. metastasis might be a result of several factors including the high false positive rates of SS caused by conditions other than tumors such as fracture, arthritis, infection or ‘flare’ phenomena. With SS, which reflects osteoblastic activity, it can also take six months or longer to reliably detect a response because of the confounding effect of the flare phenomenon, a spurious increase in radionuclide uptake because of reparative mineralization around healing metastases (34). On the other hands, Imbriaco et al. (35) reported that changes in bone scan index (BSI, estimating the fraction of the skeleton that is involved by tumor as well as the regional distribution of the metastases in the bones) are a response indicator in androgen-independent prostate cancer. The usefulness of assessing BSI changes on serial SS as a promising response evaluation tool was further supported by the study of Dennis et al. (36) who demonstrated that. A. B Fig. 6. Patient with breast cancer and bone metastasis.. A. CT scans at baseline show partial osteolytic metastases (arrow) in thoracic vertebrae. B. After chemotherapy, osseous lesions have not changed in size, but show osteoblastic reaction (arrows in B), representing good response.. kjronline.org. Korean J Radiol 13(4), Jul/Aug 2012. 377.
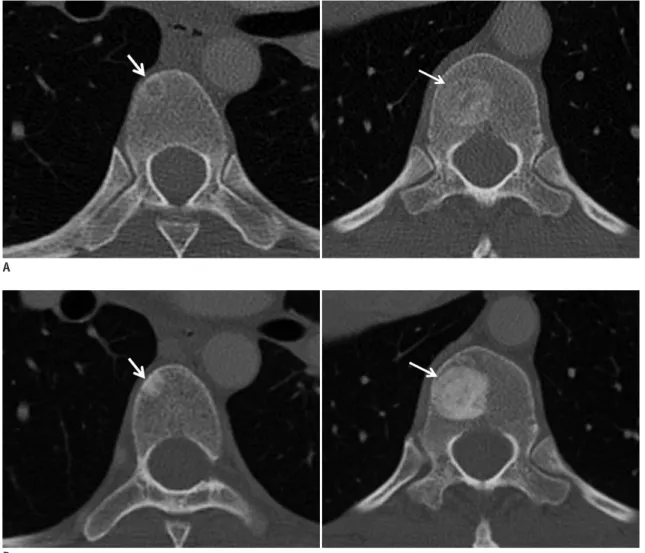
(8) Kang et al.. Table 3. WHO and MDA Criteria to Determine Treatment Response of Bone Metastasis (33) Response Type WHO MDA Target diagnostic imaging XR, SS XR, SS, CT, MRI Complete disappearance Complete fill-in or sclerosis of lytic lesion on XR and CT Complete response of all lesions on X-ray or Disappearance of hot spots or tumor signal on SS, CT or MRI scan for at least 4 wks Normalisation of osteoblastic lesion on XR and CT Partial decrease in size of Sclerotic rim about initially lytic lesion or sclerosis of lesions lytic lesions, recalcification previously undetected on XR or CT Partial response of lytic lesions or decreased Partial fill-in or sclerosis of lytic lesion on CR or CT density of blastic lesions Regression of lesion on SS (exclude rapid regression) for at least 4 wks Decrease in blastic lesion on XR or CT As a result of the slow response of bone lesions, the classification of ‘no No change in measurable lesion on XR, CT or MRI No change or change’ should not be No change in blastic lesion on XR, CT, or MRI stable disease applied until at least No new lesion on XR, SS, CT or MRI 8 wks have passed from start of therapy Increase in size of any existing measurable lesions on XR, CT or MRI Increase in size of existing New lesion on XR, SS (excluding flare phenomena), CT, or MRI Progressive disease lesions or appearance Increase in activity on SS (Excluding flare phenomena) or of new lesions blastic/lytic lesion on XR or CT Note.— WHO = World Health Organization, XR = radiography, SS = skeletal scintigraphy, CT = computed tomography, MRI = magnetic resonance imaging. on-treatment changes in BSI on serial SS are a response indicator in patients who were in treatment for castrationresistant metastatic prostate cancer.. Metabolic, Functional, and Other Nonanatomical Approaches New functional and metabolic imaging techniques that have the capability to integrate pathological, physiological and morphological changes render a substantial potential as early predictors of therapeutic response. They provide the ability to detect microscopic changes in tumor microenvironment and tissue cytoarchitecture; thus, allowing earlier assessment of therapy response by observing alterations in perfusion, oxygenation and metabolism. Metabolic Imaging Anatomic imaging alone has limitations, particularly in assessing the activity of newer cancer drugs that stabilize disease rather than reduce tumor size, whereas 18F-FDG PET appears particularly valuable in such cases (Fig. 7). PET has the ability to assess tissue metabolism by using 378. radiolabelled molecules, most commonly 18F-FDG, a glucose analogue. 18F-FDG PET shows increased glucose uptake in metabolically active cells (and thus in a metabolically active tissue) and is most commonly used to measure glucose metabolism or tumor growth in oncology. The standardized uptake value (SUV) represents a quantitative assessment of uptake in a tumor region of interest. 18F-FDG PET-CT has been shown to be of value in the differentiation of benign and malignant tissues, preoperative staging, recurrent disease detection, and more recently in the identification of early tumor response to therapy. Wahl et al. (37) proposed guidelines for the standardization of response criteria for FDG PET, the so-called PET Response Criteria in Solid Tumors (PERCIST). 18 F-fluorodeoxyglucose positron emission tomographycomputed tomography is particularly useful for tumor response evaluation in patients with MPM. In cases of MPM, the limitation of conventional imaging techniques such as CT and MRI in treatment response evaluation is well recognized (38). The imaging findings of MPM are diffuse, diverse, and difficult to differentiate from benign lesion findings. Since the pleura is not a solid organ and the pleural lining has a complex shape, CT and MR may have Korean J Radiol 13(4), Jul/Aug 2012. kjronline.org.
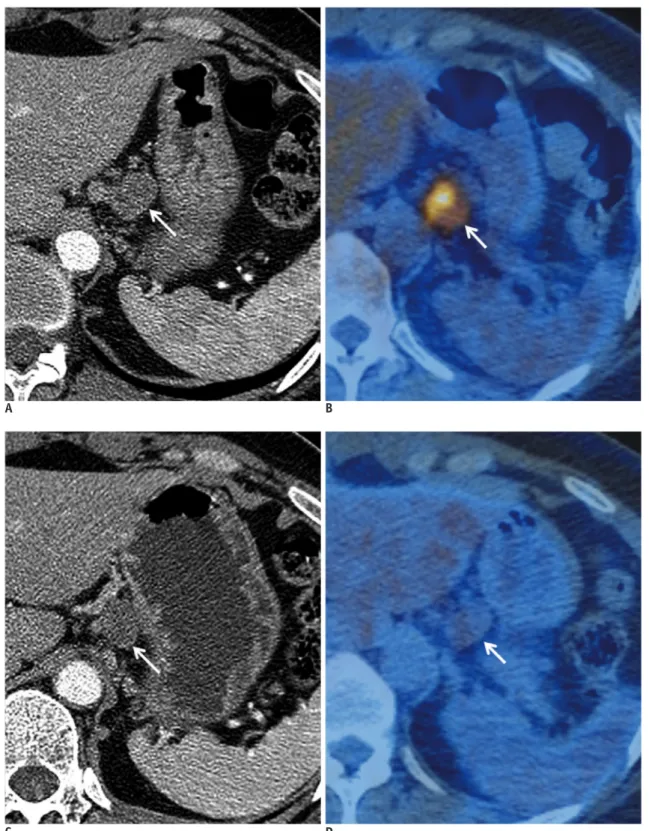
(9) Tumor Response Evaluation. disadvantages in depicting tumors and in differentiating tumors from adjacent pleural effusion or atelectatic lungs. In determining patient prognosis and response after. therapy, the true tumor volume of MPM appears to be a critical factor (39). A measurement protocol specified as ‘‘modified RECIST’’ (9), with tumor thickness measurement. A. B. C. D. Fig. 7. 44-year-old woman with esophageal cancer and multiple metastases.. Contrast-enhancement CT (A) and PET-CT (B) images obtained before chemotherapy show perigastric metastatic lymph node (white arrow) which was measured about 2 cm in diameter and shows intense FDG activity. Images obtained after treatment show lymph node was not changed in diameter (C) but SUVmax was markedly decreased from 8 to 1.9 on PET-CT (D). PET = positron emission tomography, FDG = fluorodeoxyglucose, SUVmax = maximum standardized uptake value. kjronline.org. Korean J Radiol 13(4), Jul/Aug 2012. 379.
(10) Kang et al.. taken perpendicularly to the chest wall or mediastinum, has become a standard protocol (Fig. 8). As for the objective measurement of MPM tumor response to a therapy, there. have been a few recent trials using semi-automated methods developed by processing CT or MRI datasets and by quantifying MPM tumor thickness (9). However, the use of modified RECIST protocol (both manual and semiautomated methods) did not prove to substantially alter response evaluation efficiency (9). Recently, emphasis is given to the importance of volume-based parameters such as metabolic tumor volume and total lesion glycolysis evaluated at 18F-FDG PET-CT imaging in the prediction of patient prognosis and response to surgery or chemotherapy (40). Owing to difficulties in the radiologic assessment of tumor burden by using CT or MRI alone, the use of 18FDG PET-CT for the prediction of patient outcome appears to be promising (Fig. 9). The SUV can also represent a quantitative assessment of uptake in a tumor and is based on a ratio between tracer uptake within a tumor and homogeneous distribution of tracer within the patient body. In patients with NSCLC, 18 F-FDG PET has been recognized as an adequate staging tool (41, 42), and several studies also suggest that measuring SUVs before and after treatment is related to a prognostic value in patients with NSCLC (43, 44).. Fig. 8. This figure shows how tumor thickness is measured according to modified RECIST, which has become standard protocol in mesothelioma tumor burden assessment. In this protocol, tumor thickness is measured perpendicularly to chest wall or mediastinum, not measuring tumor longest diameter. Sum of six measurement values from two different positions (white straight bars) at three different levels is used as “modified RECIST”. RECIST = Response Evaluation Criteria in Solid Tumor. A. B. Fig. 9. Malignant pleural mesothelioma of epithelioid subtype in 57-year-old man.. A. Non-contrast axial CT scan obtained at level of aortic arch shows thickened (arrows) mediastinal and parietal pleurae. B. Co-registered PET-CT image shows how we measure metabolic tumor volume. Automatic VOIs with isocontour threshold method are placed over primary tumor. Segmented VOIs (arrows) are shown on axial PET-CT fusion image. SUVmax, SUVavg, and MTV are measured as 14.6, 4, and 508 mL, respectively. TLG were calculated as 2032 SUV·mL. VOI = volume of interest, SUVmax = maximum standardized uptake value, SUVavg = average standardized uptake value, MTV = metabolic tumor volume, total lesion glycolysis (TLG) = SUVavg x MTV. 380. Korean J Radiol 13(4), Jul/Aug 2012. kjronline.org.
(11) Tumor Response Evaluation. Additionally, 18F-FDG PET has been shown to help predict response early during the course of chemotherapy (4547) and molecular-targeted agent therapy such as EGFRTKIs including erlotinib and gefitinib (48-50). However, interpretation of SUV changes is not straightforward because many factors may affect the values. For example, a reliable drop in SUVs indicating a tumor response is seen only in patients with high initial SUVs (51). Similarly, reduction in PET metabolism as a result of chemotherapy may be dependent, at least in part, on pre-therapy vascular delivery. A relationship was demonstrated between the vascular and metabolic characteristics of primary breast tumors, showing that any assessment of tumor metabolic activity using 18F-FDG PET may be controlled at least in part by delivery of uptake agent due to the vascular characteristics of the tumor (52, 53). Angiogenic Imaging Dynamic contrast enhancement (DCE) CT techniques (also known as CT perfusion, CTP) are attractive for clinical practice (54). The techniques enable the analysis of the temporal changes of tumor and vessel attenuation after the intravenous administration of conventional iodinated contrast agents, and the quantification of regional tumor blood flow, regional tumor blood volume, blood flow-extraction product, and permeability-surface area product through standard kinetic models. Several studies have demonstrated changes in CTP parameters in response to different kinds of cancer treatment including targeted agents, standard chemotherapy and radiotherapy. Jiang et al. (55) suggested that CTP is a more sensitive image biomarker in advanced HCC patients treated with a combination of anti-angiogenic (bevacizumab) and conventional chemo- (gemcitabine and oxaliplatin) therapies for monitoring early anti-angiogenic treatment effects as well as for predicting outcome at the end of treatment and progression-free survival compared to RECIST and tumor attenuation. As CT technology has reached maturity, further consideration may be given to the direction of CT perfusion research. Reiner et al. (56) proposed that CTP imaging using dynamic 4D-spiral scanning with variable pitch is feasible and delivers information on the reliable qualitative and quantitative analysis of normal renal cortex and RCC perfusion. Dynamic contrast enhancement-magnetic resonance imaging (DCE-MRI) also has the ability to yield detailed insight into underlying tumor angiogenesis by way of kjronline.org. Korean J Radiol 13(4), Jul/Aug 2012. parameters relating to tumor perfusion and permeability, which can be analyzed by the continuous acquisition of MR images before and after the intravenous injection of a contrast agent (57). The parameters extracted provide information on blood flow, blood volume, microvessel permeability, extraction fraction and on plasma and interstitial volumes. Pharmacokinetic analysis of DCEMRI is the most widely used method for measuring vessel permeability changes, analyses typically being derived from variations of the Tofts’ two-compartment kinetic model which in turn has its roots in Kety’s dynamic model. In this model, an injected contrast agent leaks into the extravascular-extracellular space (EES), and the assessment of tissue perfusion and permeability can be derived from the shapes of observed wash-in and wash-out curves. The volume transfer constant Ktrans (often called washin rate; unit: min-1) describes the forward leakage rate of the contrast medium. For blood vessels where leakage is rapid (that is when extraction fraction during the first pass of contrast agent is high, as typically found in tumors), perfusion determines the contrast agent distribution and Ktrans approximates to tissue blood flow per unit volume (58). Under flow-limited conditions, Ktrans equals the blood plasma flow per unit volume of tissue; under permeabilitylimited conditions, Ktrans equals the permeability surface area product per unit volume of tissue (58). Dynamic contrast enhancement-magnetic resonance imaging has been investigated in various studies including bladder and breast cancers and bone sarcomas as an early indicator of tumor response to therapy (59-62) (Fig. 10). In breast cancer, it has been shown repeatedly that progressive decreases in tumor Ktrans accompany response to chemotherapy and that an increase or absence of change in permeability helps predict non-responsiveness (61, 62). Thus, DCE-MRI remains a promising biomarker for assessing tumor angiogenesis and the effect of anti-angiogenic therapy (63, 64). Liu et al. (65) investigated DCE-MRI as a biomarker in a phase 1 study of axitinib (AG013736), a TKI, involving 26 patients with advanced solid tumors in the liver, lungs and other sites. A linear correlation was found in which the percentage change from baseline to day two in Ktrans and initial area under the curve was inversely proportional to axitinib plasma exposure levels (achieved with various doses, schedules, and administration states). Wedam et al. (66) used a two-compartment pharmacokinetic analysis to measure several DCE-MRI parameters in a pilot study enrolling patients with breast cancer treated with 381.
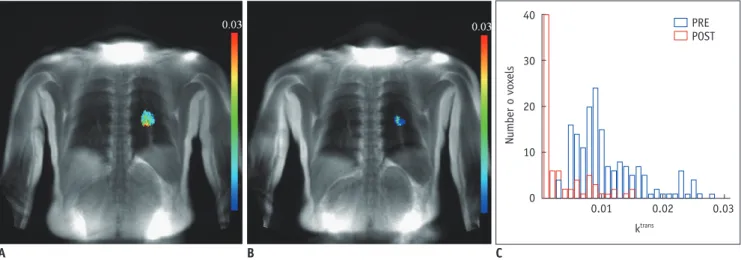
(12) Kang et al.. Number o voxels. 40. PRE POST. 30. 20. 10. 0. 0.01. 0.02. 0.03. ktrans. A B Fig. 10. Patient with non-small cell lung cancer.. C. A. DCE MR-derived Ktrans map before chemotherapy shows 26-mm-sized primary tumor colored in left upper lobe. B. Ktrans map after first-cycle of chemotherapy shows decrease in size (12 mm) and reduction in perfusion. C. Combined Ktrans histograms representing tumor perfusion before (blue) and after (red) first cycle of chemotherapy show modified perfusion distribution toward lower perfusion values. DCE = dynamic contrast enhancement. anti-VEGF agent bevacizumab, alone for one cycle and followed by six cycles of bevacizumab in combination with doxorubicin and docetaxel. While there were no significant changes in microvessel density or vascular endothelial growth factor-A expression, all parameters reflecting reduced angiogenesis (DCE-MRI, studied at baseline and after cycles 1, 4, and 7) showed a significant decrease after treatment with bevacizumab (after cycle 1). The decrease continued with the addition of cytotoxic chemotherapy. A greater change was observed from cycle one to cycle 4 than from cycle 4 to cycle 7, implying that the overall tumor rate of change in treatment effect occurred in the earlier course of therapy Dual-Energy CT Estimating the net enhancement of a tumor is crucial for the accurate evaluation of tumor response. In order to calculate net tumor enhancement, both enhanced and nonenhanced scans need to be acquired. However, to obtain both the scans as a routine protocol is worrisome because of the large patient radiation dose. Recent dual-energy CT (DECT) technique enables one to differentiate iodine substance from other materials by the principle of material decomposition (67). The iodine component of lung nodules can be measured on iodine-enhanced images at DECT and this is comparable to the real value (net enhancement) of the extent of net enhancement. Schmid-Bindert et al. (68) suggested that DECT could be a useful functional imaging test for patients with NSCLC because the technique provides information on tumor angiogenesis and its relationship 382. with tumor metabolism by showing a close correlation between the maximum iodine-related attenuation at DECT and SUVmax on 18F-FDG PET-CT. According to Kim et al. (69), DECT may serve as a useful tool for response evaluation after anti-angiogenic treatment in NSCLC patients by rendering information on the net enhancement of target lesions without the need to obtain nonenhanced images. Diffusion-Weighted MRI Diffusion-weighted MRI (DWI) allows the analysis of tissue characteristics based on the diffusivity of water molecules within tissue. Water diffusion in tissue reflects the tortuosity of the extracellular space, tissue cellularity, integrity of cell membranes and fluid viscosity. DWI exploits the microscopic random mobility of water protons and helps the characterization of lesions because the Brownian motion of water molecules causes phase dispersion resulting in attenuation of the measured signal intensity on DWI. When used in conjunction with apparent diffusion coefficient (ADC) mapping, DWI provides information about the functional environment of water in tissues, augmenting the morphologic information provided by conventional MRI. Restriction in the diffusion of water molecules is directly proportional to the degree of cellularity of the tissue. This restricted diffusion is observed primarily in malignancies, hypercellular metastases, and fibrosis, where a greater number of cells with intact cell walls were contained than in healthy tissues (70, 71). After successful anticancer treatment, decreases in tumor cell density due to necrosis and apoptosis cause substantial increases in water Korean J Radiol 13(4), Jul/Aug 2012. kjronline.org.
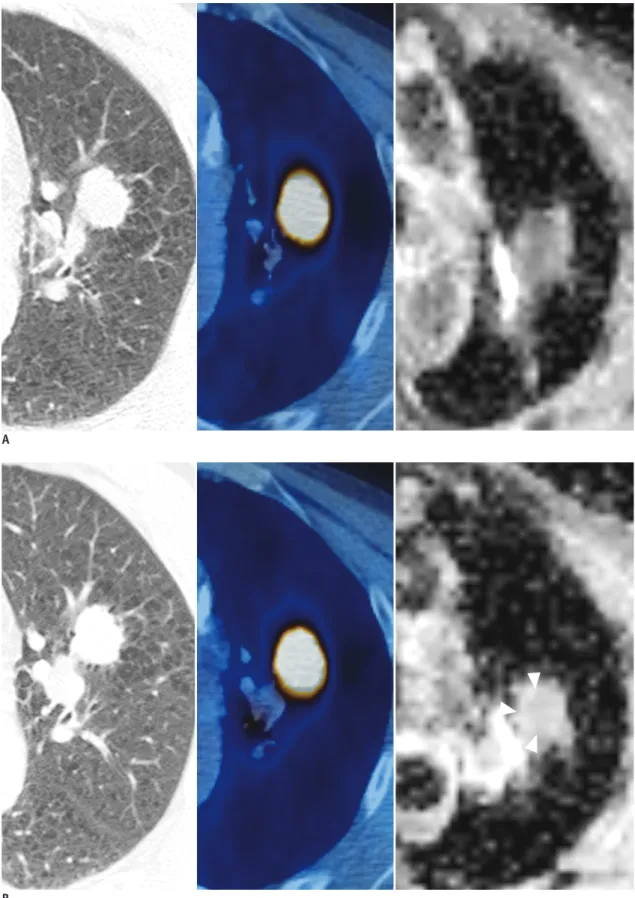
(13) Tumor Response Evaluation. A. B Fig. 11. Patient with non-small cell lung cancer.. Serial CT scans on lung window image, PET-CTs and ADC maps obtained before (A) and 5 weeks after (B) target therapy. There are no significant interval changes in diameter (18 mm in diameter) and FDG activity (ROI). But ADC map shows increase in mean ADC value from 1.21 to 1.42 (x 10-3 mm2/s) of tumor (arrowheads) after treatment over initial state, suggesting tumor necrosis after treatment. PET = positron emission tomography, ACD = apparent diffusion coefficient. kjronline.org. Korean J Radiol 13(4), Jul/Aug 2012. 383.
(14) Kang et al.. diffusion, and therefore, ADC value increases (Fig. 11). In a recent the United States National Cancer Institutesponsored consensus conference report on DWI (72), it was addressed that there is “an extraordinary opportunity for DWI to evolve into a clinically valuable imaging tool, potentially important for drug development.” Major advantages of DWI include that no ionizing radiation is administered and that no injection of isotopes or any other contrast medium is necessary for examinations. Data acquisition times are reasonably short in terms of patient comfort, and the method is easily repeated. The information obtained can be quantified and displayed as parametric maps, enabling spatial heterogeneity of tissues or tumors to be analyzed, before and in response to treatment. DWI biomarkers such as ADC are theoretically independent of magnetic field strength (although in practice there may be variations due to technical reasons), and the relative simplicity of data acquisition facilitates multicenter and longitudinal studies. Both animal tumors and human cancer studies have shown that increases in ADC values can occur rapidly after the first dose of chemotherapy at a time consistent with the onset of apoptosis. Chenevert et al. (73) showed that increased diffusion values are detected shortly after the initiation of brain tumor treatment, well before changes in tumor volume, and that the magnitude of diffusion change correlates positively with clinical outcome. With recent MRI technical advances, there have been progressive improvement in imaging body regions, including the abdomen and musculoskeletal system. There have been a few studies in primary rectal cancer patients that assessed the prognostic value of pretreatment ADC measurements (74-76). Hein et al. (77) used DWI to show substantial radiobiological changes in primary rectal cancers during therapy and detected a correlation between decreased ADC levels and the development of radiotherapy-induced intratumoral fibrosis. Several studies have evaluated ADC changes in patients with primary breast cancer treated with neoadjuvant chemotherapy and radiotherapy (78, 79). Pickels et al. (78) reported increased ADC values before a decrease in tumor size in women undergoing neoadjuvant chemotherapy for breast cancer. Chinnaiyan et al. (80) used DWI to monitor the effects of radiotherapy on breast cancer and reported an increase in ADC values with response to treatment, which histologically correlated with cell death due to apoptosis. Preliminary reports on the use of DWI in other tumors emphasize its potential as a marker of 384. response to therapy for osteosarcoma (81), neuroblastoma (82), NSCLC (83) and prostate cancer (84). Magnetic Resonance Spectroscopy Magnetic resonance spectroscopy (MRS) helps detect the resonance spectra of chemical compounds except water, allowing for a true representation of the chemical and molecular composition of tissues. Although initially developed for neurologic applications, MRS has been expanded to be applicable to evaluate various tumors. The biomedical images produced by MRS are the product of an interaction between atomic nuclei and magnetic fields. Nuclei resonate at slightly differing frequencies, allowing the assessment of tissue molecular composition and providing structural information about relevant chemical compounds. Results are displayed on a spectrum which shows a series of peaks corresponding to different metabolites (85). Previous studies indicated that these methods can be useful for monitoring the metabolic consequences of treatments in patients with malignancy such as breast cancer (86-88), HCC (89) and glioma (90). Manton et al. (86) used MRS to predict tumor response in 34 women receiving neoadjuvant chemotherapy for breast cancer. Imaging was done before the start of treatment and then again after two cycles of chemotherapy. Small/absent decreases in water-tofat ratios after the two cycles of chemotherapy accurately predicted final volume non-response in 50% of cases (3 of six patients) while maintaining 100% sensitivity and negative predictive value. This level of accuracy might permit clinical application where early, accurate prediction of non-response would permit an early change to second-line treatment. Many studies are now also focusing on measurements of choline-containing compounds by the use of watersuppressed MRS because choline is thought to be potentially a more sensitive and biochemically relevant marker of cancer-cell viability. In the studies of lymphoma and head and neck tumors, pre-therapy concentrations of phosphocholine and phosphomonoesters correlated with eventual tumor response (85). However, single-metabolite biomarkers are often not specific enough to help predict response to a particular therapy. Once individual metabolic changes are validated through detailed mechanistic studies, a combination of metabolic alterations could be envisaged, which might provide a more specific signature of response than single metabolite biomarker alterations (91).. Korean J Radiol 13(4), Jul/Aug 2012. kjronline.org.
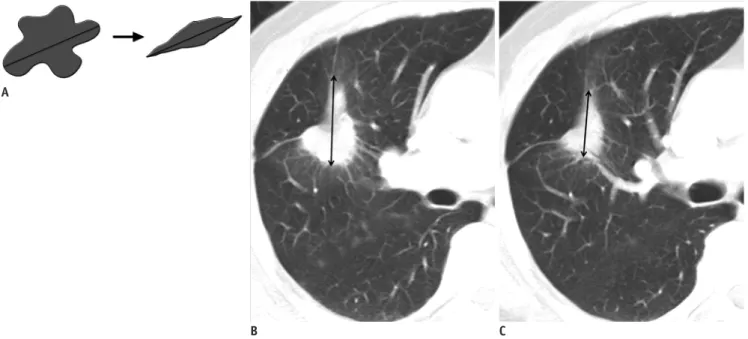
(15) Tumor Response Evaluation. Multi-Parametric Imaging and Tumor Response Evaluation Given that each functional imaging technique provides unique insight into a particular aspect of altered pathophysiology in disease, there is now the opportunity to compare and correlate parametric maps derived from more than one imaging technique. Such correlative imaging comparison is not confined to one-imaging-tool-derived information but can be also extended to DECT, MRI, or PET/ CT imaging. By combining the information derived from a number of imaging techniques, it is possible to gain a multifaceted insight into the phenotypic expression of diseases (92).. Other Issues in Imaging-Based Tumor Response Evaluation Variability and Repeatability When measuring tumor size changes between interval studies, changes include true tumor changes per se and concomitant measurement variations or errors. Variability can be caused by scan-rescan variability and both intra- and inter-observer variability between two repeat readings of the same scan. Oxnard et al. (94) reported that increases and decreases of tumor size less than 10% can be a result of the inherent variability of reimaging in patients with advanced NSCLC. This variability was greatest. in the measurement of small tumors and had important implications for the accurate determination of disease progression. Volumetric Assessment The standard way to assess the response of solid tumors to chemotherapy is to perform uni-dimensional measurement of tumor size according to the RECIST criteria. Such linear measurements have limitations related to variability in technical factors, tumor morphology, and reader decisions (Fig. 12). The measurements of entire tumor volumes may allow one to overcome some of the limitations, to improve the ability to reliably detect small changes in measurements, and to increase statistical power per subject in trials (95). Neither the RECIST nor the WHO criteria include volume measurement partly because of technical restrictions such as the anisotropic characteristics of past diagnostic imaging techniques and partly because of limitations of the available measurement methods. But with the advent of thin-section CT, it is now possible to obtain image data sets with spatial resolutions adequate to measure tumor volumes (96). Zhao et al. (97) suggested that measuring volumetric changes in tumor dimension may hold the potential to be an earlier or better biomarker of tumor regression or progression. With semiautomated tumor segmentation with thin-section CT images and calculation by the use of computer software, changes in. A. B Fig. 12. Limitation of uni-dimensional measurement.. C. A. Limitation of uni-dimensional measurement. Axial CT scans on lung window images in patient with non-small cell lung cancer before (B) and after (C) chemotherapy show decrease of 9.5% (from 4.2 cm to 3.8 cm) in long axis diameter however tumor shrunk by 74% (from 13.6 cm 3 to 3.5 cm3) in volume, in actuality.. kjronline.org. Korean J Radiol 13(4), Jul/Aug 2012. 385.
(16) Kang et al.. tumor volume may be assessed as early as 3 weeks after the initiation of gefitinib (Iressa) treatment, whereas a lower magnitude of changes in unidimensional and bidimensional measurements was seen during the same time period. The radiological measurement of tumor burden has evolved with the development of imaging technology. Volumetric assessment, by allowing the early identification of tumor dimensional changes, offers significant advantages for more rapid and accurate evaluation of anti-cancer drug efficacy than conventional measurement methods. New Concepts in Clinical Research of Imaging-Based Tumor Response Evaluation Independent central review (ICR) is advocated by regulatory authorities as a means of independent verification of clinical trial end-points dependent on medical imaging when the data from trials may be submitted for licensing applications. ICR is the process by which all radiologic examinations and selected clinical data acquired as part of clinical protocol are submitted to central location and reviewed by independent physicians who are not involved in the treatment of the patients. The ICR process can be used prospectively or retrospectively to assess whether patients meet eligibility criteria such as having PD on prior therapy or having measureable disease at baseline. It has been reported that even though eligibility requires measurable disease at baseline, up to 9% of enrolled patients do not have measurable disease as determined by the ICR. (98) ICR is a detailed process that enables the objective, reproducible, and independent evaluation of results when the primary study end-points are driven by medical imaging. The process is used to minimize bias; however, it does not completely elimination all potential sources of bias and, in some cases, may introduce bias of its own. The ICR process facilitates review by regulatory agencies and by accumulating all images in one location and one format. However, operational planning and consideration for the discussion issues that exist is required. The implementation of ICR in clinical trials is a process that will continue to evolve (99). Traditional chemotherapies are cytotoxic in nature and act primarily by eliminating neoplastic cells (100). Therefore, change in tumor size, which is an indicator of change in the number of neoplastic cells, has evolved into a radiologic biomarker of treatment response (101). In contrast, targeted chemotherapy, which has emerged in the past 15 years, interferes with signaling pathways 386. and thereby inhibits cell growth but does not necessarily lead to cell death unlike cytotoxic drugs. With such newer treatments, lack of progression may be associated with a positive improvement in outcome, even in the absence of major shrinkage of tumors (1, 2). Oncologists have become interested in the length of time that a cancer does not grow or metastasize. Thus, over the past decade, progression-freesurvival became the preferred end-point for cancer therapy trials (102). Whether to stop or to continue treatment with molecularly targeted drugs can only be determined if we can define disease progression. Therefore, future clinical trials will need to investigate tissue or biomarker monitoring during treatment and correlate findings with relevant documentation associated with disease progression (103).. CONCLUSION In conclusion, tumor response may be evaluated basically and readily by the use of RECIST version 1.1. However, the criteria mainly lean on tumor dimensional changes. These criteria do not reflect other morphologic, functional, or metabolic changes that may occur with conventional chemotherapy or targeted chemotherapy. The state-ofthe-art multidetector CT is still playing an important role by showing high-quality, high-resolution images that are appropriate enough to measure tumor size and its changes. Additional imaging biomarker devices such as dual energy CT, PET, MRI including DWI shall become more frequently used for tumor response evaluation. Quantitative imaging biomarkers that are appropriate for and most fitted into estimating the response should be selected to evaluate treatment response in each tumor type. In another perspective, multiparametric imaging by integrating all information provided by such diverse imaging modalities may be the future goal in tumor response evaluation.. REFERENCES 1. Ratain MJ, Eckhardt SG. Phase II studies of modern drugs directed against new targets: if you are fazed, too, then resist RECIST. J Clin Oncol 2004;22:4442-4445 2. Rosner GL, Stadler W, Ratain MJ. Randomized discontinuation design: application to cytostatic antineoplastic agents. J Clin Oncol 2002;20:4478-4484 3. Miller AB, Hoogstraten B, Staquet M, Winkler A. Reporting results of cancer treatment. Cancer 1981;47:207-214 4. Therasse P, Arbuck SG, Eisenhauer EA, Wanders J, Kaplan RS,. Korean J Radiol 13(4), Jul/Aug 2012. kjronline.org.
(17) Tumor Response Evaluation. Rubinstein L, et al. New guidelines to evaluate the response to treatment in solid tumors. European Organization for Research and Treatment of Cancer, National Cancer Institute of the United States, National Cancer Institute of Canada. J Natl Cancer Inst 2000;92:205-216 5. Eisenhauer EA, Therasse P, Bogaerts J, Schwartz LH, Sargent D, Ford R, et al. New response evaluation criteria in solid tumours: revised RECIST guideline (version 1.1). Eur J Cancer 2009;45:228-247 6. van Persijn van Meerten EL, Gelderblom H, Bloem JL. RECIST revised: implications for the radiologist. A review article on the modified RECIST guideline. Eur Radiol 2010;20:14561467 7. Scher HI, Morris MJ, Kelly WK, Schwartz LH, Heller G. Prostate cancer clinical trial end points: “RECIST”ing a step backwards. Clin Cancer Res 2005;11:5223-5232 8. Nowak AK. CT, RECIST, and malignant pleural mesothelioma. Lung Cancer 2005;49 Suppl 1:S37-S40 9. Byrne MJ, Nowak AK. Modified RECIST criteria for assessment of response in malignant pleural mesothelioma. Ann Oncol 2004;15:257-260 10. van Klaveren RJ, Aerts JG, de Bruin H, Giaccone G, Manegold C, van Meerbeeck JP. Inadequacy of the RECIST criteria for response evaluation in patients with malignant pleural mesothelioma. Lung Cancer 2004;43:63-69 11. Therasse P, Eisenhauer EA, Verweij J. RECIST revisited: a review of validation studies on tumour assessment. Eur J Cancer 2006;42:1031-1039 12. Gopinath G, Ahmed A, Buscombe JR, Dickson JC, Caplin ME, Hilson AJ. Prediction of clinical outcome in treated neuroendocrine tumours of carcinoid type using functional volumes on 111In-pentetreotide SPECT imaging. Nucl Med Commun 2004;25:253-257 13. Barnacle AM, McHugh K. Limitations with the response evaluation criteria in solid tumors (RECIST) guidance in disseminated pediatric malignancy. Pediatr Blood Cancer 2006;46:127-134 14. Bruix J, Sherman M, Llovet JM, Beaugrand M, Lencioni R, Burroughs AK, et al. Clinical management of hepatocellular carcinoma. Conclusions of the Barcelona-2000 EASL conference. European Association for the Study of the Liver. J Hepatol 2001;35:421-430 15. Varela M, Real MI, Burrel M, Forner A, Sala M, Brunet M, et al. Chemoembolization of hepatocellular carcinoma with drug eluting beads: efficacy and doxorubicin pharmacokinetics. J Hepatol 2007;46:474-481 16. Lencioni R, Cioni D, Crocetti L, Franchini C, Pina CD, Lera J, et al. Early-stage hepatocellular carcinoma in patients with cirrhosis: long-term results of percutaneous image-guided radiofrequency ablation. Radiology 2005;234:961-967 17. Sala M, Llovet JM, Vilana R, Bianchi L, Solé M, Ayuso C, et al. Initial response to percutaneous ablation predicts survival in patients with hepatocellular carcinoma. Hepatology 2004;40:1352-1360 18. Llovet JM, Real MI, Montaña X, Planas R, Coll S, Aponte J,. kjronline.org. Korean J Radiol 13(4), Jul/Aug 2012. et al. Arterial embolisation or chemoembolisation versus symptomatic treatment in patients with unresectable hepatocellular carcinoma: a randomised controlled trial. Lancet 2002;359:1734-1739 19. Riaz A, Kulik L, Lewandowski RJ, Ryu RK, Giakoumis Spear G, Mulcahy MF, et al. Radiologic-pathologic correlation of hepatocellular carcinoma treated with internal radiation using yttrium-90 microspheres. Hepatology 2009;49:11851193 20. Forner A, Ayuso C, Varela M, Rimola J, Hessheimer AJ, de Lope CR, et al. Evaluation of tumor response after locoregional therapies in hepatocellular carcinoma: are response evaluation criteria in solid tumors reliable? Cancer 2009;115:616-623 21. Sleijfer S, Wiemer E, Verweij J. Drug Insight: gastrointestinal stromal tumors (GIST)--the solid tumor model for cancerspecific treatment. Nat Clin Pract Oncol 2008;5:102-111 22. Choi H, Charnsangavej C, de Castro Faria S, Tamm EP, Benjamin RS, Johnson MM, et al. CT evaluation of the response of gastrointestinal stromal tumors after imatinib mesylate treatment: a quantitative analysis correlated with FDG PET findings. AJR Am J Roentgenol 2004;183:1619-1628 23. Choi H, Charnsangavej C, Faria SC, Macapinlac HA, Burgess MA, Patel SR, et al. Correlation of computed tomography and positron emission tomography in patients with metastatic gastrointestinal stromal tumor treated at a single institution with imatinib mesylate: proposal of new computed tomography response criteria. J Clin Oncol 2007;25:17531759 24. Choi H. Response evaluation of gastrointestinal stromal tumors. Oncologist 2008;13 Suppl 2:4-7 25. Chun YS, Vauthey JN, Boonsirikamchai P, Maru DM, Kopetz S, Palavecino M, et al. Association of computed tomography morphologic criteria with pathologic response and survival in patients treated with bevacizumab for colorectal liver metastases. JAMA 2009;302:2338-2344 26. van der Veldt AA, Meijerink MR, van den Eertwegh AJ, Haanen JB, Boven E. Choi response criteria for early prediction of clinical outcome in patients with metastatic renal cell cancer treated with sunitinib. Br J Cancer 2010;102:803-809 27. Smith AD, Lieber ML, Shah SN. Assessing tumor response and detecting recurrence in metastatic renal cell carcinoma on targeted therapy: importance of size and attenuation on contrast-enhanced CT. AJR Am J Roentgenol 2010;194:157165 28. Smith AD, Shah SN, Rini BI, Lieber ML, Remer EM. Morphology, Attenuation, Size, and Structure (MASS) criteria: assessing response and predicting clinical outcome in metastatic renal cell carcinoma on antiangiogenic targeted therapy. AJR Am J Roentgenol 2010;194:1470-1478 29. Sandler AB, Schiller JH, Gray R, Dimery I, Brahmer J, Samant M, et al. Retrospective evaluation of the clinical and radiographic risk factors associated with severe pulmonary hemorrhage in first-line advanced, unresectable non-small-. 387.
(18) Kang et al.. cell lung cancer treated with Carboplatin and Paclitaxel plus bevacizumab. J Clin Oncol 2009;27:1405-1412 30. Goh V, Ganeshan B, Nathan P, Juttla JK, Vinayan A, Miles KA. Assessment of response to tyrosine kinase inhibitors in metastatic renal cell cancer: CT texture as a predictive biomarker. Radiology 2011;261:165-171 31. Lee HY, Lee KS, Ahn MJ, Hwang HS, Lee JW, Park K, et al. New CT response criteria in non-small cell lung cancer: proposal and application in EGFR tyrosine kinase inhibitor therapy. Lung Cancer 2011;73:63-69 32. Lee HY, Lee KS, Hwang HS, Lee JW, Ahn MJ, Park K, et al. Molecularly targeted therapy using bevacizumab for nonsmall cell lung cancer: a pilot study for the new CT response criteria. Korean J Radiol 2010;11:618-626 33. Hamaoka T, Costelloe CM, Madewell JE, Liu P, Berry DA, Islam R, et al. Tumour response interpretation with new tumour response criteria vs the World Health Organisation criteria in patients with bone-only metastatic breast cancer. Br J Cancer 2010;102:651-657 34. Coleman RE, Mashiter G, Whitaker KB, Moss DW, Rubens RD, Fogelman I. Bone scan flare predicts successful systemic therapy for bone metastases. J Nucl Med 1988;29:1354-1359 35. Imbriaco M, Larson SM, Yeung HW, Mawlawi OR, Erdi Y, Venkatraman ES, et al. A new parameter for measuring metastatic bone involvement by prostate cancer: the Bone Scan Index. Clin Cancer Res 1998;4:1765-1772 36. Dennis ER, Jia X, Mezheritskiy IS, Stephenson RD, Schoder H, Fox JJ, et al. Bone scan index: a quantitative treatment response biomarker for castration-resistant metastatic prostate cancer. J Clin Oncol 2012;30:519-524 37. Wahl RL, Jacene H, Kasamon Y, Lodge MA. From RECIST to PERCIST: Evolving Considerations for PET response criteria in solid tumors. J Nucl Med 2009;50 Suppl 1:122S-150S 38. Kawashima A, Libshitz HI. Malignant pleural mesothelioma: CT manifestations in 50 cases. AJR Am J Roentgenol 1990;155:965-969 39. Armato SG 3rd, Ogarek JL, Starkey A, Vogelzang NJ, Kindler HL, Kocherginsky M, et al. Variability in mesothelioma tumor response classification. AJR Am J Roentgenol 2006;186:10001006 40. Lee HY, Hyun SH, Lee KS, Kim BT, Kim J, Shim YM, et al. Volume-based parameter of 18)F-FDG PET/CT in malignant pleural mesothelioma: prediction of therapeutic response and prognostic implications. Ann Surg Oncol 2010;17:2787-2794 41. Fischer BM, Mortensen J, Højgaard L. Positron emission tomography in the diagnosis and staging of lung cancer: a systematic, quantitative review. Lancet Oncol 2001;2:659-666 42. Hoekstra CJ, Stroobants SG, Hoekstra OS, Vansteenkiste J, Biesma B, Schramel FJ, et al. The value of [18F]fluoro2-deoxy-D-glucose positron emission tomography in the selection of patients with stage IIIA-N2 non-small cell lung cancer for combined modality treatment. Lung Cancer 2003;39:151-157 43. Berghmans T, Dusart M, Paesmans M, Hossein-Foucher C, Buvat I, Castaigne C, et al. Primary tumor standardized. 388. uptake value (SUVmax) measured on fluorodeoxyglucose positron emission tomography (FDG-PET) is of prognostic value for survival in non-small cell lung cancer (NSCLC): a systematic review and meta-analysis (MA) by the European Lung Cancer Working Party for the IASLC Lung Cancer Staging Project. J Thorac Oncol 2008;3:6-12 44. Kramer H, Post WJ, Pruim J, Groen HJ. The prognostic value of positron emission tomography in non-small cell lung cancer: analysis of 266 cases. Lung Cancer 2006;52:213-217 45. Hoekstra CJ, Stroobants SG, Smit EF, Vansteenkiste J, van Tinteren H, Postmus PE, et al. Prognostic relevance of response evaluation using [18F]-2-fluoro-2-deoxy-Dglucose positron emission tomography in patients with locally advanced non-small-cell lung cancer. J Clin Oncol 2005;23:8362-8370 46. Lee DH, Kim SK, Lee HY, Lee SY, Park SH, Kim HY, et al. Early prediction of response to first-line therapy using integrated 18F-FDG PET/CT for patients with advanced/metastatic nonsmall cell lung cancer. J Thorac Oncol 2009;4:816-821 47. Decoster L, Schallier D, Everaert H, Nieboer K, Meysman M, Neyns B, et al. Complete metabolic tumour response, assessed by 18-fluorodeoxyglucose positron emission tomography (18FDG-PET), after induction chemotherapy predicts a favourable outcome in patients with locally advanced non-small cell lung cancer (NSCLC). Lung Cancer 2008;62:55-61 48. Sunaga N, Oriuchi N, Kaira K, Yanagitani N, Tomizawa Y, Hisada T, et al. Usefulness of FDG-PET for early prediction of the response to gefitinib in non-small cell lung cancer. Lung Cancer 2008;59:203-210 49. Aukema TS, Kappers I, Olmos RA, Codrington HE, van Tinteren H, van Pel R, et al. Is 18F-FDG PET/CT useful for the early prediction of histopathologic response to neoadjuvant erlotinib in patients with non-small cell lung cancer? J Nucl Med 2010;51:1344-1348 50. Su H, Bodenstein C, Dumont RA, Seimbille Y, Dubinett S, Phelps ME, et al. Monitoring tumor glucose utilization by positron emission tomography for the prediction of treatment response to epidermal growth factor receptor kinase inhibitors. Clin Cancer Res 2006;12:5659-5667 51. McDermott GM, Welch A, Staff RT, Gilbert FJ, Schweiger L, Semple SI, et al. Monitoring primary breast cancer throughout chemotherapy using FDG-PET. Breast Cancer Res Treat 2007;102:75-84 52. Semple SI, Gilbert FJ, Redpath TW, Staff RT, Ahearn TS, Welch AE, et al. The relationship between vascular and metabolic characteristics of primary breast tumours. Eur Radiol 2004;14:2038-2045 53. Semple SI, Staff RT, Heys SD, Redpath TW, Welch AE, Ahearn TS, et al. Baseline MRI delivery characteristics predict change in invasive ductal breast carcinoma PET metabolism as a result of primary chemotherapy administration. Ann Oncol 2006;17:1393-1398 54. Goh V, Ng QS, Miles K. Computed tomography perfusion imaging for therapeutic assessment: has it come of age as a Korean J Radiol 13(4), Jul/Aug 2012. kjronline.org.
(19) Tumor Response Evaluation. biomarker in oncology? Invest Radiol 2012;47:2-4 55. Jiang T, Kambadakone A, Kulkarni NM, Zhu AX, Sahani DV. Monitoring response to antiangiogenic treatment and predicting outcomes in advanced hepatocellular carcinoma using image biomarkers, CT perfusion, tumor density, and tumor size (RECIST). Invest Radiol 2012;47:11-17 56. Reiner CS, Goetti R, Eberli D, Klotz E, Boss A, Pfammatter T, et al. CT perfusion of renal cell carcinoma: impact of volume coverage on quantitative analysis. Invest Radiol 2012;47:3340 57. Padhani AR, Khan AA. Diffusion-weighted (DW) and dynamic contrast-enhanced (DCE) magnetic resonance imaging (MRI) for monitoring anticancer therapy. Target Oncol 2010;5:39-52 58. Tofts PS, Brix G, Buckley DL, Evelhoch JL, Henderson E, Knopp MV, et al. Estimating kinetic parameters from dynamic contrast-enhanced T(1)-weighted MRI of a diffusable tracer: standardized quantities and symbols. J Magn Reson Imaging 1999;10:223-232 59. Barentsz JO, Berger-Hartog O, Witjes JA, Hulsbergen-van der Kaa C, Oosterhof GO, VanderLaak JA, et al. Evaluation of chemotherapy in advanced urinary bladder cancer with fast dynamic contrast-enhanced MR imaging. Radiology 1998;207:791-797 60. Ah-See ML, Makris A, Taylor NJ, Harrison M, Richman PI, Burcombe RJ, et al. Early changes in functional dynamic magnetic resonance imaging predict for pathologic response to neoadjuvant chemotherapy in primary breast cancer. Clin Cancer Res 2008;14:6580-6589 61. Padhani AR, Hayes C, Assersohn L, Powles T, Makris A, Suckling J, et al. Prediction of clinicopathologic response of breast cancer to primary chemotherapy at contrast-enhanced MR imaging: initial clinical results. Radiology 2006;239:361374 62. Reddick WE, Taylor JS, Fletcher BD. Dynamic MR imaging (DEMRI) of microcirculation in bone sarcoma. J Magn Reson Imaging 1999;10:277-285 63. Padhani AR, Leach MO. Antivascular cancer treatments: functional assessments by dynamic contrast-enhanced magnetic resonance imaging. Abdom Imaging 2005;30:324341 64. Rosen MA, Schnall MD. Dynamic contrast-enhanced magnetic resonance imaging for assessing tumor vascularity and vascular effects of targeted therapies in renal cell carcinoma. Clin Cancer Res 2007;13(2 Pt 2):770s-776s 65. Liu G, Rugo HS, Wilding G, McShane TM, Evelhoch JL, Ng C, et al. Dynamic contrast-enhanced magnetic resonance imaging as a pharmacodynamic measure of response after acute dosing of AG-013736, an oral angiogenesis inhibitor, in patients with advanced solid tumors: results from a phase I study. J Clin Oncol 2005;23:5464-5473 66. Wedam SB, Low JA, Yang SX, Chow CK, Choyke P, Danforth D, et al. Antiangiogenic and antitumor effects of bevacizumab in patients with inflammatory and locally advanced breast cancer. J Clin Oncol 2006;24:769-777 67. Chae EJ, Song JW, Seo JB, Krauss B, Jang YM, Song KS.. kjronline.org. Korean J Radiol 13(4), Jul/Aug 2012. Clinical utility of dual-energy CT in the evaluation of solitary pulmonary nodules: initial experience. Radiology 2008;249:671-681 68. Schmid-Bindert G, Henzler T, Chu TQ, Meyer M, Nance JW Jr, Schoepf UJ, et al. Functional imaging of lung cancer using dual energy CT: how does iodine related attenuation correlate with standardized uptake value of 18FDG-PET-CT? Eur Radiol 2012;22:93-103 69. Kim YN, Lee HY, Lee KS, Seo JB, Chung MJ, Ahn MJ, et al. Dual-energy CT in patients treated with anti-angiogenic agents for non-small cell lung cancer: a new method of monitoring tumor response? Korean J Radiol In press 70. Koh DM, Collins DJ. Diffusion-weighted MRI in the body: applications and challenges in oncology. AJR Am J Roentgenol 2007;188:1622-1635 71. Malayeri AA, El Khouli RH, Zaheer A, Jacobs MA, CoronaVillalobos CP, Kamel IR, et al. Principles and applications of diffusion-weighted imaging in cancer detection, staging, and treatment follow-up. Radiographics 2011;31:1773-1791 72. Padhani AR, Liu G, Koh DM, Chenevert TL, Thoeny HC, Takahara T, et al. Diffusion-weighted magnetic resonance imaging as a cancer biomarker: consensus and recommendations. Neoplasia 2009;11:102-125 73. Chenevert TL, Stegman LD, Taylor JM, Robertson PL, Greenberg HS, Rehemtulla A, et al. Diffusion magnetic resonance imaging: an early surrogate marker of therapeutic efficacy in brain tumors. J Natl Cancer Inst 2000;92:20292036 74. Dzik-Jurasz A, Domenig C, George M, Wolber J, Padhani A, Brown G, et al. Diffusion MRI for prediction of response of rectal cancer to chemoradiation. Lancet 2002;360:307-308 75. DeVries AF, Kremser C, Hein PA, Griebel J, Krezcy A, Ofner D, et al. Tumor microcirculation and diffusion predict therapy outcome for primary rectal carcinoma. Int J Radiat Oncol Biol Phys 2003;56:958-965 76. Koh DM, Scurr E, Collins D, Kanber B, Norman A, Leach MO, et al. Predicting response of colorectal hepatic metastasis: value of pretreatment apparent diffusion coefficients. AJR Am J Roentgenol 2007;188:1001-1008 77. Hein PA, Kremser C, Judmaier W, Griebel J, Pfeiffer KP, Kreczy A, et al. Diffusion-weighted magnetic resonance imaging for monitoring diffusion changes in rectal carcinoma during combined, preoperative chemoradiation: preliminary results of a prospective study. Eur J Radiol 2003;45:214-222 78. Pickles MD, Gibbs P, Lowry M, Turnbull LW. Diffusion changes precede size reduction in neoadjuvant treatment of breast cancer. Magn Reson Imaging 2006;24:843-847 79. Sharma U, Danishad KK, Seenu V, Jagannathan NR. Longitudinal study of the assessment by MRI and diffusionweighted imaging of tumor response in patients with locally advanced breast cancer undergoing neoadjuvant chemotherapy. NMR Biomed 2009;22:104-113 80. Chinnaiyan AM, Prasad U, Shankar S, Hamstra DA, Shanaiah M, Chenevert TL, et al. Combined effect of tumor necrosis factor-related apoptosis-inducing ligand and ionizing. 389.
(20) Kang et al.. radiation in breast cancer therapy. Proc Natl Acad Sci U S A 2000;97:1754-1759 81. Uhl M, Saueressig U, Koehler G, Kontny U, Niemeyer C, Reichardt W, et al. Evaluation of tumour necrosis during chemotherapy with diffusion-weighted MR imaging: preliminary results in osteosarcomas. Pediatr Radiol 2006;36:1306-1311 82. Uhl M, Altehoefer C, Kontny U, Il’yasov K, Büchert M, Langer M. MRI-diffusion imaging of neuroblastomas: first results and correlation to histology. Eur Radiol 2002;12:2335-2338 83. Yabuuchi H, Hatakenaka M, Takayama K, Matsuo Y, Sunami S, Kamitani T, et al. Non-small cell lung cancer: detection of early response to chemotherapy by using contrast-enhanced dynamic and diffusion-weighted MR imaging. Radiology 2011;261:598-604 84. Park SY, Kim CK, Park BK, Lee HM, Lee KS. Prediction of biochemical recurrence following radical prostatectomy in men with prostate cancer by diffusion-weighted magnetic resonance imaging: initial results. Eur Radiol 2011;21:11111118 85. Harry VN, Semple SI, Parkin DE, Gilbert FJ. Use of new imaging techniques to predict tumour response to therapy. Lancet Oncol 2010;11:92-102 86. Manton DJ, Chaturvedi A, Hubbard A, Lind MJ, Lowry M, Maraveyas A, et al. Neoadjuvant chemotherapy in breast cancer: early response prediction with quantitative MR imaging and spectroscopy. Br J Cancer 2006;94:427-435 87. Morse DL, Carroll D, Day S, Gray H, Sadarangani P, Murthi S, et al. Characterization of breast cancers and therapy response by MRS and quantitative gene expression profiling in the choline pathway. NMR Biomed 2009;22:114-127 88. Baek HM, Chen JH, Nie K, Yu HJ, Bahri S, Mehta RS, et al. Predicting pathologic response to neoadjuvant chemotherapy in breast cancer by using MR imaging and quantitative 1H MR spectroscopy. Radiology 2009;251:653-662 89. Wu B, Peng WJ, Wang PJ, Gu YJ, Li WT, Zhou LP, et al. In vivo 1H magnetic resonance spectroscopy in evaluation of hepatocellular carcinoma and its early response to transcatheter arterial chemoembolization. Chin Med Sci J 2006;21:258-264 90. Preul MC, Caramanos Z, Villemure JG, Shenouda G, LeBlanc R, Langleben A, et al. Using proton magnetic resonance spectroscopic imaging to predict in vivo the response of. 390. recurrent malignant gliomas to tamoxifen chemotherapy. Neurosurgery 2000;46:306-318 91. Lodi A, Ronen SM. Magnetic resonance spectroscopy detectable metabolomic fingerprint of response to antineoplastic treatment. PLoS One 2011;6:e26155 92. Padhani AR, Miles KA. Multiparametric imaging of tumor response to therapy. Radiology 2010;256:348-364 93. Zhao B, James LP, Moskowitz CS, Guo P, Ginsberg MS, Lefkowitz RA, et al. Evaluating variability in tumor measurements from same-day repeat CT scans of patients with non-small cell lung cancer. Radiology 2009;252:263-272 94. Oxnard GR, Zhao B, Sima CS, Ginsberg MS, James LP, Lefkowitz RA, et al. Variability of lung tumor measurements on repeat computed tomography scans taken within 15 minutes. J Clin Oncol 2011;29:3114-3119 95. Goldmacher GV, Conklin J. The use of tumour volumetrics to assess response to therapy in anticancer clinical trials. Br J Clin Pharmacol 2012;73:846-854 96. Gavrielides MA, Kinnard LM, Myers KJ, Petrick N. Noncalcified lung nodules: volumetric assessment with thoracic CT. Radiology 2009;251:26-37 97. Zhao B, Schwartz LH, Moskowitz CS, Ginsberg MS, Rizvi NA, Kris MG. Lung cancer: computerized quantification of tumor response--initial results. Radiology 2006;241:892-898 98. Food and Drug Administration. United States food and drug administration guidance for industry: clinical trial endpoints for the approval of cancer drugs and biologics. Rockville, MD: US Department of Health and Human Services; 2007. 99. Ford R, Schwartz L, Dancey J, Dodd LE, Eisenhauer EA, Gwyther S, et al. Lessons learned from independent central review. Eur J Cancer 2009;45:268-274 100. Gwyther SJ, Schwartz LH. How to assess anti-tumour efficacy by imaging techniques. Eur J Cancer 2008;44:39-45 101. Saini S. Radiologic measurement of tumor size in clinical trials: past, present, and future. AJR Am J Roentgenol 2001;176:333-334 102. Sullivan DC, Gatsonis C. Response to treatment series: part 1 and introduction, measuring tumor response--challenges in the era of molecular medicine. AJR Am J Roentgenol 2011;197:15-17 103. Hirsch FR, Mok TS, Borges V, Bunn PA Jr. Molecularly targeted therapy: when to stop and when to continue? Lancet Oncol 2010;11:709-711. Korean J Radiol 13(4), Jul/Aug 2012. kjronline.org.
(21)
수치

+6
관련 문서