• 검색 결과가 없습니다.

Bone Mineral Density is an Independent Determinant of Left Ventricular Mass Index in the General Female Population

N/A
N/A
Protected

Academic year: 2022

Share "Bone Mineral Density is an Independent Determinant of Left Ventricular Mass Index in the General Female Population"

Copied!
8
0
0

로드 중.... (전체 텍스트 보기)

전체 글

(1)

573

Open Access

Bone Mineral Density is an Independent Determinant

of Left Ventricular Mass Index in the General Female Population

Young-Hyo Lim, MD

1

, Jinho Shin, MD

1

, Jae Ung Lee, MD

1

, Heon Kil Lim, MD

1

, Sangmo Hong, MD

2

, Mi-Kyung Kim, PhD

3

, Bo Youl Choi, MD

3

and Yu-Mi Kim, MD

4

1

Divisions of Cardiology and

2

Endocrinology and Metabolism, Department of Internal Medicine and

3

Department of Preventive Medicine, Hanyang University College of Medicine, Seoul,

4

Department of Preventive Medicine, Dong-A University College of Medicine, Busan, Korea

ABSTRACT

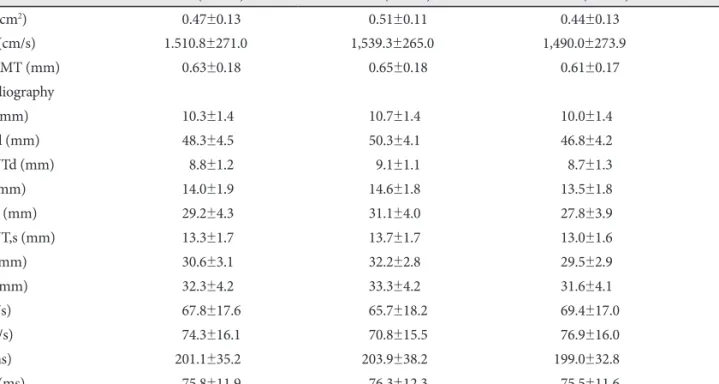
Background and Objectives: Left ventricular hypertrophy (LVH) is a well known cardiovascular prognostic predictor. Os- teoporosis has been suggested to be associated with cardiovascular disease. According to studies of primary hyperparathyroid- ism, a pathophysiological association between calcium metabolism and LVH has been suggested but is not yet fully under- stood. This study was performed to investigate the association between bone mineral density (BMD) and left ventricular mass index (LVMI) in a general population. Subjects and Methods: Data from 460 subjects among 543 subjects sampled from a general population in a rural area in Korea were analyzed. BMD, echocardiography, brachial-ankle pulse wave velocity (ba- PWV), carotid intima-media thickness (IMT) measurement as well as the measurements of blood pressure, blood chemistry and metabolic parameters were analyzed. BMD was measured using the Sahara Clinical Bone Sonometer (Hologic Inc., Mass., USA). Results: Age of the subjects was 59.4±12.4 years. Males were 42.2% (n=194). In a simple correlation analysis on female subjects, age and waist circumference showed negative correlation, and body mass index (BMI) showed positive correlation with BMD. However, only age showed negative correlation with BMD in male subjects. After adjusting baPWV and carotid IMT, we found that BMD was an independent determinant of LVMI in female subjects (β=-13.703, p=0.016), but not in male sub- jects (β=-1.235, p=0.841). Conclusion: BMD is a consistent and independent determining factor of LVMI, BMI and carotid IMT in postmenopausal women. (Korean Circ J 2010;40:573-580)

KEY WORDS: Bone density; Hypertrophy; Heart ventricles.

Received: March 12, 2010 Revision Received: May 10, 2010 Accepted: May 12, 2010

Correspondence: Jinho Shin, MD, Division of Cardiology, Department of Internal Medicine, Hanyang University College of Medicine, 17 Haeng- dang-dong, Seongdong-gu, Seoul 133-792, Korea

Tel: 82-2-2290-8308, Fax: 82-2-2299-0278 E-mail: [email protected]

cc

This is an Open Access article distributed under the terms of the Cre- ative Commons Attribution Non-Commercial License (http://creativecom- mons.org/licenses/by-nc/3.0) which permits unrestricted non-commer- cial use, distribution, and reproduction in any medium, provided the origi- nal work is properly cited.

Introduction

Left ventricular hypertrophy (LVH) and increased left ven- tricular mass index (LVMI) are well known cardiovascular prognostic predictors.

1)2)

In patients with stable coronary heart disease, increased LVMI is independently associated with all-cause mortality and sudden or arrhythmic death, even

in subjects with normal ejection fraction.

3)

Many factors such

as blood pressure, circulatory volume load as well as age, body

size and sex can influence left ventricular (LV) mass.

4)5)

Cur-

rently, osteoporosis has been suggested as another risk factor

associated with cardiovascular disease.

6)7)

In addition, low

bone mineral density (BMD) in postmenopausal women is as-

sociated with increase in cardiovascular mortality.

8)

In the re-

cent Framingham study, low bone mass showed correlation

with coronary artery disease in women.

9)

According to studies

in primary hyperparathyroidism, increased parathyroid hor-

mone and serum calcium can affect cardiomyocytes, vascular

endothelial cells and vascular smooth muscle cells.

10)

This co-

uld lead to hypertrophy of cardiomyocytes and vascular en-

dothelial cell dysfunction, finally resulting in cardiac diastol-

ic dysfunction and cardiac hypertrophy. Moreover, the causal

relationship between low BMD and LVMI in postmenopausal

women could be explained by hormonal changes, for exam-

ple, decreased osteoprotegrin (OPG) levels in this population.

11)

(2)

Although a pathophysiological association between calcium metabolism and LVH has been suggested, few epidemiologic studies have been performed. The objective of this study was to investigate the association between BMD and LVMI in a ge- neral population.

Subjects and Methods

Study population

A cross sectional analysis was performed on a general popul- ation who lived in rural area, Korea from 2004 to 2005. A to- tal of 543 subjects were sampled from the general population and informed consents were obtained from 502 subjects at st- udy entry. Subjects were required to answer a questionnaire which included basic demographic, social economic infor- mation and past medical history. Lifestyle parameters includ- ing smoking, drinking, daily physical activity and dietary pat- terns were reviewed. Among these subjects, an echocardiogra- phy, carotid intima-media thickness (IMT), brachial-ankle pulse wave velocity (baPWV) and BMD were performed in 468 subjects. A complete physical examination including he- ight, weight, waist circumference, heart rate and blood pres- sure was done and blood chemistry including fasting blood glucose (FBG) and lipid profile were analyzed. In total, 42 subjects were excluded due to incomplete data (n=34) and pre-existing cardiovascular disease (n=8). Subjects with hyper- tension or under treatment with antihypertensive medications (112 subjects, male 49%) and diabetes (34 subjects, male 41%) were included in the analysis. Finally, 460 subjects were in- cluded in the analysis.

Echocardiography

Two-dimensional and guided M-mode echocardiograms were performed on each subject by a single cardiologist using a commercially available machine (HP SONOS 2500; Hew- lett Packard, USA) with a 2.5/2.0 MHz transducer. Measure- ments for M-mode guided calculations of LV mass were taken at or just below the tip of the mitral valve with a paper speed of 50 mm/sec. The LV internal end-diastolic dimension, end- systolic dimension (LVID), inter ventricular septal thickness (IVST) and posterior wall thickness (PWT) were measured on the leading edge, according to the guidelines of the Ameri- can Society of Echocardiography. LV mass was calculated using the following equation: LV mass={1.04×(IVSTd+LVDd+

PWTd)

3

-LVIDd

3

}×0.8+0.6.

12)

LVMI was calculated using the following equation: LVMI=LV mass/height

2.7

.

5)13)

Doppler echocardiographic recordings were performed by pulse-wave Doppler with the sample volume at the tips of the mitral valve in the apical four-chamber view and recorded at a paper speed of 100 mm/sec. Early (E) and late (A) diastolic peak velocities and deceleration time were determined, as pre- viously reported.

14)

Bone mineral density

BMD was measured by the Sahara Clinical Bone Sonome- ter (Hologic Inc., Waltham, MA, USA) which is a radiation- free, waterless, dry system. It consists of two unfocused trans- ducers mounted coaxially on a motorized caliper. One trans- ducer acts as transmitter and the other as receiver. The Sahara device measures both broadband ultrasound attenuation (BUA) and the speed of sound (SOS) at a fixed region of in- terest in the mid-calcaneus. BUA, expressed in decibel per megahertz (dB/MHz), is the slope of attenuation as a function of frequency as ultrasound waves pass the heel. SOS, expressed in meters per second (m/second), is the transit velocity of a high frequency sound wave through the heel. The results are combined to provide an estimate of heel BMD in units of grams per square centimeter, using the following equation:

15)

BMD=0.002592×(BUA+SOS)-3.687 g/cm

2

Brachial-ankle pulse wave velocity

BaPWV was measured based on conventional methods with the use of automatic waveform analysis (VP-2000; Colin Medi- cal Technology Co., Komaki, Japan) after resting in the supine position for at least 5 minutes following stabilization of the heart rate.

16)

baPWV between the bilateral brachial arteries and the ankle was measured by placing both arms and the ankle in a cuff, to which an oscillometric sensor was implanted. The mean of the left and right baPWV was used in the analysis.

Carotid intima-media thickness

The bilateral common carotid arteries (CCAs) were meas- ured using the SA 9900 system (Medison Co. Korea) with a 7.5-MHz linear transducer. Scanning was performed at the far wall of the middle and distal CCAs using a lateral longi- tudinal projection. The authors decided on the measurement protocol according to previously published epidemiologic stu- dies, and defined IMT at the CCA as the distance between the leading edge of lumen-intima interface and the leading edge of the media-adventitia interface.

17)18)

Five measurements were made on each side and the average measurement was used as the IMT. To avoid inter-observer variability, all meas- urements were performed by the same examiner who was un- aware of subject characteristics. Intra-observer variability was already evaluated before including the data in this paper. To evaluate intra-observer variability, 20 subjects were random- ly sampled and measurements were made twice on each sub- ject. The correlation coefficient at the left bulb, left common ca- rotid, right bulb and right common carotid area was 0.92, 0.90, 0.92 and 0.91, respectively.

Statistical analysis

Sex stratified analyses were conducted due to different char-

acteristics. Independent t-test and chi-square test were per-

formed to compare the general characteristics and clinical re-

(3)

sults with sex group. Pearson’s correlation and stepwise mul- tiple regression analysis were used to identify significant deter- minants for BMD and LVMI. The criterion for entry into mul- tiple regression analysis was p<0.05 while the removal criterion was p>0.10. A p of less than 0.05 was considered statistically significant. Data were analyzed using Statistical Package for the Social Sciences (SPSS) 16.0 software (SPSS Inc., Chicago, IL, USA).

Results

General characteristics of study subjects

The demographic characteristics of the subjects are sum- marized in Table 1. The age of the subjects was 59.4±12.4 years.

42.2% (n=194) were male. There was no statistical difference between the gender groups in age, waist circumference, systolic blood pressure (SBP) and diastolic blood pressure, pulse pres- sure and heart rate. However, significant differences in height, weight and body mass index (BMI) were noted. Although the total cholesterol and low density lipoprotein-cholesterol (LDL- C) levels were higher in female subjects, these profiles were within normal range in both sexes. The proportion of smokers was greater in male than in female subjects.

Clinical characteristics of the subjects

BMD, baPWV, carotid IMT and echocardiographic find- ings of the subjects are shown in Table 2. BMD, baPWV and carotid IMT of all subjects were within the normal range, 0.47

±0.13 g/cm

2

, 1,510.8±271.0 cm/s and 0.63±0.18 mm, respec- tively. BMD, baPWV, carotid IMT in male subjects were high- er than that of female subjects (BMD; 0.51±0.11 g/cm

2

vs.

0.44±0.13 g/cm

2

, p<0.001, baPWV; 1,539.3±265.0 cm/s vs.

1,490.±273.9 cm/s, p=0.05, carotid IMT; 0.65±0.18 mm vs.

0.61±0.17 mm, p=0.03). The LVMI of study subjects was 47.8

±11.4 g/m

2.7

, and significant difference was not shown be- tween male and female subjects (47.1±10.7 g/m

2.7

vs. 48.3±

11.8 g/m

2.7

, p=0.26).

Determinants of bone mineral density

Among the clinical parameters, being female (r=-0.288, p<

0.001), age (r=-0.246, p<0.001), waist circumference (r=

-0.083, p<0.05), pulse pressure (r=-0.129, p<0.01) and LDL-C (r=-0.187, p<0.001) were negatively correlated with BMD. Cur- rent smokers showed negative correlation with BMD (r=

-0.140, p<0.001). In male subjects, only age (r=-0.121, p<0.05) showed correlation with BMD, whereas in female subjects, age (r=-0.356, p<0.001), waist circumference (r=-0.103, p<

0.05), SBP (r=-0.126, p<0.05), pulse pressure (r=-0.209, p<0.001), FBG (r=-0.115, p<0.05) and LDL-C (r=-0.148, p<0.01) sh- owed negative correlation with the BMD. BMI was positively correlated with BMD (r=0.149, p<0.01). In the stepwise mul- tiple regression analysis, sex (β=-0.312, p<0.001), age (β=

-0.182, p<0.001), BMI (β=0.382, p<0.001), waist circumfer- ence (β=-0.342, p<0.01) and LDL-C (β=-0.087, p<0.05) were independent determinants of BMD. BMI, waist circumfer- ence as well as age were determinants of BMD in the female Table 1. Clinical characteristics of the population as a whole and divided into groups according to sex

Parameters Total (n=460) Male (n=194) Female (n=266) p

Age (years) 059.4±12.4 059.8±12.2 059.2±12.6 0.570

Height (cm) 157.8±9.00 165.4±6.30 152.2±6.20 <0.001

Weight (kg) 061.3±10.6 065.6±10.2 58.1±9.8 <0.001

WC (cm) 87.9±9.0 87.1±8.1 88.4±9.6 0.120

BMI (kg/m

2

) 24.5±3.4 23.9±2.9 25.0±3.6 <0.001

SBP (mmHg) 123.9±15.8 124.4±16.3 1 23.6±15.4 0.590

DBP (mmHg) 80.3±9.3 80.7±9.6 80.0±9.1 0.420

PPr (mmHg) 043.6±11.6 043.6±12.4 043.6±11.1 0.940

HR (bpm) 67.9±9.4 67.1±9.7 68.4±9.1 0.160

Blood chemistry (mg/dL)

FBG 098.7±27.6 100.2±30.2 097.6±25.5 0.320

TC 186.9±38.0 177.7±36.3 193.7±37.8 <0.001

TG 147.0±87.6 151.3±90.9 143.8±85.1 0.370

HDL-C 049.8±11.8 048.7±12.4 050.5±11.2 0.110

LDL-C 100.4±32.9 091.1±32.3 107.2±31.8 <0.001

Smoking, n (%) None 112 (57.7) 256 (96.2) <0.001

Smoker 082 (42.3) 10 (3.8)

Data are reported as means±SD, p by Chi-square test for smoking status. WC: waist circumference, BMI: body mass index, SBP: systolic blood

pressure, DBP: diastolic blood pressure, HR: heart rate, FBG: fasting blood glucose, TC: total cholesterol, TG: triglyceride, HDL-C: high density

lipoprotein-cholesterol, LDL-C: low density lipoprotein-cholesterol

(4)

subjects (Table 3).

The relevance of left ventricular mass index and bone mineral density

Separate analyses were conducted for men and women due to their different general characteristics. BMD correlated with baPWV, carotid IMT and LVMI in female subjects (Table 4)

(Fig. 1). Five models were used to estimate the relevance of LV- MI and BMD (Table 5 and 6). The first model adjusted for age, current smoking, BMI and SBP (smoking was not adjusted in females due to low prevalence of smokers among female sub- jects) showed that although BMI and SBP were independent determinants of LVMI in male subjects, BMD was not an in- dependent factor. However, in female subjects, BMD was an Table 2. Bone mineral density, carotid IMT, baPWV and echocardiographic findings of the population as a whole and divided into groups ac- cording to sex

Total (n=460) Male (n=194) Female (n=266) p

BMD (g/cm

2

) 000.47±0.13 000.51±0.11 000.44±0.13 <0.001

baPWV (cm/s) 1.510.8±271.0 1,539.3±265.0 1,490.0±273.9 0.050

Carotid IMT (mm) 000.63±0.18 000.65±0.18 000.61±0.17 0.030

Echocardiography

IVSd (mm) 0010.3±1.40 010.7±1.4 010.0±1.4 <0.001

LVIDd (mm) 0048.3±4.50 050.3±4.1 046.8±4.2 <0.001

LVPWTd (mm) 0008.8±1.20 009.1±1.1 008.7±1.3 <0.001

IVSs (mm) 0014.0±1.90 014.6±1.8 013.5±1.8 <0.001

LVIDs (mm) 0029.2±4.30 031.1±4.0 027.8±3.9 <0.001

LVPWT,s (mm) 0013.3±1.70 013.7±1.7 013.0±1.6 <0.001

AoD (mm) 0030.6±3.10 032.2±2.8 029.5±2.9 <0.001

LAD (mm) 0032.3±4.20 033.3±4.2 031.6±4.1 <0.001

E (cm/s) 0067.8±17.6 0065.7±18.2 0069.4±17.0 0.030

A (cm/s) 0074.3±16.1 0070.8±15.5 0076.9±16.0 <0.001

DT (ms) 0201.1±35.2 0203.9±38.2 0199.0±32.8 0.150

IVRT (ms) 0075.8±11.9 0076.3±12.3 0075.5±11.6 0.470

LVMI (g/m

2.7

) 0047.8±11.4 0047.1±10.7 0048.3±11.8 0.260

Data are reported as mean±SD. BMD: bone mineral density, IMT: intima-media thickness, baPWV: brachial ankle pulse wave velocity, IVSds:

interventricular septal thickness diastole, systole, LVIDds: left ventricular internal dimension diastole, systole, LVPWTd,s: left ventricular pos- terior wall thickness diastole, systole, AoD: aortic diameter, LAD: left atrial dimension, E: early diastolic peak velocity, A: late diastolic peak ve- locity, DT: deceleration time, IVRT: isovolumic relaxation time, LVMI: left ventricular mass index

Table 3. Pearson’s correlation coefficients between BMD and clinical parameters, and clinical predictors of BMD in stepwise multiple linear re- gression analysis

Parameters

BMD

Total (n=460) Male (n=194) Female (n=266)

r β r β r β

Sex -0.288* -0.312*

Age -0.246* -0.182* -0.121

-0.092 -0.356* -0.248*

BMI -0.067 -0.382* -0.072 -0.181 -0.149

-0.428*

WC -0.083

-0.342* -0.003 -0.186 -0.103

-0.376*

SBP -0.051 -0.025 -0.034 -0.001 -0.126

-0.036

DBP -0.075 -0.022 -0.106 -0.078 -0.040 -0.021

PPr -0.129

-0.050 -0.037 -0.016 -0.209* -0.104

FBG -0.040 -0.021 -0.018 -0.005 -0.114

-0.043

HDL -0.041 -0.017 -0.034 -0.042 -0.011 -0.010

LDL -0.187* -0.083

-0.093 -0.084 -0.148

-0.062

Adjusted R

2

(%) 19.5 20.3 20.1

*p<0.001,

p<0.01,

p<0.05. BMD: bone mineral density, BMI: body mass index, WC: waist circumference, SBP: systolic blood pressure, DBP: dia-

stolic blood pressure, PPr: pulse pressure, FBG: fasting blood glucose, HDL: high density lipoprotein, LDL: low density lipoprotein

(5)

independent determinant of LVMI (β=-22.123, p<0.0001). In model 2, additional variables such as abdominal circumfer- ence, fasting glucose and lipid profile were included. In model 2, although BMD did not have an effect in males, BMD (β=

-18.659, p=0.01) was an independent determinant for LVMI along with BMI and SBP in female subjects. In models 3 and 4, after adjusting the clinical parameters in model 2, the in- dividual effects of arterial stiffness parameters such as baPWV and carotid IMT on LVMI were evaluated. Although baPWV was not related to LVMI, carotid IMT showed an independent effect on LVMI in both male and female subjects (β=10.262, p<0.018, β=21.456, p<0.0001, respectively). Finally, in model 5, the relationship between BMD and LVMI was evaluated, after adjusting not only previous clinical parameters noted ab- ove but also baPWV and carotid IMT. BMD did not have an ef- fect in male subjects (β=-1.235, p=0.841). However, it was a ne- gative determinant for LVMI in female subjects, along with BMI and carotid IMT (β=-13.703, p=0.016).

Discussion

The main finding of the study is that BMD is a consistent determinant of LVMI in postmenopausal female subjects. Fur- thermore, BMD is independent of BMI, blood pressure, che- mistry profiles, and the parameters of arterial stiffness such as carotid IMT and baPWV in determining LVMI. This finding suggests that the pathophysiological concept derived from primary hyperparathyroidism can be applied to the relation- ship between BMD and LVMI in postmenopausal female pa- tients. In primary hyperparathyroidism, increased serum cal- cium and osteoporosis could lead to hypertrophy of the car- diomyocytes and vascular endothelial cell dysfunction, finally resulting in cardiac diastolic dysfunction and cardiac hyper- trophy.

10)

It is well known that LVMI is determined not only by hemodynamic factors, such as systolic blood pressure and ar- terial stiffness, but also by non-hemodynamic factors such as obesity. BMD is a non-hemodynamic factor and the interpre- tation of the relationship with LVMI could be confounded by many factors. For optimal adjustment of hemodynamic fac- tors, we included baPWV and carotid IMT, which are stiffness parameters for peripheral or central arteries, respectively, in the multiple regression model. This was important because arterial stiffness may have clinical relevance in the age (59.4

±12.4 years) of this study population.

In this study, BMD as a non-hemodynamic factor that sh- owed correlation with LVMI in female subjects only (Table 4) (Fig. 1). According to the stepwise multiple linear regression analysis compensated with various clinical parameters along with baPWV and carotid IMT, BMD was a consistent and independent determinant for LVMI in female subjects (Table 6). These findings are comparable to that in previous studies, which reported that non-hemodynamic factors were more important in female subjects.

19)20)

Although more study is needed to clarify the causal relationship between low BMD and LVMI in postmenopausal women, hormonal changes in this population may be a possibility. For example, a change in hormones, including OPG in postmenopausal women, is involved in LV hypertrophy and vascular calcification as well as reduction in bone mass.

11)21)22)

The relationship between BMD and baPWV or carotid IMT was also more definite in female subjects (Fig. 1). BMD was a greater determinant in cardiovascular change in female sub- jects, compared to male subjects. The difference between sex- es may be explained by the following clinical characteristics:

BMI was higher in female subjects (25.0±3.6 vs. 23.9±2.9, p<

0.001), LDL was also higher (107.2±31.8 vs. 91.1±32.3, p<

0.001) and BMD was lower compared to male subjects (0.44±

0.13 g/cm

2

vs. 0.51±0.11 g/cm

2

, p<0.001). Generally, in sub- jects of this age group (59.4±12.4 years), BMD is lower in fe- male compared to male subjects, and this could be due to dif- ferences in hormonal changes at this age.

According to the findings of our study, low BMD has harm- ful effects on the vascular structure and/or stiffness. Subse- quently, increased arterial stiffness may contribute to LV hy- pertrophy. But considering that the effects of low BMD on LVH are independent, even after adjusting baPWV and ca- rotid IMT, suggestive that low BMD could have direct influ- ence on LV hypertrophy.

These results attribute to previous reports on the possibility of osteoporosis as a risk factor for cardiovascular disease.

6)7)

Moreover, osteopenia or osteoporosis and atherosclerotic vas- cular disease (coronary artery disease, ischemic stroke, or pe- ripheral arterial disease) are common conditions in postme- nopausal women.

23)24)

Osteoporosis and vascular calcification have been largely attributed to the aging process. However, recent studies have shown that arterial calcification is a highly Table 4. Pearson’s correlation coefficients between BMD and LVMI, baPWV and carotid IMT in subjects

Variables

BMD

Total (n=460) Male (n=194) Female (n=266)

r p r p r p

baPWV -0.195 <0.001 -0.094 0.191 -0.318 <0.001

Carotid IMT -0.201 <0.001 -0.061 0.400 -0.373 <0.001

LVMI (g/m

2.7

) -0.163 <0.001 -0.007 0.918 -0.243 <0.001

BMD: bone mineral density, baPWV: brachial ankle pulse wave velocity, IMT: intima-media thickness, LVMI: left ventricular mass index

(6)

regulated process, with intriguing similarities to bone turn- over that may be age-independent.

25)26)

In a previous study, low BMD was associated with increased risk of ischemic st- roke, and was found to be a possible predictor for first stroke among older women.

27)28)

In another study, osteoporosis was

linked to peripheral arterial disease independent of age and gender,

29)

and low BMD correlated with ankle-brachial in- dexes.

30)

In our study, we also found that in postmenopausal women, low BMD contributes to central and peripheral vas- cular stiffness, which are reflected by carotid IMT and baP-

Fig. 1. Correlation between bone mineral density (BMD) and brachial ankle pulse wave velocity (baPWV), carotid intima-media thickness (IMT) and left ventricular mass index (LVMI).

0.800

0.600

0.400

0.200

0.800

0.600

0.400

0.200

R

2

=5.591E-5 R

2

=0.059

LVMI LVMI

BMD vs. LVMI Male

BMD vs. LVMI Female

BM D BM D

20.00 30.00 40.00 50.00 60.00 70.00 80.00 20.00 40.00 60.00 80.00 100.00 0.800

0.600

0.400

0.200

0.800

0.600

0.400

0.200

R

2

=0.004 R

2

=0.139

Carotid IMT Carotid IMT

BMD vs. carotid IMT Male

BMD vs. carotid IMT Female

BM D BM D

0.25 0.50 0.75 1.00 1.25 0.25 0.50 0.75 1.00 1.25 0.800

0.600

0.400

0.200

0.800

0.600

0.400

0.200

R

2

=0.009 R

2

=0.101

baPWV baPWV

BMD vs. baPWV Male

BMD vs. baPWV Female

BM D BM D

900.00 1200.00 1500.00 1800.00 2100.00 900.00 1200.00 1500.00 1800.00 2100.00

(7)

WV, respectively. Moreover, we found that decrease in BMD has a weak, but definite contribution to increase in LVMI, leading to LVH even before osteoporosis sets place in post- menopausal women. From the standpoint of clinical relevance, the consistent relationship with relatively low strength between BMD, cardiac and vascular surrogates suggests that more evi- dence is needed for bone mineral metabolism to be general- ly accepted as a clinically valuable mechanism for cardiac and vascular health.

This study was a cross sectional analysis and BMD was meas- ured by bone sonometer in the calcaneal bone, not the lum- bar spine or femur neck, which limit result interpretation.

For a hard endpoint on this subject, a large scale prospective study is warranted. However, this study gives us insights into the relationship between BMD and various cardiovascular parameters in postmenopausal female subjects. We found that BMD serves as a consistent and independent factor in deter- mining LVMI, baPWV and carotid IMT in postmenopausal female subjects.

Acknowledgments

This study was supported by the Functional Human Genome Project of Korea funded by the Korean government (MEST, Basic Research Pro- motion Fund, FG01-0400-018-0-0-0) and the Research Fund of Hanyang University Institute of Aging Society in 2010.

Table 5. Multivariate analysis of between LVMI and clinical parameters in male subjects

Model 1 Model 2 Model 3 Model 4 Model 5

β p β p β p β p β p

Age -0.145 0.0180 -0.091 0.1570 -0.110 0.0920 -0.045 0.4920 -0.064 0.3390

Smoking -1.101 0.4540 -0.859 0.5620 -0.950 0.5200 -0.951 0.5140 -1.038 0.4770

BMI -1.012 <0.0001 -1.188 0.0190 -1.103 0.0300 -1.122 0.0240 -1.030 0.0410

WC -0.015 0.9300 -0.038 0.8290 -0.012 0.9460 -0.034 0.8460

SBP -0.194 <0.0001 -0.319 <0.0001 -0.365 <0.0001 -0.295 <0.0001 -0.347 <0.0001

DBP -0.339 0.0020 -0.362 0.0010 -0.292 0.0060 -0.314 0.0040

FBG -0.009 0.7170 -0.016 0.5120 -0.004 0.8770 -0.012 0.6160

HDL-C -0.019 0.7590 -0.023 0.6990 -0.031 0.6090 -0.036 0.5470

LDL-C -0.012 0.6050 -0.012 0.6040 -0.029 0.2170 -0.030 0.1980

baPWV -0.004 0.2200 -0.005 0.1490

cIMT 10.262 0.0180 10.766 0.0130

BMD -1.428 0.8200 -0.362 0.9540 -1.235 0.8410

Adjusted R

2

(%) 18.9 23.4 24.0 25.7 26.6

LVMI: left ventricular mass index, BMI: body mass index, WC: waist circumference, SBP: systolic blood pressure, DBP: diastolic blood pressure, FBG: fasting blood glucose, HDL-C: high density lipoprotein-cholesterol, LDL-C: low density lipoprotein-cholesterol, baPWV: brachial ankle pulse wave velocity, cIMT: carotid intima-media thickness, BMD: bone mineral density

Table 6. Multivariate analysis between LVMI and the clinical parameters in female subjects

Model 1 Model 2 Model 3 Model 4 Model 5

β p β p β p β p β p

Age 0.097 0.0820 -0.073 0.204 -0.109 0.060 -0.045 0.423 -0.020 0.723

BMI 1.066 <0.0001 -0.806 0.014 -0.627 0.068 -0.783 0.012 -0.949 0.005

WC -0.154 0.205 -0.216 0.085 -0.140 0.231 -0.088 0.468

SBP 0.088 0.0540 -0.149 0.018 -0.145 0.041 -0.112 0.071 -0.105 0.122

DBP -0.181 0.095 -0.204 0.066 -0.162 0.127 -0.148 0.160

FBG -0.008 0.750 -0.006 0.817 -0.011 0.655 -0.013 0.604

HDL-C -0.026 0.661 -0.026 0.669 -0.017 0.764 -0.018 0.748

LDL-C -0.022 0.309 -0.027 0.229 -0.006 0.781 -0.005 0.823

baPWV -0.003 0.421 -0.000 0.913

cIMT 21.456 <0.0001 -19.392 <0.0001

BMD -22.123 <0.0001 -18.659 0.001 -13.703 0.016

Adjusted R

2

(%) 20.9 23.0 26.9 28.5

LVMI: left ventricular mass index, BMI: body mass index, WC: waist circumference, SBP: systolic blood pressure, DBP: diastolic blood pressure,

FBG: fasting blood glucose, HDL-C: high density lipoprotein-cholesterol, LDL-C: low density lipoprotein-cholesterol, baPWV: brachial ankle

pulse wave velocity, cIMT: carotid intima-media thickness, BMD: bone mineral density

(8)

REFERENCES

1) Levy D, Garroson RJ, Savage DD, Kannel WB, Castelli WP. Prognos- tic implications of echocardiographically determined left ventricular mass in the Framingham Heart Study. N Engl J Med 1990;322:1561-6.

2) Verdecchia P, Schillaci G, Borgioni C, et al. Prognostic significance of serial changes in left ventricular mass in essential hypertension. Cir- culation 1998;97:48-54.

3) Turakhia MP, Schiller NB, Whooley MA. Prognostic significance of increased left ventricular mass index to mortality and sudden death in patients with stable coronary heart disease (from the Heart and Soul St- udy). Am J Cardiol 2008;102:1131-5.

4) Lim YH, Lee JU, Kim KS, et al. Association between inappropriate- ness of left ventricular mass and left ventricular diastolic dysfunction:

a study using the tissue Doppler parameter, E/E’. Korean Circ J 2009;

39:138-44.

5) de Simone G, Devereux RB, Daniels SR, Koren MJ, Meyer RA, Lar- agh JH. Effect of growth on variability of left ventricular mass: assess- ment of allometric signals in adults and children and their capacity to predict cardiovascular risk. J Am Coll Cardiol 1995;25:1056-62.

6) Marcovitz PA, Tran HH, Franklin BA, et al. Usefulness of bone min- eral density to predict significant coronary artery disease. Am J Cardiol 2005;96:1059-63.

7) Ness J, Aronow WS. Comparison of prevalence of atherosclerotic vas- cular disease in postmenopausal women with osteoporosis or osteope- nia versus without osteoporosis or osteopenia. Am J Cardiol 2006;97:

1427-8.

8) von der Recke P, Hansen MA, Hassager C. The association between low bone mass at the menopause and cardiovascular mortality. Am J Med 1999;106:273-8.

9) Samelson EJ, Kiel DP, Broe KE, et al. Metacarpal cortical area and risk of coronary heart disease: the Framingham Study. Am J Epidemiol 2004;

159:589-95.

10) Andersson P, Rydberg E, Willenheimer R. Primary hyperparathyroid- ism and heart disease: a review. Eur Heart J 2004;25:1776-87.

11) Persy V, D’Haese P. Vascular calcification and bone disease: the calci- fication paradox. Trends Mol Med 2009;15:405-16.

12) Devereux RB, Alonso DR, Lutas EM, et al. Echocardiographic assess- ment of left ventricular hypertrophy: comparison to necropsy findings.

Am J Cardiol 1986;57:450-8.

13) Shin J, Kim KS, Kim SK, et al. Influences of body size and cardiac work- load on the left ventricular mass in healthy Korean adults with normal body weight and blood pressure. Korean Circ J 2005;35:335-40.

14) Sohn DW, Choi YJ, Oh BH, Lee MM, Lee YW. Estimation of left ven- tricular end-diastolic pressure with the difference in pulmonary venous and mitral A durations is limited when mitral E and A waves are over- lapped. J Am Soc Echocardiogr 1999;12:106-12.

15) Frost ML, Blake GM, Fogelman I. Quantitative ultrasound and bone mi- neral density are equally strongly associated with risk factors for osteo- porosis. J Bone Miner Res 2001;16:406-16.

16) Kim YK, Lee MY, Rhee MY. A simple oscilometric measurement of pu- lse wave velocity: comparison with conventional tonometric measure- ment. Korean J Med 2004;67:597-606.

17) Bots ML, Hoes AW, Koudstaal PJ, Hofman A, Grobbee DE. Common carotid intima-media thickness and risk of stroke and myocardial in- farction: the Rotterdam Study. Circulation 1997;96:1432-7.

18) Heiss G, Sharrett AR, Barnes R, Chambless LE, Szklo M, Alzola C.

Carotid atherosclerosis measured by B-mode ultrasound in popula- tions: associations with cardiovascular risk factors in the ARIC study.

Am J Epidemiol 1991;134:250-6.

19) Krauser DG, Devereux RB. Ventricular hypertrophy and hyperten- sion: prognostic elements and implications for management. Herz 2006;

31:305-16.

20) Saitoh M, Nishimura H, Tanaka T, Kondoh T. Gender-related differ- ences in target organ damage in untreated patients with essential hyper- tension. Intern Med 2006;45:377-83.

21) Price PA, June HH, Buckley JR, Williamson MK. Osteoprotegerin in- hibits artery calcification induced by warfarin and by vitamin D. Arter- ioscler Thromb Vasc Biol 2001;21:1610-6.

22) Collin-Osdoby P. Regulation of vascular calcification by osteoclast re- gulatory factors RANKL and osteoprotegerin. Circ Res 2004;95:

1046-57.

23) Bello N, Mosca L. Epidemiology of coronary heart disease in women.

Prog Cardiovasc Dis 2004;46:287-95.

24) Feigin VL, Lawes CM, Bennett DA, Anderson CS. Stroke epidemio- logy: a review of population-based studies of incidence, prevalence, and case-fatality in the late 20th century. Lancet Neurol 2003;2:43-53.

25) Doherty TM, Asotra K, Fitzpatrick LA, et al. Calcification in athero- sclerosis: bone biology and chronic inflammation at the arterial cross- roads. Proc Natl Acad Sci U S A 2003;100:11201-6.

26) Tintut Y, Demer LL. Recent advances in multifactorial regulation of vascular calcification. Curr Opin Lipidol 2001;12:555-60.

27) Browner WS, Pressman AR, Nevitt MC, Cauley JA, Cummings SR. As- sociation between low bone density and stroke in elderly women: the study of osteoporotic fractures. Stroke 1993;24:940-6.

28) Jorgensen L, Engstad T, Jacobsen BK. Bone mineral density in acute stroke patients: low bone mineral density may predict first stroke in women. Stroke 2001;32:47-51.

29) Pennisi P, Signorelli SS, Riccobene S, et al. Low bone density and ab- normal bone turnover in patients with atherosclerosis of peripheral vessels. Osteoporos Int 2004;15:389-95.

30) Vogt MT, Cauley JA, Kuller LH, Nevitt MC. Bone mineral density and blood flow to the lower extremities: the study of osteoporotic fractures.

J Bone Miner Res 1997;12:283-9.

수치

Table 3. Pearson’s correlation coefficients between BMD and clinical parameters, and clinical predictors of BMD in stepwise multiple linear re- re-gression analysis
Fig. 1. Correlation between bone mineral density (BMD) and brachial ankle pulse wave velocity (baPWV), carotid intima-media thickness  (IMT) and left ventricular mass index (LVMI).
Table 5. Multivariate analysis of between LVMI and clinical parameters in male subjects

참조

관련 문서

Therefore, this study aims to identify the relations between gastroesophageal reflux disease and body mass index, and waist measurement as indexes of obesity.. For the

Chapter 3 identifies phonological conditions of each phonological phenomenon and analyses correlations between social variables such as style of speech, age,

First, when examining the differences in body composition between judo specialists and active sports participants, the BMI index and body fat mass were lower

In music appreciation education, optical appreciation through multimedia data such as movies, animations, or slides as well as listening can increase the

~ a volume which is fixed in space and through whose boundary matter, mass, momentum, energy can flow. ~ The boundary of control volume is

Bone mineral content (BMC) and bone mineral density (BMD) of the lumbar spine, total hip, and proximal femur were measured before and after exercise... Results : 1) Body

• For example, if a bar made of the same material is divided in to several small pieces (of any shape and size) and the density (weight or mass / volume) of each piece

void makeTree(Object root, Object left, Object right): Creates a binary tree with root as the root element, left as the left subtree, right as the right