D I A B E T E S & M E T A B O L I S M J O U R N A L
This is an Open Access article distributed under the terms of the Creative Commons Attribution Non-Commercial License (http://creativecommons.org/licenses/by-nc/4.0/) which permits unrestricted non-commercial use, distribution, and reproduction in any medium, provided the original work is properly cited.
Association between Change in Alcohol Consumption and Metabolic Syndrome: Analysis from the Health Examinees Study
Seulggie Choi1, Kyuwoong Kim1, Jong-Koo Lee2,3, Ji-Yeob Choi4, Aesun Shin4, Sue Kyung Park1,4, Daehee Kang1,4,5, Sang Min Park1,2
1Department of Biomedical Sciences, Seoul National University Graduate School, Seoul,
2Department of Family Medicine, Seoul National University Hospital, Seoul National University College of Medicine, Seoul,
3JW Lee Center for Global Medicine, 4Department of Preventive Medicine, Seoul National University College of Medicine, Seoul,
5Department of Environmental Medicine, Seoul National University Medical Research Center, Seoul, Korea
Background: The association between change in alcohol intake and metabolic syndrome is unclear.
Methods: This retrospective cohort consisted of 41,368 males and females from the Health Examinees-GEM study. Participants were divided into non-drinkers (0.0 g/day), light drinkers (male: 0.1 to 19.9 g/day; female: 0.1 to 9.9 g/day), moderate drinkers (male: 20.0 to 39.9 g/day; female: 10.0 to 19.9 g/day), and heavy drinkers (male: ≥40.0 g/day; female: ≥20.0 g/day) for each of the initial and follow-up health examinations. Logistic regression analysis was used to determine the adjusted odds ratios (aORs) and 95% confidence intervals (CIs) for developing metabolic syndrome according to the change in alcohol consumption between the initial and follow-up health examinations. Adjusted mean values for the change in waist circumference, fasting serum glucose (FSG), blood pressure, triglycerides, and high density lipoprotein cholesterol (HDL-C) levels were determined according to the change in alcohol consumption by linear regression analysis.
Results: Compared to persistent light drinkers, those who increased alcohol intake to heavy levels had elevated risk of metabolic syndrome (aOR, 1.45; 95% CI, 1.09 to 1.92). In contrast, heavy drinkers who became light drinkers had reduced risk of metabolic syndrome (aOR, 0.61; 95% CI, 0.44 to 0.84) compared to persistent heavy drinkers. Increased alcohol consumption was associat- ed with elevated adjusted mean values for waist circumference, FSG, blood pressure, triglycerides, and HDL-C levels (all P<0.05).
Reduction in alcohol intake was associated with decreased waist circumference, FSG, blood pressure, triglycerides, and HDL-C levels among initial heavy drinkers (all P<0.05).
Conclusion: Heavy drinkers who reduce alcohol consumption could benefit from reduced risk of metabolic syndrome.
Keywords: Alcohol drinking; Dyslipidemias; Hypertension; Metabolic syndrome; Obesity
Corresponding author: Sang Min Park https://orcid.org/0000-0002-7498-4829 Department of Biomedical Sciences and Family Medicine, Seoul National University College of Medicine, 101 Daehak-ro, Jongno-gu, Seoul 03080, Korea
E-mail: [email protected]
INTRODUCTION
Metabolic syndrome is a constellation of clinical features linked with metabolic abnormalities, which consist of abdomi- nal obesity, impaired fasting glucose, hypertension, and dyslip- idemia. Metabolic syndrome has become a major problem in public health, with a prevalence rate of 20% to 25% among adults worldwide [1]. As metabolic syndrome is associated
with elevated risk of developing type 2 diabetes mellitus, car- diovascular disease, and all-cause mortality, modifiable risk factors for metabolic syndrome must be determined and man- aged [2]. Particularly, as lifestyle modification is the primary method of management for metabolic syndrome [3], identify- ing health behaviors that may influence the risk of metabolic syndrome is imperative.
Alcohol consumption, one of the most common health-re- https://doi.org/10.4093/dmj.2018.0128
pISSN 2233-6079 · eISSN 2233-6087
lated behaviors, has previously been shown to be associated with metabolic syndrome. While some studies have shown that alcohol consumption is associated with reduced risk of metabolic syndrome [4,5], a recent meta-analysis consisting of six prospective studies has shown that moderate to heavy levels of alcohol intake is associated with elevated risk of metabolic syndrome [6]. Previous studies, however, measured alcohol in- take only once and assumed that alcohol consumption did not change over time. Therefore, it is yet unclear whether lowering alcohol intake leads to reduced risk of metabolic syndrome, or that increases in alcohol consumption is associated with ele- vated metabolic syndrome risk.
In this study, we investigated the association between change in alcohol consumption and metabolic syndrome among a large population using the Health Examinees-GEM (HEXA- G) study. Furthermore, the impact of change in alcohol intake on individual components of metabolic syndrome were deter- mined.
METHODS
Participants
The study population is derived from the HEXA-G study con- ducted in Korea. The HEXA-G database is a community-based multicenter study consisting of males and females aged 40 to 69 years who underwent health examinations between 2004 and 2013. Multiple epidemiological studies have used HEXA- G previously [7-10] and its validity has been demonstrated in detail elsewhere [10,11]. Among 65,642 participants who un- derwent health examinations twice, 319, 14, 5, 99, and 1,680 participants without information on waist circumference, tri- glyceride, high density lipoprotein cholesterol (HDL-C), blood pressure, and fasting serum glucose (FSG) were excluded, re- spectively. An additional 1,274 participants who did not re- spond to questions on alcohol consumption were further ex- cluded. Finally, 14,813 and 6,070 participants who were diag- nosed with metabolic syndrome during the first health exami- nation and with missing values on covariates were excluded, respectively. The final study population consisted of 41,368 participants. This study is not a clinical trial and does not need to be registered.
Ethics
This study was approved by the Institutional Review Board of Seoul National University Hospital (IRB number: 1503-103-
657). During recruitment, all participants signed a voluntary consent form before study entry. The HEXA-G study complies with the principles of the Declaration of Helsinki.
Key variables
Alcohol consumption was determined based on a self-reported questionnaire the participants answered during each health ex- amination. The participants responded to questions on the fre- quency (sittings per week) and amount (drinks per sitting) of alcohol consumed for soju (a popular Korean alcoholic bever- age), beer, rice wine, wine, fruit wine, and hard liquor. The amount of alcohol consumed in grams per day for each alcohol- ic beverage type were calculated, after which the total amount of alcohol consumed was determined for each participant [12].
From this, the participants were divided into non-drinkers (0.0 g/day), light drinkers (0.1 to 19.9 g/day for males, 0.1 to 9.9 g/day for females), moderate drinkers (20.0 to 39.9 g/day for males, 10 to 19.9 g/day for females), and heavy drinkers (≥40.0 g/day for males, ≥20.0 g/day for females) for each of the initial and follow-up health examinations (Supplementary Fig. 1) [13].
The primary endpoint was metabolic syndrome, which did not change during the course of the research. Metabolic syn- drome was determined based on the National Cholesterol Edu- cation Program Adult Treatment Panel III (NCEP-ATP III) crite- ria modified for Asian populations [14]. Participants were diag- nosed with metabolic syndrome if they met three of the follow- ing five conditions: waist circumference of ≥90 cm for males and
≥80 cm for females, triglyceride levels of ≥150 mg/dL or taking lipid-lowering drugs, HDL-C levels of <40 mg/dL for males and
<50 mg/dL for females, blood pressure of ≥130/85 mm Hg or taking anti-hypertensive drugs, and FSG levels of ≥100 mg/dL or taking anti-diabetic drugs. The presence of metabolic syndrome was determined for each participant during the initial and fol- low-up health examinations.
Statistical analysis
Chi-square test for categorical variables and analysis of vari- ance for continuous variables were used to determine the dif- ference in descriptive characteristics according to secondary alcohol consumption. We conducted logistic regression analy- sis to determine the adjusted odds ratios (aORs) and 95% con- fidence intervals (CIs) of developing metabolic syndrome dur- ing the follow-up examination according to the change in alco- hol consumption between the initial and follow-up health ex- aminations. Furthermore, we also determined adjusted mean
values of the change in waist circumference, FSG, blood pres- sure, triglycerides, and HDL-C levels according to the change in alcohol consumption by linear regression analysis.
The differences in the descriptive characteristics according to initial alcohol consumption were determined by the chi- square test for categorical variables and analysis of variance for continuous variables. For all analyses, participants without changes in alcohol consumption (e.g., initial non-drinkers to follow-up non-drinkers) were the reference group. For both logistic and linear regression analyses, the aORs and adjusted mean values were determined after adjustments for covariates.
The covariates considered were age (continuous, years), sex (categorical, male and female), household income (categorical, first, second, third, and fourth quartiles), education (categori- cal, elementary school or below, middle school, high school, and college or higher), physical activity (categorical, yes and no), smoking (categorical, never smoker, quitter, and continual smoker), total energy intake (continuous, kcal per day), body mass index (continuous, kg/m2), past history of cardiovascular disease (categorical, no and yes), family history of hyperten- sion, diabetes, and dyslipidemia (categorical, no and yes), fol- low-up duration (continuous, years), and baseline metabolism risk score (categorical, 0, 1, and 2). Body mass index was calcu- lated by dividing the weight in kilograms by the height in me- ters squared and was not adjusted for when determining the association of change in waist circumference according to al- cohol consumption change.
Statistical significance was defined as a P<0.05 in a two-sid- ed manner. All data collection and analysis were conducted using SAS version 9.4 (SAS Institute Inc., Cary, NC, USA) and STATA version 13.0 (StataCorp LP, College Station, TX, USA).
RESULTS
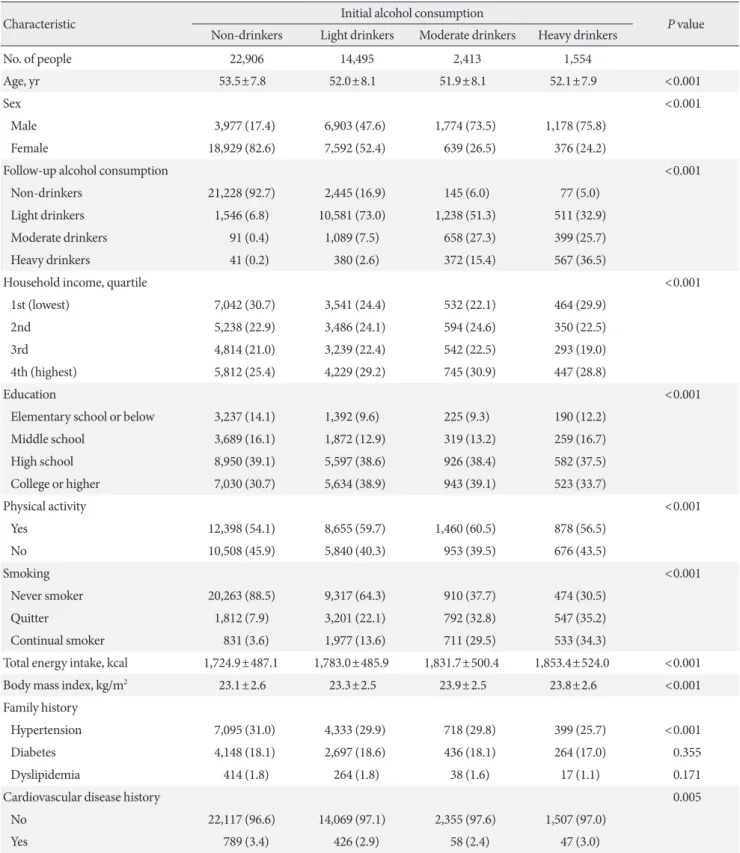
Table 1 depicts the descriptive characteristics of the study pop- ulation during the initial health examination. The number of initial non-drinkers, light drinkers, moderate drinkers, and heavy drinkers are 22,906, 14,495, 2,413, and 1,554, respective- ly. The mean±standard deviation values of age for non-drink- ers, light drinkers, moderate drinkers, and heavy drinkers are 53.5±7.8, 52.0±8.1, 51.9±8.1, and 52.1±7.9 years, respectively.
Compared to initial non-drinkers, heavy drinkers tended to have a higher proportion of males, be heavy drinkers during the follow-up examination, have higher levels of education, be continual smokers, have higher total energy intake, have great-
er body mass index, and not have a past history of cardiovas- cular disease or a family history of hypertension (all P<0.001).
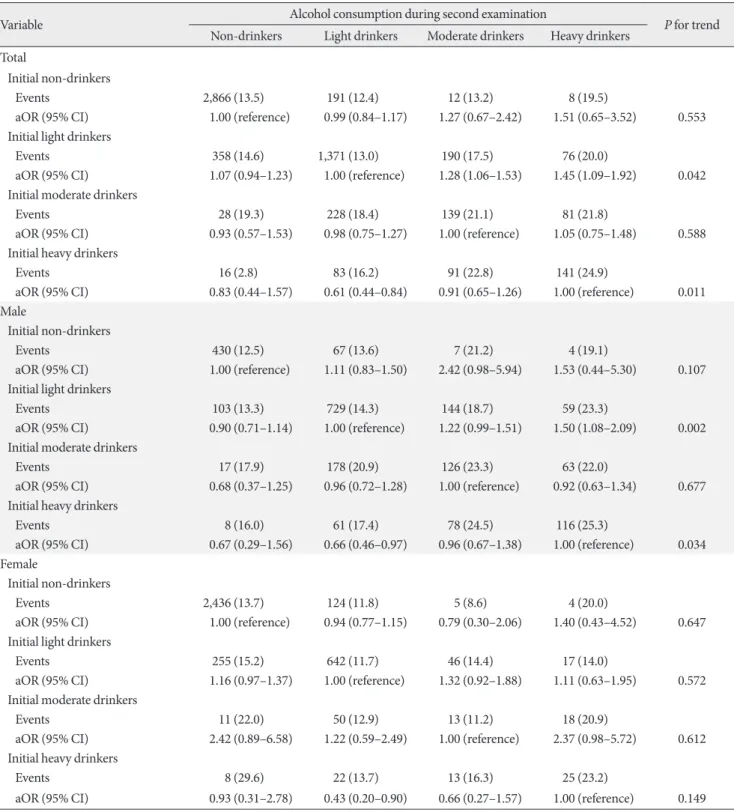
The association between change in alcohol consumption and metabolic syndrome according to baseline alcohol consump- tion is shown in Table 2. Light drinkers who increased alcohol consumption to moderate and heavy levels had elevated risk of metabolic syndrome ([aOR, 1.28; 95% CI, 1.06 to 1.53] and [aOR, 1.45; 95% CI, 1.09 to 1.92], respectively) compared to persistent light drinkers. Among initial light drinkers, increas- es in alcohol consumption were associated with elevated risk for metabolic syndrome (P for trend 0.042). Compared to per- sistent heavy drinkers, those who reduced the amount of alco- hol to light levels had decreased risk of metabolic syndrome (aOR, 0.61; 95% CI, 0.44 to 0.84). Among initial heavy drink- ers, alcohol intake reduction was associated with decreased risk for metabolic syndrome (P for trend 0.011).
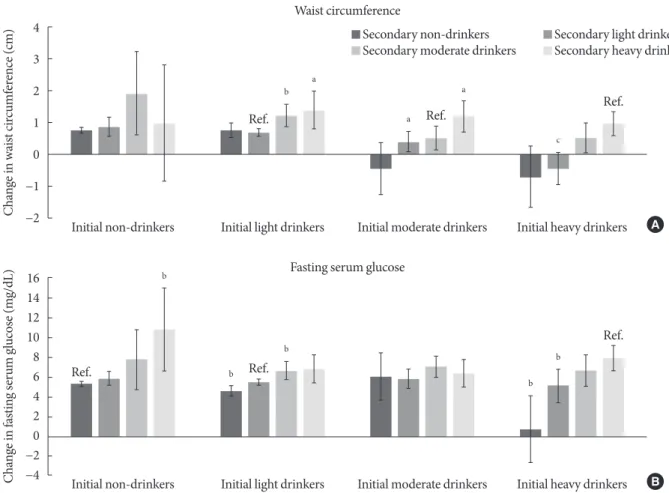
Fig. 1 shows the association between change in alcohol con- sumption and change in waist circumference or FSG. Com- pared to persistent light drinkers, those who increased alcohol consumption to moderate and heavy levels had elevated waist circumference (P=0.003 and P=0.017, respectively). Moderate drinkers who became non-drinkers had reduced waist circum- ference (P=0.032), while those who became heavy drinkers had elevated waist circumference (P=0.023). Compared to persis- tent heavy drinkers, those who reduced the amount of alcohol consumption to light levels had reduced waist circumference (P<0.001). Similarly, heavy drinkers who became non-drink- ers had reduced waist circumference compared to persistent heavy drinkers (P=0.001). Non-drinkers who became heavy drinkers had elevated FSG levels (P=0.009) compared to per- sistent non-drinkers. Light drinkers who became non-drinkers had reduced FSG levels (P=0.003) while those who became moderate drinkers had elevated FSG levels (P=0.007). Finally, compared to persistent heavy drinkers, those who became light and non-drinkers had decreased FSG levels (P=0.009 and P<0.001, respectively).
The associations between change in alcohol consumption and change in systolic or diastolic blood pressure are shown in Fig. 2. Light drinkers who increased alcohol consumption to moderate and heavy amounts had elevated systolic blood pres- sure (P=0.010 and P=0.003, respectively) compared to persis- tent light drinkers. Compared to persistent moderate drinkers, those who became light and non-drinkers had reduced systolic blood pressure (P=0.035 and P=0.001, respectively). Heavy drinkers who became moderate, light and non-drinkers had
Table 1. Descriptive characteristics of the study population
Characteristic Initial alcohol consumption
P value Non-drinkers Light drinkers Moderate drinkers Heavy drinkers
No. of people 22,906 14,495 2,413 1,554
Age, yr 53.5±7.8 52.0±8.1 51.9±8.1 52.1±7.9 <0.001
Sex <0.001
Male 3,977 (17.4) 6,903 (47.6) 1,774 (73.5) 1,178 (75.8)
Female 18,929 (82.6) 7,592 (52.4) 639 (26.5) 376 (24.2)
Follow-up alcohol consumption <0.001
Non-drinkers 21,228 (92.7) 2,445 (16.9) 145 (6.0) 77 (5.0)
Light drinkers 1,546 (6.8) 10,581 (73.0) 1,238 (51.3) 511 (32.9)
Moderate drinkers 91 (0.4) 1,089 (7.5) 658 (27.3) 399 (25.7)
Heavy drinkers 41 (0.2) 380 (2.6) 372 (15.4) 567 (36.5)
Household income, quartile <0.001
1st (lowest) 7,042 (30.7) 3,541 (24.4) 532 (22.1) 464 (29.9)
2nd 5,238 (22.9) 3,486 (24.1) 594 (24.6) 350 (22.5)
3rd 4,814 (21.0) 3,239 (22.4) 542 (22.5) 293 (19.0)
4th (highest) 5,812 (25.4) 4,229 (29.2) 745 (30.9) 447 (28.8)
Education <0.001
Elementary school or below 3,237 (14.1) 1,392 (9.6) 225 (9.3) 190 (12.2)
Middle school 3,689 (16.1) 1,872 (12.9) 319 (13.2) 259 (16.7)
High school 8,950 (39.1) 5,597 (38.6) 926 (38.4) 582 (37.5)
College or higher 7,030 (30.7) 5,634 (38.9) 943 (39.1) 523 (33.7)
Physical activity <0.001
Yes 12,398 (54.1) 8,655 (59.7) 1,460 (60.5) 878 (56.5)
No 10,508 (45.9) 5,840 (40.3) 953 (39.5) 676 (43.5)
Smoking <0.001
Never smoker 20,263 (88.5) 9,317 (64.3) 910 (37.7) 474 (30.5)
Quitter 1,812 (7.9) 3,201 (22.1) 792 (32.8) 547 (35.2)
Continual smoker 831 (3.6) 1,977 (13.6) 711 (29.5) 533 (34.3)
Total energy intake, kcal 1,724.9±487.1 1,783.0±485.9 1,831.7±500.4 1,853.4±524.0 <0.001
Body mass index, kg/m2 23.1±2.6 23.3±2.5 23.9±2.5 23.8±2.6 <0.001
Family history
Hypertension 7,095 (31.0) 4,333 (29.9) 718 (29.8) 399 (25.7) <0.001
Diabetes 4,148 (18.1) 2,697 (18.6) 436 (18.1) 264 (17.0) 0.355
Dyslipidemia 414 (1.8) 264 (1.8) 38 (1.6) 17 (1.1) 0.171
Cardiovascular disease history 0.005
No 22,117 (96.6) 14,069 (97.1) 2,355 (97.6) 1,507 (97.0)
Yes 789 (3.4) 426 (2.9) 58 (2.4) 47 (3.0)
Values are presented as mean±standard deviation or number (%). Non-drinkers (0.0 g/day), light drinkers (0.1–19.9 g/day for males, 0.1–9.9 g/day for females), moderate drinkers (20.0–39.9 g/day for males, 10.0–19.9 g/day for females), heavy drinkers (≥40.0 g/day for males, ≥20.0 g/day for fe- males). P values calculated by the chi-square test for categorical variables and analysis of variance for continuous variables.
Table 2. Association between change in alcohol consumption and metabolic syndrome
Variable Alcohol consumption during second examination
P for trend Non-drinkers Light drinkers Moderate drinkers Heavy drinkers
Total
Initial non-drinkers
Events 2,866 (13.5) 191 (12.4) 12 (13.2) 8 (19.5)
aOR (95% CI) 1.00 (reference) 0.99 (0.84–1.17) 1.27 (0.67–2.42) 1.51 (0.65–3.52) 0.553 Initial light drinkers
Events 358 (14.6) 1,371 (13.0) 190 (17.5) 76 (20.0)
aOR (95% CI) 1.07 (0.94–1.23) 1.00 (reference) 1.28 (1.06–1.53) 1.45 (1.09–1.92) 0.042 Initial moderate drinkers
Events 28 (19.3) 228 (18.4) 139 (21.1) 81 (21.8)
aOR (95% CI) 0.93 (0.57–1.53) 0.98 (0.75–1.27) 1.00 (reference) 1.05 (0.75–1.48) 0.588 Initial heavy drinkers
Events 16 (2.8) 83 (16.2) 91 (22.8) 141 (24.9)
aOR (95% CI) 0.83 (0.44–1.57) 0.61 (0.44–0.84) 0.91 (0.65–1.26) 1.00 (reference) 0.011 Male
Initial non-drinkers
Events 430 (12.5) 67 (13.6) 7 (21.2) 4 (19.1)
aOR (95% CI) 1.00 (reference) 1.11 (0.83–1.50) 2.42 (0.98–5.94) 1.53 (0.44–5.30) 0.107 Initial light drinkers
Events 103 (13.3) 729 (14.3) 144 (18.7) 59 (23.3)
aOR (95% CI) 0.90 (0.71–1.14) 1.00 (reference) 1.22 (0.99–1.51) 1.50 (1.08–2.09) 0.002 Initial moderate drinkers
Events 17 (17.9) 178 (20.9) 126 (23.3) 63 (22.0)
aOR (95% CI) 0.68 (0.37–1.25) 0.96 (0.72–1.28) 1.00 (reference) 0.92 (0.63–1.34) 0.677 Initial heavy drinkers
Events 8 (16.0) 61 (17.4) 78 (24.5) 116 (25.3)
aOR (95% CI) 0.67 (0.29–1.56) 0.66 (0.46–0.97) 0.96 (0.67–1.38) 1.00 (reference) 0.034 Female
Initial non-drinkers
Events 2,436 (13.7) 124 (11.8) 5 (8.6) 4 (20.0)
aOR (95% CI) 1.00 (reference) 0.94 (0.77–1.15) 0.79 (0.30–2.06) 1.40 (0.43–4.52) 0.647 Initial light drinkers
Events 255 (15.2) 642 (11.7) 46 (14.4) 17 (14.0)
aOR (95% CI) 1.16 (0.97–1.37) 1.00 (reference) 1.32 (0.92–1.88) 1.11 (0.63–1.95) 0.572 Initial moderate drinkers
Events 11 (22.0) 50 (12.9) 13 (11.2) 18 (20.9)
aOR (95% CI) 2.42 (0.89–6.58) 1.22 (0.59–2.49) 1.00 (reference) 2.37 (0.98–5.72) 0.612 Initial heavy drinkers
Events 8 (29.6) 22 (13.7) 13 (16.3) 25 (23.2)
aOR (95% CI) 0.93 (0.31–2.78) 0.43 (0.20–0.90) 0.66 (0.27–1.57) 1.00 (reference) 0.149 Values are presented as number (%). Non-drinkers (0.0 g/day), light drinkers (0.1–19.9 g/day for males, 0.1–9.9 g/day for females), moderate drinkers (20.0–39.9 g/day for males, 10.0–19.9 g/day for females), heavy drinkers (≥40.0 g/day for males, ≥20.0 g/day for females). Odds ratio calculated by logistic regression analysis after adjustments for age, sex, household income, education level, physical activity, smoking, total ener- gy intake, body mass index, past history of cardiovascular disease, family history of hypertension, diabetes, or dyslipidemia, follow-up duration, and baseline metabolism risk score.
aOR, adjusted odds ratio; CI, confidence interval.
reduced systolic blood pressure (P=0.002, P=0.015, and P<
0.001, respectively). Non-drinkers who elevated the amount of alcohol to heavy levels had increased diastolic blood pressure (P=0.023). Similarly, light drinkers who increased alcohol consumption to moderate and heavy amounts had elevated di- astolic blood pressure (P=0.005 and P=0.003, respectively).
Compared to persistent moderate drinkers, those who became light and non-drinkers had reduced diastolic blood pressure (P=0.045 and P=0.006, respectively). Finally, heavy drinkers who became moderate, light, and non-drinkers had decreased diastolic blood pressure (P=0.020, P=0.049, and P=0.003, re-
spectively).
Fig. 3 shows the associations between change in alcohol con- sumption and change in triglyceride or HDL-C levels. Non- drinkers who increased alcohol consumption to moderate lev- els had elevated triglyceride levels (P=0.007). On the other hand, compared to persistent moderate drinkers, those who be- came non-drinkers had reduced triglyceride levels (P=0.041), while those who increased the amount of alcohol consumed to heavy levels had higher triglyceride levels (P=0.041). Non- drinkers who became light, moderate, and heavy drinkers had elevated HDL-C levels (P<0.001, P=0.033, and P=0.001, re- Fig. 1. Association between change in alcohol consumption and change in waist circumference or fasting serum glucose. Adjust- ed mean values of change in (A) waist circumference or (B) fasting serum glucose were calculated for initial non-drinkers, light drinkers, moderate drinkers, and heavy drinkers according to follow-up alcohol consumption: non-drinkers (0.0 g/day), light drinkers (0.1 to 19.9 g/day for males, 0.1 to 9.9 g/day for females), moderate drinkers (20.0 to 39.9 g/day for males, 10.0 to 19.9 g/day for females), heavy drinkers (≥40.0 g/day for males, ≥20.0 g/day for females). Adjusted mean values determined by linear regres- sion analysis after adjustments for age, sex, household income, education level, physical activity, smoking, total energy intake, body mass index (excluded for analyses on change in waist circumference), past history of cardiovascular disease, family history of hypertension, diabetes, and dyslipidemia, and follow-up duration. Groups without change in alcohol consumption were con- sidered reference groups (e.g., initial non-drinkers to follow-up non-drinkers). P values for statistical significance: aP<0.05,
bP<0.01, cP<0.001.
4 3 2 1 0
−1
−2
16 14 12 10 8 6 4 2 0
−2
−4
Change in waist circumference (cm)Change in fasting serum glucose (mg/dL)
Initial non-drinkers
Initial non-drinkers
Initial light drinkers
Initial light drinkers
Initial moderate drinkers
Initial moderate drinkers
Initial heavy drinkers
Initial heavy drinkers Ref.
Ref.
Ref. Ref.
Ref.
b
b
b
b
b b
a a
c a
Ref.
Waist circumference
Secondary non-drinkers Secondary light drinkers Secondary moderate drinkers Secondary heavy drinkers
Fasting serum glucose
A
B
spectively) compared to persistent non-drinkers. Finally, com- pared to persistent heavy drinkers, heavy drinkers who became non-drinkers had reduced HDL-C levels (P<0.001).
DISCUSSION
In this large-scale longitudinal study, we have shown that in- creased alcohol consumption was associated with elevated risk of metabolic syndrome, while alcohol intake reduction was as- sociated with decreased risk of metabolic syndrome. Further-
more, increased alcohol consumption was associated with ele- vated waist circumference, FSG, blood pressure, triglyceride, and HDL-C levels while reduced consumption of alcohol was associated with decreased levels of each component of metabolic syndrome. Past studies were limited to measuring alcohol con- sumption at one point in time, while our study extended from previous investigations by determining the risk of metabolic syndrome according to the changes in alcohol consumption.
Previous studies investigating the association between alco- hol consumption at one point in time and metabolic syndrome Fig. 2. Association between change in alcohol consumption and change systolic or diastolic blood pressure. Adjusted mean values of change in (A) systolic or (B) diastolic blood pressure were calculated for initial non-drinkers, light drinkers, moderate drinkers, and heavy drinkers according to follow-up alcohol consumption: non-drinkers (0.0 g/day), light drinkers (0.1 to 19.9 g/day for males, 0.1 to 9.9 g/day for females), moderate drinkers (20.0 to 39.9 g/day for males, 10.0 to 19.9 g/day for females), heavy drink- ers (≥40.0 g/day for males, ≥20.0 g/day for females). Adjusted mean values determined by linear regression analysis after adjust- ments for age, sex, household income, education level, physical activity, smoking, total energy intake, body mass index, past histo- ry of cardiovascular disease, family history of hypertension, diabetes, and dyslipidemia, and follow-up duration. Groups without change in alcohol consumption were considered reference groups (e.g., initial non-drinkers to follow-up non-drinkers). P values for statistical significance: aP<0.05, bP<0.01, cP<0.001.
12 10 8 6 4 2 0
−2
−4
−6
8 6 4 2 0
−2
−4
−6
Change in systolic blood pressure (mm Hg)Change in diastolic blood pressure (mm Hg)
Initial non-drinkers
Initial non-drinkers
Initial light drinkers
Initial light drinkers
Initial moderate drinkers
Initial moderate drinkers
Initial heavy drinkers
Initial heavy drinkers Systolic blood pressure
Diastolic blood pressure
Secondary non-drinkers Secondary light drinkers Secondary moderate drinkers Secondary heavy drinkers
A
B Ref.
Ref.
a
a
b
b
Ref.
Ref.
Ref.
Ref.
a
a
a
a b
b
b
b c
Ref. b b
or its individual components support the findings of this study.
In a recent meta-analysis consisting six prospective studies with 28,862 participants, Sun and colleagues showed that heavy levels (>35 g/day) of alcohol consumption was associat- ed with elevated risk of metabolic syndrome (relative risk, 1.84;
95% CI, 1.34 to 2.52) compared to non-drinkers [6]. In anoth- er cohort study, Kim and colleagues showed that increased al- cohol consumption was associated with not only elevated risk of metabolic syndrome, but also abdominal obesity, impaired fasting glucose, and hypertriglyceridemia [15]. Similarly, an-
other prospective study demonstrated that heavy levels of alco- hol consumption is associated with elevated risk of metabolic syndrome, abdominal obesity, impaired FSG, hypertension, and hypertriglyceridemia [16].
Alcohol consumption may lead to elevated risk of metabolic syndrome by increasing waist circumference, FSG, blood pres- sure, and triglyceride levels. It has been suggested that alcohol may inhibit fat oxidation, which would lead to fat sparing upon heavy alcohol consumption, resulting in increased adiposity [17]. Furthermore, alcohol has been previously associated with Fig. 3. Association between change in alcohol consumption and change triglycerides or high density lipoprotein cholesterol (HDL-C). Adjusted mean values of change in (A) triglycerides or (B) HDL-C were calculated for initial non-drinkers, light drink- ers, moderate drinkers, and heavy drinkers according to follow-up alcohol consumption: non-drinkers (0.0 g/day), light drinkers (0.1 to 19.9 g/day for males, 0.1 to 9.9 g/day for females), moderate drinkers (20.0 to 39.9 g/day for males, 10.0-19.9 g/day for fe- males), heavy drinkers (≥40.0 g/day for males, ≥20.0 g/day for females). Adjusted mean values determined by linear regression analysis after adjustments for age, sex, household income, education level, physical activity, smoking, total energy intake, body mass index, past history of cardiovascular disease, family history of hypertension, diabetes, and dyslipidemia, and follow-up du- ration. Groups without change in alcohol consumption were considered reference groups (e.g., initial non-drinkers to follow-up non-drinkers). P values for statistical significance: aP<0.05, bP<0.01, cP<0.001.
50 40 30 20 10 0
−10
−20
−30
−40
16 14 12 10 8 6 4 20
−2
−4
−6 Change in triglycerides (mg/dL) Change in HDL-C (mg/dL)
Initial non-drinkers
Initial non-drinkers
Initial light drinkers
Initial light drinkers
Initial moderate drinkers
Initial moderate drinkers
Initial heavy drinkers
Initial heavy drinkers
Ref. Ref.
Ref.
Ref.
b
c
c a
b a b
Ref.
Triglycerides
Secondary non-drinkers Secondary light drinkers Secondary moderate drinkers Secondary heavy drinkers
HDL-C
A
B Ref.
b
a
c
c
c
a Ref.
β-cell dysfunction and alcoholic steatohepatitis, which could lead to deteriorating glycemic control and elevated FSG levels [18]. In terms of hypertension, alcohol has been shown to be associated with increased corticotropin-releasing hormone [19]
and cortisol [20], elevated sympathetic nervous system activity [21], and vasoconstriction due to elevated intracellular calcium [22,23], all precursors of elevated blood pressure. Finally, alco- hol has been shown to stimulate hepatic secretion of very low density lipoproteins [24] and lipolysis by lipoprotein lipase [25], which could then lead to hypertriglyceridemia [26].
In contrast to other components of metabolic syndrome, the risk of low HDL-C decreased upon increased alcohol intake.
Furthermore, heavy drinkers who reduced alcohol consump- tion had increased risk of low HDL-C. This finding is support- ed in multiple previous studies investigating the effect of alco- hol intake on HDL-C levels, which reveal that greater alcohol intake was associated with higher HDL-C levels [27-31]. One possible mechanism for the apparent benefit of alcohol on HDL-C is the increased transport rate of apolipoproteins A-I and A-II, major apolipoproteins of HDL, upon alcohol con- sumption [32]. This benefit of elevated HDL-C levels upon in- creasing alcohol consumption may have contributed to the lack of increased risk of metabolic syndrome upon elevating alcohol intake to light levels among non-drinkers, as well as the lack of benefit when light drinkers became non-drinkers.
Interestingly, two longitudinal studies have shown that mod- erate to heavy levels of alcohol intake is associated with re- duced risk of metabolic syndrome [4,5]. However, both studies were conducted among Western populations. Therefore, the discrepancy in the relationship between alcohol consumption and metabolic syndrome compared to our results may be due to the ethnic differences in alcohol metabolism or drinking patterns [33]. Indeed, two previous studies investigating the association between alcohol consumption and metabolic syn- drome among Korean populations have shown that greater al- cohol intake is associated with increased risk of metabolic syn- drome [15,16]. Nonetheless, the exact reasons for the differ- ences in the association between alcohol consumption and metabolic syndrome among Western and Asian populations are unclear and merit further investigation.
Previously, there have been limited studies that investigated the association between change in alcohol intake and metabol- ic syndrome. Furthermore, the relatively large study popula- tion and extensive adjustment of covariates enhance the reli- ability of our findings. We also attempted to take into account
a potentially important confounder, sex. Although the signifi- cance was decreased likely due to the reduction in statistical power, our results suggest that the risk-elevating effect upon increased alcohol intake tended to be preserved among both males and females.
Nonetheless, several limitations must be considered upon interpreting the results from our study. First, as alcohol intake was determined using a self-reported questionnaire, the re- ported amount of alcohol intake may differ from the actual amount of alcohol consumption. However, previous studies have shown that alcohol consumption reported by a question- naire correlates well with the actual amount of alcohol intake [34,35]. Second, as the participants in HEXA-G underwent only two health examinations, we could not determine wheth- er changes in alcohol intake occurred after the second period.
Future studies with multiple repeated measurements of alcohol intake are needed to validate our findings. Third, although we were able to show that each of the five components of metabol- ic syndrome were affected by alcohol intake change, we could not demonstrate which of the five components was most influ- enced by alcohol consumption. Therefore, future studies inves- tigating which of the five components of metabolic syndrome are most influenced by alcohol consumption change are need- ed. Fourth, as metabolic syndrome and secondary alcohol con- sumption were both determined during the follow-up health examination, the sequence of causality cannot be established with certainty. However, previous studies showing differing susceptibilities to elevated HDL-C [36] and increased risk of type 2 diabetes mellitus [37] according to the variation in the alcohol dehydrogenase genotype suggest that alcohol and its metabolites appear to alter the risk of developing metabolic syndrome. Fifth, the fact that the study population consisted of Korean participants who underwent health examinations, who may have certain sociodemographic tendencies, may limit the generalizability of our results. This may be particularly true in terms of alcohol consumption category, which was based on a similar previous study with an Asian population [13]. Since the alcohol consumption category may differ for Western popula- tions, future studies conducted among study participants of other ethnicities are needed to validate our findings.
In conclusion, increases in alcohol consumption may lead to elevated risk of developing metabolic syndrome, while reduc- ing alcohol consumption may lead to decreased risk of meta- bolic syndrome. Heavy drinkers who reduce alcohol intake may benefit from reduced risk of metabolic syndrome. Since
metabolic syndrome is associated with higher risk of cardio- vascular disease and all-cause mortality, the fact that increases in alcohol intake is associated with higher metabolic syndrome risk of both public health and clinical importance. However, as metabolic syndrome is a constellation of five features related to metabolic abnormalities, metabolic syndrome does not neces- sarily translate directly into a particular disease. Therefore, fu- ture studies that directly investigate the association of alcohol intake change with other health outcomes such as cardiovas- cular disease are needed.
SUPPLEMENTARY MATERIALS
Supplementary materials related to this article can be found online at https://doi.org/10.4093/dmj.2018.0128.
CONFLICTS OF INTEREST
No potential conflict of interest relevant to this article was re- ported.
AUTHOR CONTRIBUTIONS
Conception or design: J.K.L., D.K., S.M.P.
Acquisition, analysis, or interpretation of data: S.C., K.K., J.K.L., J.Y.C., A.S., S.K.P., D.K., S.M.P.
Drafting the work or revising: S.C., K.K., J.K.L., J.Y.C., A.S., S.K.P., D.K., S.M.P.
Final approval of the manuscript: S.C., K.K., J.K.L., J.Y.C., A.S., S.K.P., D.K., S.M.P.
ORCID
Seulggie Choi https://orcid.org/0000-0002-0581-165X Sang Min Park https://orcid.org/0000-0002-7498-4829
ACKNOWLEDGMENTS
This study was supported by the Research Program funded by the Korea Centers for Disease Control and Prevention (2004- E71004-00, 2005-E71011-00, 2005-E71009-00, 2006-E71001- 00, 2006-E71004-00, 2006-E71010-00, 2006-E71003-00, 2007- E71004-00, 2007-E71006-00, 2008-E71006-00, 2008-E71008- 00, 2009-E71009-00, 2010-E71006-00, 2011-E71006-00, 2012- E71001-00, and 2013-E71009-00).
REFERENCES
1. Eckel RH, Alberti KG, Grundy SM, Zimmet PZ. The metabolic syndrome. Lancet 2010;375:181-3.
2. Gami AS, Witt BJ, Howard DE, Erwin PJ, Gami LA, Somers VK, Montori VM. Metabolic syndrome and risk of incident cardiovascular events and death: a systematic review and meta- analysis of longitudinal studies. J Am Coll Cardiol 2007;49:
403-14.
3. Cornier MA, Dabelea D, Hernandez TL, Lindstrom RC, Steig AJ, Stob NR, Van Pelt RE, Wang H, Eckel RH. The metabolic syndrome. Endocr Rev 2008;29:777-822.
4. Stoutenberg M, Lee DC, Sui X, Hooker S, Horigian V, Perrino T, Blair S. Prospective study of alcohol consumption and the incidence of the metabolic syndrome in US men. Br J Nutr 2013;110:901-10.
5. Gigleux I, Gagnon J, St-Pierre A, Cantin B, Dagenais GR, Mey- er F, Despres JP, Lamarche B. Moderate alcohol consumption is more cardioprotective in men with the metabolic syndrome. J Nutr 2006;136:3027-32.
6. Sun K, Ren M, Liu D, Wang C, Yang C, Yan L. Alcohol con- sumption and risk of metabolic syndrome: a meta-analysis of prospective studies. Clin Nutr 2014;33:596-602.
7. Shin S, Lee HW, Kim CE, Lim J, Lee JK, Lee SA, Kang D. Egg consumption and risk of metabolic syndrome in Korean adults: results from the health examinees study. Nutrients 2017;
9:E687.
8. Ahn Y, Kwon E, Shim JE, Park MK, Joo Y, Kimm K, Park C, Kim DH. Validation and reproducibility of food frequency questionnaire for Korean genome epidemiologic study. Eur J Clin Nutr 2007;61:1435-41.
9. Yang JJ, Song M, Yoon HS, Lee HW, Lee Y, Lee SA, Choi JY, Lee JK, Kang D. What are the major determinants in the success of smoking cessation: results from the health examinees study.
PLoS One 2015;10:e0143303.
10. Jung SJ, Park SK, Shin A, Lee SA, Choi JY, Hong YC, Yoo KY, Lee JK, Kang D. Body mass index at age 18-20 and later risk of spontaneous abortion in the Health Examinees Study (HEXA).
BMC Pregnancy Childbirth 2015;15:228.
11. Health Examinees Study Group. The Health Examinees (HEXA) study: rationale, study design and baseline character- istics. Asian Pac J Cancer Prev 2015;16:1591-7.
12. Choi J, Choi JY, Shin A, Lee SA, Lee KM, Oh J, Park JY, Lee JK, Kang D. Trends and correlates of high-risk alcohol consump- tion and types of alcoholic beverages in middle-aged Korean
adults: results from the HEXA-G study. J Epidemiol 2019;29:
125-32.
13. Cho Y, Choi S, Kim K, Lee G, Park SM. Association between alcohol consumption and bone mineral density in elderly Ko- rean men and women. Arch Osteoporos 2018;13:46.
14. National Cholesterol Education Program (NCEP) Expert Panel on Detection, Evaluation, and Treatment of High Blood Cho- lesterol in Adults (Adult Treatment Panel III). Third report of the National Cholesterol Education Program (NCEP) Expert Panel on Detection, Evaluation, and Treatment of High Blood Cholesterol in Adults (Adult Treatment Panel III) final report.
Circulation 2002;106:3143-421.
15. Kim BJ, Kim BS, Kang JH. Alcohol consumption and incidence of metabolic syndrome in Korean men. A 3-year follow-up study. Circ J 2012;76:2363-71.
16. Baik I, Shin C. Prospective study of alcohol consumption and metabolic syndrome. Am J Clin Nutr 2008;87:1455-63.
17. Yeomans MR, Caton S, Hetherington MM. Alcohol and food intake. Curr Opin Clin Nutr Metab Care 2003;6:639-44.
18. Kim JY, Lee DY, Lee YJ, Park KJ, Kim KH, Kim JW, Kim WH.
Chronic alcohol consumption potentiates the development of diabetes through pancreatic β-cell dysfunction. World J Biol Chem 2015;6:1-15.
19. Rupp H, Brilla CG, Maisch B. Hypertension and alcohol: cen- tral and peripheral mechanisms. Herz 1996;21:258-64.
20. Potter JF, Watson RD, Skan W, Beevers DG. The pressor and metabolic effects of alcohol in normotensive subjects. Hyper- tension 1986;8:625-31.
21. Arkwright PD, Beilin LJ, Vandongen R, Rouse IA, Lalor C. The pressor effect of moderate alcohol consumption in man: a search for mechanisms. Circulation 1982;66:515-9.
22. Altura BM, Altura BT. Microvascular and vascular smooth muscle actions of ethanol, acetaldehyde, and acetate. Fed Proc 1982;41:2447-51.
23. Husain K, Ansari RA, Ferder L. Alcohol-induced hyperten- sion: mechanism and prevention. World J Cardiol 2014;6:245- 52.
24. Mudrakova E, Poledne R, Kovar J. Postprandial triglyceridemia after single dose of alcohol in healthy young men. Nutr Metab Cardiovasc Dis 2013;23:183-8.
25. Schneider J, Liesenfeld A, Mordasini R, Schubotz R, Zofel P, Kubel F, Vandre-Plozzitzka C, Kaffarnik H. Lipoprotein frac- tions, lipoprotein lipase and hepatic triglyceride lipase during short-term and long-term uptake of ethanol in healthy sub- jects. Atherosclerosis 1985;57:281-91.
26. Klop B, do Rego AT, Cabezas MC. Alcohol and plasma triglyc- erides. Curr Opin Lipidol 2013;24:321-6.
27. Fraser GE, Anderson JT, Foster N, Goldberg R, Jacobs D, Blackburn H. The effect of alcohol on serum high density lipo- protein (HDL). A controlled experiment. Atherosclerosis 1983;
46:275-86.
28. Haskell WL, Camargo C Jr, Williams PT, Vranizan KM, Krauss RM, Lindgren FT, Wood PD. The effect of cessation and re- sumption of moderate alcohol intake on serum high-density- lipoprotein subfractions. A controlled study. N Engl J Med 1984;310:805-10.
29. Crouse JR, Grundy SM. Effects of alcohol on plasma lipopro- teins and cholesterol and triglyceride metabolism in man. J Lipid Res 1984;25:486-96.
30. Taskinen MR, Nikkila EA, Valimaki M, Sane T, Kuusi T, Kes- aniemi A, Ylikahri R. Alcohol-induced changes in serum lipo- proteins and in their metabolism. Am Heart J 1987;113:458- 64.
31. Clevidence BA, Reichman ME, Judd JT, Muesing RA, Schatz- kin A, Schaefer EJ, Li Z, Jenner J, Brown CC, Sunkin M, Camp- bell WS, Taylor PR. Effects of alcohol consumption on lipopro- teins of premenopausal women. A controlled diet study. Arte- rioscler Thromb Vasc Biol 1995;15:179-84.
32. De Oliveira E Silva ER, Foster D, McGee Harper M, Seidman CE, Smith JD, Breslow JL, Brinton EA. Alcohol consumption raises HDL cholesterol levels by increasing the transport rate of apolipoproteins A-I and A-II. Circulation 2000;102:2347-52.
33. Chartier K, Caetano R. Ethnicity and health disparities in alco- hol research. Alcohol Res Health 2010;33:152-60.
34. Williams GD, Aitken SS, Malin H. Reliability of self-reported alcohol consumption in a general population survey. J Stud Al- cohol 1985;46:223-7.
35. Giovannucci E, Colditz G, Stampfer MJ, Rimm EB, Litin L, Sampson L, Willett WC. The assessment of alcohol consump- tion by a simple self-administered questionnaire. Am J Epide- miol 1991;133:810-7.
36. Hines LM, Stampfer MJ, Ma J, Gaziano JM, Ridker PM, Han- kinson SE, Sacks F, Rimm EB, Hunter DJ. Genetic variation in alcohol dehydrogenase and the beneficial effect of moderate al- cohol consumption on myocardial infarction. N Engl J Med 2001;344:549-55.
37. Beulens JW, Rimm EB, Hendriks HF, Hu FB, Manson JE, Hunter DJ, Mukamal KJ. Alcohol consumption and type 2 dia- betes: influence of genetic variation in alcohol dehydrogenase.
Diabetes 2007;56:2388-94.
Supplementary Fig. 1. Schematic flow of the study design.