http://dx.doi.org/10.5624/isd.2016.46.3.185
Introduction
Osteoporosis is a skeletal disease characterized by low bone mass, deterioration of the bone structure, and bone fragility, leading to an increased risk of fracture;1 a less substantial decrease in bone mass is termed osteopenia.2 Bone fragility is evaluated using dual-energy X-ray ab- sorptiometry(DXA), which measures bone mineral den- sity(BMD). The measured BMD of an individual being screened for osteoporosis is compared with that of a young
healthy adult as a reference. In this context, the standard deviation values of young healthy adults’ BMD are known as T-scores, based on the World Health Organization (WHO) classification published in 1994.2 Using this clas- sification, normal individuals are those with a T-score value of at least -1, individuals with osteopenia have T- scores less than -1 but greater than -2.5, and osteoporosis is diagnosed in individuals with T-scores of -2.5 or less.
Due to the asymptomatic nature of osteoporosis over time, it may not be diagnosed until it has progressed to its late stage, which corresponds to an elevated risk of associated morbidity and even mortality.1,3 Thus, early diagnosis can improve the prognosis and the quality of life of individu- als with osteoporosis.
Detecting osteoporosis from dental images is a promis- ing diagnostic possibility, as a variety of dental imaging
IDIOS: An innovative index for evaluating dental imaging-based osteoporosis screening indices
Imad Barngkgei1,2,*, Esam Halboub3, Abeer Abdulkareem Almashraqi3,4, Razan Khattab5, Iyad Al Haffar1
1Department of Oral Medicine, Faculty of Dentistry, Damascus University, Damascus, Syria
2Department of Oral Medicine, Faculty of Dentistry, Syrian Private University, Damascus, Syria
3Department of Maxillofacial Surgery and Diagnostic Sciences, College of Dentistry, Jazan University, Jazan, Kingdom of Saudi Arabia
4Department of Oral and Maxillofacial Radiology, Faculty of Dentistry, Ibb University, Ibb, Yemen
5Department of Periodontology, Faculty of Dentistry, Damascus University, Damascus, Syria
AbStrAct
Purpose: The goal of this study was to develop a new index as an objective reference for evaluating current and newly developed indices used for osteoporosis screening based on dental images. Its name; IDIOS, stands for Index of Dental-imaging Indices of Osteoporosis Screening.
Materials and Methods: A comprehensive PubMed search was conducted to retrieve studies on dental imaging- based indices for osteoporosis screening. The results of the eligible studies, along with other relevant criteria, were used to develop IDIOS, which has scores ranging from 0(0%) to 15(100%). The indices presented in the studies we included were then evaluated using IDIOS.
results: The 104 studies that were included utilized 24, 4, and 9 indices derived from panoramic, periapical, and computed tomographic/cone-beam computed tomographic techniques, respectively. The IDIOS scores for these indices ranged from 0(0%) to 11.75(78.32%).
conclusion: IDIOS is a valuable reference index that facilitates the evaluation of other dental imaging-based osteoporosis screening indices. Furthermore, IDIOS can be utilized to evaluate the accuracy of newly developed indices.(Imaging Sci Dent 2016; 46: 185-202)
Key wOrDS: Radiography, Dental; Diagnosis; Absorptiometry, Photon; Osteoporosis
Copyright ⓒ 2016 by Korean Academy of Oral and Maxillofacial Radiology
This is an Open Access article distributed under the terms of the Creative Commons Attribution Non-Commercial License(http://creativecommons.org/licenses/by-nc/3.0) which permits unrestricted non-commercial use, distribution, and reproduction in any medium, provided the original work is properly cited.
Imaging Science in Dentistry·pISSN 2233-7822 eISSN 2233-7830
*This study was prepared as a part of the OSTEOSYR project; a fully funded MSc and PhD project by the Faculty of Dentistry, Damascus University, Syria, with the first author as the principal investigator.
Received September 20, 2015; Revised October 13, 2015; Accepted December 11, 2015
*Correspondence to : Prof. Imad Barngkgei
Department of Oral Medicine, Faculty of Dentistry, Damascus University, Mazzeh Highway, Damascus, Syrian Arab Republic
Tel) 963-93-2785-671, Fax) 963-11-212-4757, E-mail) [email protected]
techniques are commonly indicated for the diagnosis of conditions affecting head and neck structures.4 The most commonly used techniques are periapical and panoramic radiography. Cone-beam computed tomography(CBCT), introduced in 1998,5 has become widely accepted in den- tistry, but due to concerns about the dose of radiation, it is not part of routine dental imaging. Since they are routine and feasible, various imaging techniques in dentistry have been evaluated as methods of opportunistic screening for osteoporosis. Numerous dental image-derived indices have been suggested and evaluated for this purpose. Al- though the results of many such studies are comparable, their conclusions are somewhat contradictory.6-8 This can be attributed to the absence of clear criteria for describing the values resulting from these indices.
Accordingly, this study aimed to develop a new index as an objective reference for evaluating currently used and newly developed indices, and as a tool that allows the objective comparison of different indices. IDIOS, the suggested name of the index, stands for Index of Dental- imaging Indices of Osteoporosis Screening.
The definitions of the indices used to screen for osteo- porosis using dental imaging techniques are included in Appendix 1. However, it should be noted that in some papers some deviations from these definitions may have occurred, and such deviations were ignored in this study.
Moreover, some indices were only used in a single study, and the reader may therefore refer to the article in ques- tion to obtain the details of such indices.
Materials and Methods
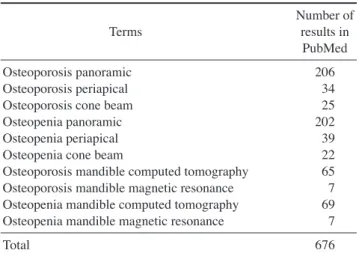
A preliminary PubMed search was conducted in Octo- ber 2014. Relevant terms and combinations of terms were chosen to retrieve all studies on the diagnosis and screen- ing of osteoporosis using dental imaging techniques(Table 1). A second search, using the same terms and combina- tions of terms, was conducted on April 13, 2015, in order to include all papers published by that time and to con- firm the results of the preliminary search.
Studies were included if they were in English and de- scribed the use of any dental imaging technique to detect or predict osteoporosis in live humans. All retrieved stud- ies were reviewed by one author, and all criteria were applied strictly. Each study was reviewed to extract the imaging technique that was used, the index or indices that were evaluated, and the statistical results regarding the relationship between bone fragility status and these indi- ces. The following statistical parameters were evaluated:
sensitivity(SN), specificity(SP), positive predictive value (PPV), negative predictive value(NPV), accuracy, area under the receiver operating characteristic(ROC) curve, and correlations. Statistical parameters that are less com- monly used in this context, such as odds ratios and posi- tive and negative likelihood ratios, were not included in the calculation of IDIOS or presented in the results.
IDIOS is based on 5 criteria; 3 criteria were derived from the statistical results of the indices described in the included studies, and the other 2 are highly relevant for evaluating the indices in question. IDIOS has a single output value, ranging from 0 to 15(equivalent to 0% to 100%). The higher the value of IDIOS, the greater the power and the validity of the evaluated index. The formula for calculating IDIOS scores is presented after the follow- ing explanation of the criteria.
The power of the index
This refers to the reported ability of an index to deter- mine positive and negative cases accurately. This criteri- on is based on the values of the SN and SP of the index, which are the most commonly presented statistical para- meters in studies of diagnostic and screening methods.
Each value of these 2 parameters was given a score as follows: 6 for values between 90% and 100%, 5 for val- ues between 80% and 89.9%, 4 for values between 70%
and 79.9%, 3 for values between 60% and 69.9%, 2 for values between 50% 59.9%, 1 for values between 40%
and 49.9% and 0 for values less than 40%.
It is worth mentioning that the authors of some studies presented SN and SP values for the lumbar vertebrae and the hip separately, or presented more than 1 value. In such cases, the maximum and the minimum values were re- corded in Tables 2-4.
Table 1. Search terms used and the number of results
Terms Number of
results in PubMed
Osteoporosis panoramic 206
Osteoporosis periapical 34
Osteoporosis cone beam 25
Osteopenia panoramic 202
Osteopenia periapical 39
Osteopenia cone beam 22
Osteoporosis mandible computed tomography 65 Osteoporosis mandible magnetic resonance 7 Osteopenia mandible computed tomography 69 Osteopenia mandible magnetic resonance 7
Total 676
Table 2. Panoramic radiography-based osteoporosis screening indices included in this study(sorted alphabetically) IndexReferencesStatistical resultsIDIOS score(%)[subscores]* Anatomical indices (relative or absolute linear measurements)
9,10,48-1(6.67%)[0+0+1+0+0] Antegonial angle11,27 Correlation(r): 0-0.2,27 0.4-0.527 5.5(36.67%)[0+4.5+1+0+0] Antegonial depth11,27 Correlation(r): 0-0.2,27 0.4-0.527 6(40%)[0+5+1+0+0] Antegonial index1,9,11,12,27,49, 68-71Correlation(r): 0-0.2,70,71 0.2-0.3,71 0.3-0.4,27 0.4-0.5,27 0.5-0.649 4(26.67%)[0+3+1+0+0] Bone structure analyses (cortical bone)
56,72 SN: 80%-85%56 SP: 50%-55%,56 70%-75%56 ROC: 60%-70%,56 70%-80%,56 80%-90%565(33.33%)[4+0+1+0+0] Bone structure analyses (trabecular bone)
13,48,56,72-76 SN: 40%-45%,73 80%-85%56,73 SP: 40%-45%,73 80%-85%73 Acc: 60%-65%48 PPV: 55%-60%,73 65%-70%73 NPV: 45%-50%,56 75%-80%73 ROC: 60%-70%,56 70%-80%,73,76 80%-90%72,76 Correlation(r): 0.4-0.576 All bone fragility groups:48
7.33(48.89%)[3.33+2+1+0+1] Gonial angle11,27 Correlation(r): 0-0.2,27 0.3-0.4,27 0.4-0.527 7(46.67%)[0+6+1+0+0] Gonion index9,12,14,26,49, 50,69,71,77SN: 90%-100%77 SP: 90%-100%77 PPV: 90%-100%77 NPV: 75%-80%,77 80%-85%77 Correlation(r): 0-0.2,71 0.4-0.5,49,50 0.6-0.777 All bone fragility groups:77
8(53.33%)[6+0+1+0+1] Height of the edentulous ridge15 -1(6.67%)[0+0+1+0+0] Hierarchic segmentation analysis16 SN: 70%-75%,16 90%-100%16 SP: 65%-70%,16 75%-80%16 PPV: 55%-60%,16 65%-70%16 NPV: 80%-85%,16 90%-100%16 Acc: 40%-45%16 ROC: 70%-80%16 All bone fragility groups:16
6.25(41.67%)[4.25+0+1+0+1] Incisure depth17 -1(6.67%)[0+0+1+0+0] Jawbone BMD by DXA19,49,78,79 SN: 50%-55%19 SP: 75%-80%19 PPV: 60%-65%19 NPV: 60%-65%19 Correlation(r): 0-0.2,78,79 0.4-0.5,19 0.6-0.749
4(26.67%)[3+0+1+0+0]
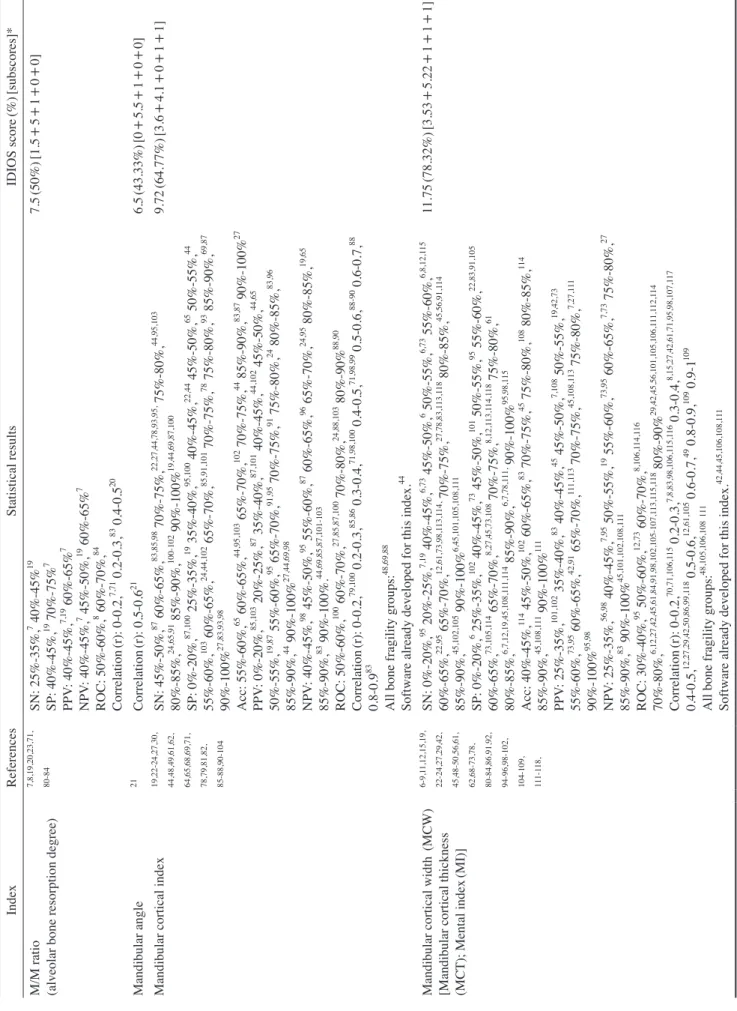
IndexReferencesStatistical resultsIDIOS score(%)[subscores]* M/M ratio (alveolar bone resorption degree)
7,8,19,20,23,71, 80-84SN: 25%-35%,7 40%-45%19 SP: 40%-45%,19 70%-75%7 PPV: 40%-45%,7,19 60%-65%7 NPV: 40%-45%,7 45%-50%,19 60%-65%7 ROC: 50%-60%,8 60%-70%,84 Correlation(r): 0-0.2,7,71 0.2-0.3,83 0.4-0.520
7.5(50%)[1.5+5+1+0+0] Mandibular angle21 Correlation(r): 0.5-0.621 6.5(43.33%)[0+5.5+1+0+0] Mandibular cortical index19,22-24,27,30, 44,48,49,61,62, 64,65,68,69,71, 78,79,81,82, 85-88,90-104
SN: 45%-50%,87 60%-65%,83,85,98 70%-75%,22,27,44,78,93,95, 75%-80%,44,95,103 80%-85%,24,65,91 85%-90%,100-102 90%-100%19,44,69,87,100 SP: 0%-20%,87,100 25%-35%,19 35%-40%,95,100 40%-45%,22,44 45%-50%,65 50%-55%,44 55%-60%,103 60%-65%,24,44,102 65%-70%,85,91,101 70%-75%,78 75%-80%,93 85%-90%,69,87 90%-100%27,83,93,98 Acc: 55%-60%,65 60%-65%,44,95,103 65%-70%,102 70%-75%,44 85%-90%,83,87 90%-100%27 PPV: 0%-20%,85,103 20%-25%,87 35%-40%,87,101 40%-45%,44,102 45%-50%,44,65 50%-55%,19,87 55%-60%,95 65%-70%,91,95 70%-75%,91 75%-80%,24 80%-85%,83,96 85%-90%,44 90%-100%27,44,69,98 NPV: 40%-45%,98 45%-50%,95 55%-60%,87 60%-65%,96 65%-70%,24,95 80%-85%,19,65 85%-90%,83 90%-100%.44,69,85,87,101-103 ROC: 50%-60%,100 60%-70%,27,85,87,100 70%-80%,24,88,103 80%-90%88,90 Correlation(r): 0-0.2,79,100 0.2-0.3,85,86 0.3-0.4,71,98,100 0.4-0.5,71,98,99 0.5-0.6,88-90 0.6-0.7,88 0.8-0.983 All bone fragility groups:48,69,88 Software already developed for this index.44
9.72(64.77%)[3.6+4.1+0+1+1] Mandibular cortical width (MCW) [Mandibular cortical thickness (MCT); Mental index(MI)]
6-9,11,12,15,19, 22-24,27,29,42, 45,48-50,56,61, 62,68-73,78, 80-84,86,91,92, 94-96,98-102, 104-109, 111-118,
SN: 0%-20%,95 20%-25%,7,19 40%-45%,6,73 45%-50%,6 50%-55%,6,73 55%-60%,6,8,12,115 60%-65%,22,95 65%-70%,12,61,73,98,113,114, 70%-75%,27,78,83,113,118 80%-85%,45,56,91,114 85%-90%,45,102,105 90%-100%6,45,101,105,108,111 SP: 0%-20%,6 25%-35%,102 40%-45%,73 45%-50%,101 50%-55%,95 55%-60%,22,83,91,105 60%-65%,73,105,114 65%-70%,8,27,45,73,108 70%-75%,8,12,113,114,118 75%-80%,61 80%-85%,6,7,12,19,45,108,111,114 85%-90%,6,7,78,111, 90%-100%95,98,115 Acc: 40%-45%,114 45%-50%,102 60%-65%,83 70%-75%,45 75%-80%,108 80%-85%,114 85%-90%,45,108,111 90%-100%111 PPV: 25%-35%,101,102 35%-40%,83 40%-45%,45 45%-50%,7,108 50%-55%,19,42,73 55%-60%,73,95 60%-65%,42,91 65%-70%,111,113 70%-75%,45,108,113 75%-80%,7,27,111 90%-100%95,98 NPV: 25%-35%,56,98 40%-45%,7,95 50%-55%,19 55%-60%,73,95 60%-65%,7,73 75%-80%,27 85%-90%,83 90%-100%45,101,102,108,111 ROC: 30%-40%,95 50%-60%,12,73 60%-70%,8,106,114,116 70%-80%,6,12,27,42,45,61,84,91,98,102,105-107,113,115,118 80%-90%29,42,45,56,101,105,106,111,112,114 Correlation(r): 0-0.2,70,71,106,115 0.2-0.3,7,8,83,98,106,115,116 0.3-0.4,8,15,27,42,61,71,95,98,107,117 0.4-0.5,12,27,29,42,50,86,99,118 0.5-0.6,12,61,105 0.6-0.7,49 0.8-0.9,109 0.9-1109 All bone fragility groups:48,105,106,108111 Software already developed for this index.42,44,45,106,108,111
11.75(78.32%)[3.53+5.22+1+1+1]
Table 2. Continued
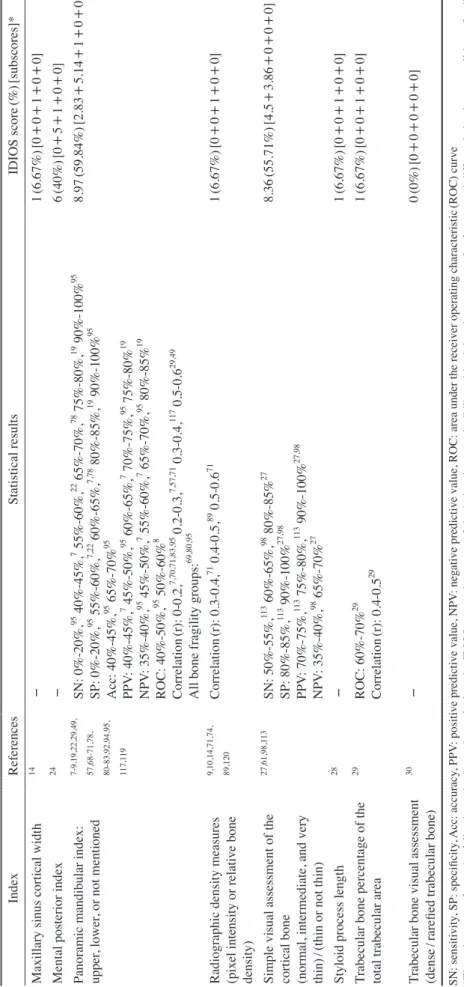
IndexReferencesStatistical resultsIDIOS score(%)[subscores]* Maxillary sinus cortical width14 -1(6.67%)[0+0+1+0+0] Mental posterior index24 -6(40%)[0+5+1+0+0] Panoramic mandibular index: upper, lower, or not mentioned
7-9,19,22,29,49, 57,68-71,78, 80-83,92,94,95, 117,119
SN: 0%-20%,95 40%-45%,7 55%-60%,22 65%-70%,78 75%-80%,19 90%-100%95 SP: 0%-20%,95 55%-60%,7,22 60%-65%,7,78 80%-85%,19 90%-100%95 Acc: 40%-45%,95 65%-70%95 PPV: 40%-45%,7 45%-50%,95 60%-65%,7 70%-75%,95 75%-80%19 NPV: 35%-40%,95 45%-50%,7 55%-60%,7 65%-70%,95 80%-85%19 ROC: 40%-50%,95 50%-60%8 Correlation(r): 0-0.2,7,70,71,83,95 0.2-0.3,7,57,71 0.3-0.4,117 0.5-0.629,49 All bone fragility groups:69,80,95
8.97(59.84%)[2.83+5.14+1+0+0] Radiographic density measures
(pixel intensity or relative bone density)
9,10,14,71,74, 89,120Correlation(r): 0.3-0.4,71 0.4-0.5,89 0.5-0.671 1(6.67%)[0+0+1+0+0]
Simple visual assessment of the cortical bone (normal, intermediate, and very thin)
/(thin or not thin)
27,61,98,113 SN: 50%-55%,113 60%-65%,98 80%-85%27 SP: 80%-85%,113 90%-100%27,98 PPV: 70%-75%,113 75%-80%,113 90%-100%27,98 NPV: 35%-40%,98 65%-70%27
8.36(55.71%)[4.5+3.86+0+0+0] Styloid process length28 -1(6.67%)[0+0+1+0+0]
Trabecular bone percentage of the total trabecular area
29 ROC: 60%-70%29 Correlation(r): 0.4-0.5291(6.67%)[0+0+1+0+0] Trabecular bone visual assessment (dense/rarefied trabecular bone)
30 -0(0%)[0+0+0+0+0] SN: sensitivity, SP: specificity, Acc: accuracy, PPV: positive predictive value, NPV: negative predictive value, ROC: area under the receiver operating characteristic(ROC) curve *The subscores refer to the following criteria used to calculate the IDIOS score: the power of the index, its reproducibility, objectivity, the presence of software, and differentiation between all bone fragility groups.
Table 2. Continued
For each index that was evaluated, the corresponding scores for the SN and SP values were recorded separately for individual studies. The means of these scores were then calculated across all studies employing that index.
Finally, the mean of these two mean values was defined as the power of that index(i.e., the maximum value was 6).
Reproducibility of the index
(interobserver and intraobserver agreement)
This parameter refers to the extent to which the obser- vers reported the same scores for the same subjects on two different occasions, or agreed with each other in re- porting scores for the same subjects. In this context, kap- pa statistics, interclass correlations, Pearson correlations, and/or agreement were considered for each index in each study. Scores of 6, 5, 4, 3, 2, 1, and 0 corresponded to reproducibility values of 0.90-1(90%-100%), 0.8-0.899 (80%-89.9%), 0.7-0.799(70%-79.9%), 0.6%-0.699(60%- 69.9%), 0.5%-0.599(50%-59.9%), 0.40-0.499(40%- 49.9%), and 0.39(39%) or less, respectively.
The mean score was then calculated for all studies in which a given index was used. This mean was considered the reproducibility score of the index.
No effort was made to differentiate between interobser- ver and intraobserver agreement in this study. When more than reproducibility test was included in a study(e.g., intraobserver and interobserver agreement or if reproduc- ibility was tested among 3 or more observers), the maxi- mum and the minimum values were included in Table 5.
Objectivity
If the index was based on measurements and/or calcula- tions, it was considered an objective index, and a score of 1 was given. Otherwise, the index was considered a sub- jective index, such as indices based on visual assessment, and a score of 0 was given.
Software
A score of 1 was given if software was used to perform the analytical process for the index under evaluation. It should be clarified that some indices are natively software- dependent, but the user must perform some preliminary steps. A score of 1 for this criterion means that the main analytical steps, including any preliminary steps, are done by the software.
Differentiation between bone fragility groups
A score of 1 was given to an index if at least one of the studies that used this index included all bone fragility groups(normal, osteopenia, and osteoporosis according to the WHO criteria2 presented above), either in the hip or the lumbar vertebrae, and found at least one of the fol- lowing: (A) statistical significance between each pair of groups, (B) area under the ROC curve(accuracy) greater than 0.8, (C) a Pearson(or Spearman) correlation coeffi- cient greater than 0.6. Otherwise, a score of 0 was given.
Studies that included all bone fragility groups are present- ed in Tables 2-4.
To calculate the IDIOS score for an index, the above
Table 3. Periapical radiography-based osteoporosis screening indices included in this study(sorted alphabetically)
Index References Statistical results IDIOS score(%)[subscores]*
Bone structure analyses (trabecular bone)
25,26,46,47,76,
82,121 SN: 65%-70%,121 90%-100%121
SP: 85%-90%,121 90%-100%121
Acc: 75%-80%,121 85%-90%,47 90%-100%46
ROC: 50%-60%,47 60%-70%,47 70%-80%,76 80%-90%76 Correlation(r): 0.4-0.576
11(73.33%)[5+5+1+0+0]
Radiographic density 14,15,25,26,32,
47,53,54,88 SN: 25%-35%,54 35%-40%,54 70%-75%53 SP: 50%-55%,53 80%-85%54
PPV: 75%-80%53 NPV: 45%-50%53
ROC: 60%-70%,47,54 70%-80%54,88
Correlation(r): 0.2-0.3,53 0.3-0.4,15 0.4-0.5,32 0.5-0.626,88
9.02(60.11%)[2.42+5.6 +1+0+0]
Trabecular bone assessment
32,122 SN: 70%-75%,122 90%-100%122
SP: 20%-25%,122 55%-60%122 Correlation(r): 0.6-0.732
6.8(45.33%)[3+3.8+0+0+0]
Width of the lamina dura 14 - 1(6.67%)[0+0+1+0+0]
SN: sensitivity, SP: specificity, Acc: accuracy, PPV: positive predictive value, NPV: negative predictive value, ROC: area under the receiver operating char- acteristic(ROC) curve
*The subscores refer to the following criteria used to calculate the IDIOS score: the power of the index, its reproducibility, objectivity, the presence of soft- ware, and differentiation between all bone fragility groups.
criteria were applied and the sum of the 5 scores for each criterion was calculated. Accordingly, the maximum IDIOS score is 15(6+6+1+1+1). The IDIOS scores can be presented as percentages by dividing the IDIOS score by 15 and multiplying the result by 100((IDIOS score/15)×
100).
results
The PubMed search yielded 676 studies(Table 1). Only 104 studies(15.4%) were found to be eligible for the de- velopment of IDIOS according to the inclusion criteria. In these studies, 24 panoramic(Table 2), 4 periapical(Table 3), and 9 CT/CBCT-based indices(Table 4) were used.
The IDIOS scores for the panoramic imaging-derived indices ranged from 0(0%), for trabecular bone visual assessment, to 11.75(78.32%) for the mandibular cortical width index(MCW)(Table 2). The IDIOS scores for the periapical imaging-based indices ranged from as low as 1 (6.67%), for width of the lamina dura, to 11(73.33%) for bone structure analyses(Table 3). Similarly, the IDIOS scores of the CT/CBCT-derived indices ranged from 1
(6.7%) to 10.25(68.33%), for radiographic density in gray values(CBCT)(Table 4).
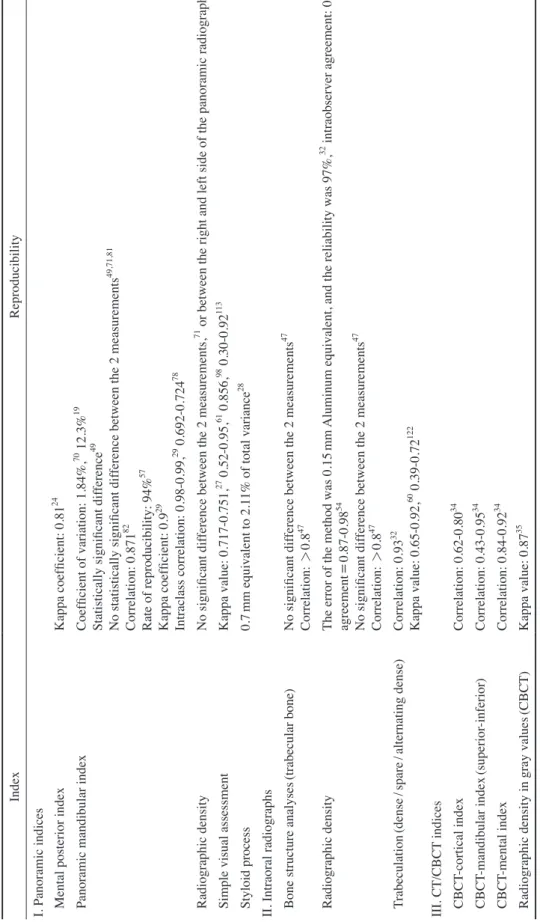
Table 5 shows the reproducibility of each index as re- ported in the studies that we analyzed.
Discussion
Osteoporosis imposes a significant burden on public health.39 Osteoporosis has been extensively studied in the context of dentistry, because in dental practice, the quality of the jawbone is paramount, as it is the supportive struc- ture for the teeth and for dental implants. It is important, therefore, to investigate the effects, if any, of osteoporosis on the jawbone. Additionally, dental imaging techniques may serve as opportunistic screening tools for osteoporo- sis, considering the large number of individuals who re- ceive dental services.4
In the current paper, 65% of all indices were derived from panoramic radiographs. As its name implies, pano- ramic radiographs provide a comprehensive view of all teeth and the jaws, including the temporomandibular joint, with a reasonably low radiation dose. This advantage
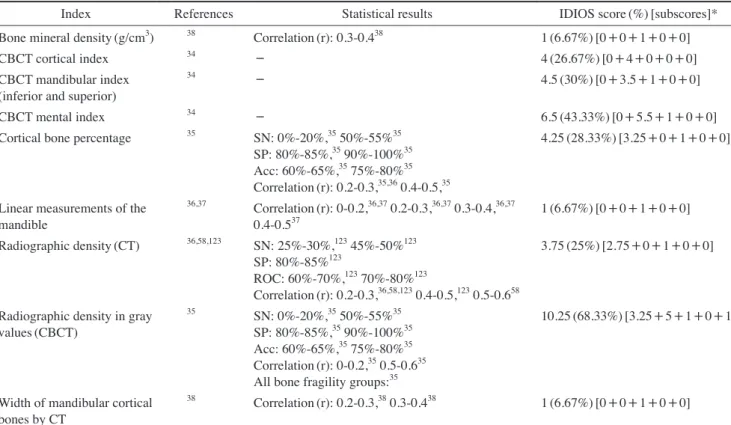
Table 4. CT-based and CBCT-based osteoporosis screening indices included in this study(sorted alphabetically)
Index References Statistical results IDIOS score(%)[subscores]*
Bone mineral density(g/cm3) 38 Correlation(r): 0.3-0.438 1(6.67%)[0+0+1+0+0]
CBCT cortical index 34 - 4(26.67%)[0+4+0+0+0]
CBCT mandibular index (inferior and superior)
34 - 4.5(30%)[0+3.5+1+0+0]
CBCT mental index 34 - 6.5(43.33%)[0+5.5+1+0+0]
Cortical bone percentage 35 SN: 0%-20%,35 50%-55%35 SP: 80%-85%,35 90%-100%35 Acc: 60%-65%,35 75%-80%35 Correlation(r): 0.2-0.3,35,36 0.4-0.5,35
4.25(28.33%)[3.25+0+1+0+0]
Linear measurements of the mandible
36,37 Correlation(r): 0-0.2,36,37 0.2-0.3,36,37 0.3-0.4,36,37
0.4-0.537 1(6.67%)[0+0+1+0+0]
Radiographic density(CT) 36,58,123 SN: 25%-30%,123 45%-50%123 SP: 80%-85%123
ROC: 60%-70%,123 70%-80%123
Correlation(r): 0.2-0.3,36,58,123 0.4-0.5,123 0.5-0.658
3.75(25%)[2.75+0+1+0+0]
Radiographic density in gray values(CBCT)
35 SN: 0%-20%,35 50%-55%35 SP: 80%-85%,35 90%-100%35 Acc: 60%-65%,35 75%-80%35 Correlation(r): 0-0.2,35 0.5-0.635 All bone fragility groups:35
10.25(68.33%)[3.25+5+1+0+1]
Width of mandibular cortical bones by CT
38 Correlation(r): 0.2-0.3,38 0.3-0.438 1(6.67%)[0+0+1+0+0]
SN: sensitivity, SP: specificity, Acc: accuracy, PPV: positive predictive value, NPV: negative predictive value, ROC: area under the receiver operating char- acteristic(ROC) curve, CT: computed tomography, CBCT: cone-beam computed tomography
*The subscores refer to the following criteria used to calculate the IDIOS score: the power of the index, its reproducibility, objectivity, the presence of soft- ware, and differentiation between all bone fragility groups.
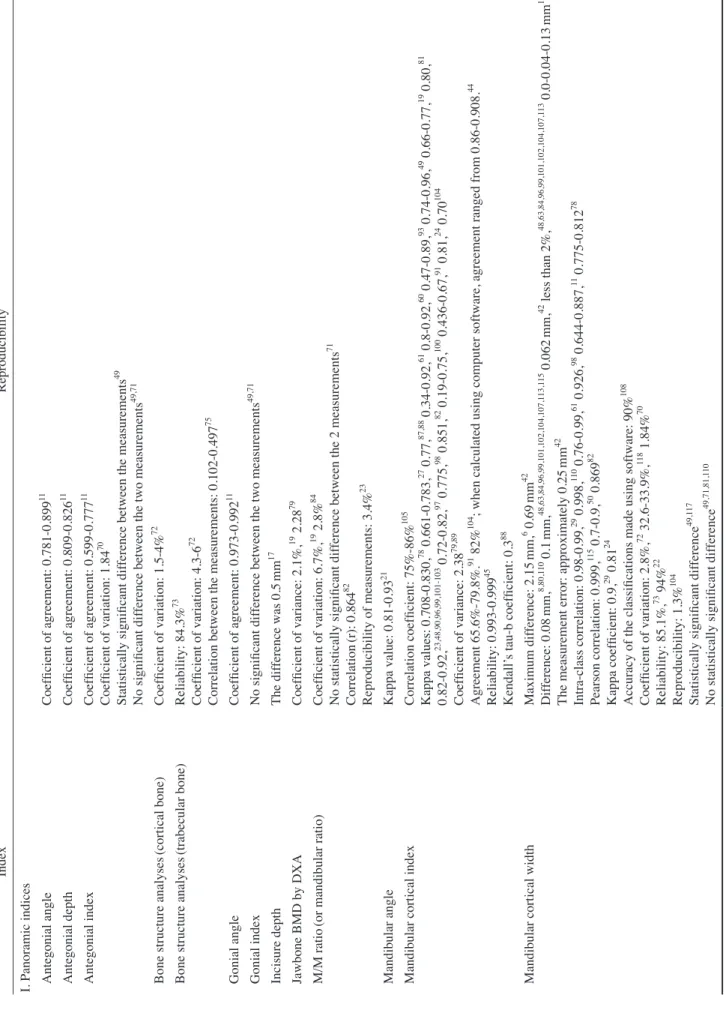
Table 5. Reproducibility of the indices analyzed in this study IndexReproducibility I. Panoramic indices Antegonial angleCoefficient of agreement: 0.781-0.89911 Antegonial depthCoefficient of agreement: 0.809-0.82611 Antegonial indexCoefficient of agreement: 0.599-0.77711 Coefficient of variation: 1.8470 Statistically significant difference between the measurements49 No significant difference between the two measurements49,71 Bone structure analyses(cortical bone)Coefficient of variation: 1.5-4%72 Bone structure analyses(trabecular bone)Reliability: 84.3%73 Coefficient of variation: 4.3-672 Correlation between the measurements: 0.102-0.49775 Gonial angleCoefficient of agreement: 0.973-0.99211 Gonial indexNo significant difference between the two measurements49,71 Incisure depthThe difference was 0.5mm17 Jawbone BMD by DXACoefficient of variance: 2.1%,19 2.2879 M/M ratio(or mandibular ratio)Coefficient of variation: 6.7%,19 2.8%84 No statistically significant difference between the 2 measurements71 Correlation(r): 0.86482 Reproducibility of measurements: 3.4%23 Mandibular angleKappa value: 0.81-0.9321 Mandibular cortical indexCorrelation coefficient: 75%-86%105 Kappa values: 0.708-0.830,78 0.661-0.783,27 0.77,87,88 0.34-0.92,61 0.8-0.92,60 0.47-0.89,93 0.74-0.96,49 0.66-0.77,19 0.80,81 0.82-0.92,23,48,90,96,99,101-103 0.72-0.82,97 0.775,98 0.851,82 0.19-0.75,100 0.436-0.67,91 0.81,24 0.70104 Coefficient of variance: 2.3879,89 Agreement 65.6%-79.8%.91 82%104 ; when calculated using computer software, agreement ranged from 0.86-0.908.44 Reliability: 0.993-0.99945 Kendall’s tau-b coefficient: 0.388 Mandibular cortical widthMaximum difference: 2.15mm,6 0.69mm42 Difference: 0.08mm,8,80,110 0.1mm,48,63,84,96,99,101,102,104,107,113,115 0.062mm,42 less than 2%,48,63,84,96,99,101,102,104,107,113 0.0-0.04-0.13mm12 The measurement error: approximately 0.25mm42 Intra-class correlation: 0.98-0.99,29 0.998,110 0.76-0.99,61 0.926,98 0.644-0.887,11 0.775-0.81278 Pearson correlation: 0.999,115 0.7-0.9,50 0.86982 Kappa coefficient: 0.9,29 0.8124 Accuracy of the classifications made using software: 90%108 Coefficient of variation: 2.8%,72 32.6-33.9%,118 1.84%70 Reliability: 85.1%,73 94%22 Reproducibility: 1.3%104 Statistically significant difference49,117 No statistically significant difference49,71,81,110
Table 5. Reproducibility of the indices analyzed in this study IndexReproducibility I. Panoramic indices Mental posterior indexKappa coefficient: 0.8124 Panoramic mandibular indexCoefficient of variation: 1.84%,70 12.3%19 Statistically significant difference49 No statistically significant difference between the 2 measurements49,71,81 Correlation: 0.87182 Rate of reproducibility: 94%57 Kappa coefficient: 0.929 Intraclass correlation: 0.98-0.99,29 0.692-0.72478 Radiographic densityNo significant difference between the 2 measurements,71 or between the right and left side of the panoramic radiographs14 Simple visual assessmentKappa value: 0.717-0.751,27 0.52-0.95,61 0.856,98 0.30-0.92113 Styloid process0.7mm equivalent to 2.11% of total variance28 II. Intraoral radiographs Bone structure analyses(trabecular bone)No significant difference between the 2 measurements47 Correlation: >0.847 Radiographic densityThe error of the method was 0.15mm Aluminum equivalent, and the reliability was 97%,32 intraobserver agreement: 0.93,53 agreement=0.87-0.9854 No significant difference between the 2 measurements47 Correlation: >0.847 Trabeculation(dense/spare/alternating dense)Correlation: 0.9332 Kappa value: 0.65-0.92,60 0.39-0.72122 III. CT/CBCT indices CBCT-cortical indexCorrelation: 0.62-0.8034 CBCT-mandibular index(superior-inferior)Correlation: 0.43-0.9534 CBCT-mental indexCorrelation: 0.84-0.9234 Radiographic density in gray values(CBCT)Kappa value: 0.8735 BMD: bone mineral density, DXA: dual-energy X-ray absorptiometry, M/M ratio: maxillary-mandibular ratio, CT: computed tomography, CBCT: cone-beam computed tomography
Table 5. Continued
might be the reason for its more widespread use as method of osteoporosis screening than periapical radiographs, which are more frequently indicated in general.40 Further- more, the wide variation of intraoral radiographs in the imaged area may be the reason that they are less popular for osteoporosis screening.40 Moreover, occlusal radio- graphy has not been used for diagnosing osteoporosis. It was used in some old studies,26,41 to measure the buccal- lingual thickness of the mandibular bone to adjust the densitometer calculated using panoramic and periapical radiographs. On the other hand, the inaccessibility, ex- pense, and high radiation dose of advanced dental imaging techniques reduce their utility as screening methods.
IDIOS is suggested as a useful comparative index due to the emergence of a large number of currently used indices, and in light of ongoing debates regarding their validity and reproducibility, along with the continuous evolution of newly developed imaging techniques, which then leads to the development of new indices. IDIOS acts as a refer- ence against which the current indices can be objectively evaluated. As a preliminary suggestion, IDIOS scores of 7.5-12(50%-80%) and above 12(>80%) may be consid- ered good and very good indicators, respectively, of the usefulness of the tested index as a screening tool for osteo- porosis.
While developing the IDIOS criteria, the power of the index was first calculated using the SN, SP, PPV, and NPV. However, most studies only reported the SN and SP of the indices they evaluated. Furthermore, PPV and NPV are statistical parameters derived from the SN and SP(i.e., they are SN- and SP-dependent values), and the power of various indices was nearly identical regardless of whether the PPV and NPV were included. Hence, the power crite- rion of IDIOS was limited to SN and SP.
In this study, the validity of the osteoporosis indices was tested in a collective manner based on the results re- ported in the literature. In the future, when a new study is performed on the detection of osteoporosis based on den- tal images, it would be helpful to provide the IDIOS score of the index or indices in question. This would aid readers in assessing the validity of each index and allow them to compare indices with each other.
IDIOS evaluations of the retrieved indices
The highest IDIOS scores were reported for MCW, bone structure analyses(on periapical radiographs), radio- graphic density in gray values(CBCT), and the mandibular cortical index(MCI), respectively. Although the MCI is subjective in nature and requires repeated training, which
explains its lower reproducibility, both indices, MCI and MCW, have been studied more extensively and in more depth than the other indices.
When the MCI was introduced by Klemetti et al.,22 they were not enthusiastic about its potential, so they did not recommend it for identifying osteoporosis in women. It is possible that Klemetti et al. expected a stronger correlation of jawbone measurements with bone fragility status. On- going research focuses on the development of the MCW and MCI indices. In 2007, Devlin et al.42 introduced a fully automated computer program for measuring the MCW.
It was not as useful as they thought, but they improved it and proved its usefulness in a later study.43 Although software for identifying MCI categories has been devel- oped,44 it was not found to be as useful as the MCW soft- ware.45 Similarly, some studies used complicated anal-
yses25,46-48 to improve the practicability of some indices
regarding differentiation between bone fragility groups;
however, these analyses unfortunately proved impractical.
Measuring the cortical width in other areas of the man- dibular cortex(e.g. gonial and antegonial indices)42,49,50 may achieve more precise values than the MCW, which is performed in the mental foramen region, but these mea- surements face some limitations. For example, it is unclear where exactly they should be performed, which poses challenges for reproducibility. For the MCW, however, the presence of an obvious characteristic radiolucent land- mark(the mental foramen) facilitated the development of a program to perform the relevant calculations auto- matically. One drawback of the MCW(and indices that depend on length measurements) is the fact that this index must be corrected for magnification.51,52 This means that calibrations of the measurements should be made, which might complicate the analysis process.
In contrast to the MCW, the panoramic mandibular index and alveolar bone resorption degree(maxillary/mandibu- lar ratio) are indices that proved to be ineffective(IDIOS power scores of 2.83 and 1.5, respectively), despite their high reproducibility scores. The final IDIOS score cannot be high unless all components are high, due to the fact that the nature of IDIOS depends on the summation of multiple values(especially its major components of the power and the reproducibility). This consideration may add to the utility of IDIOS.
Although the results of the relevant studies remain con- tradictory, measuring radiographic density appears to be a promising approach for predicting osteoporosis. Indi- ces using CBCT35 and periapical radiographs53,54 for this purpose had the third-highest and the fifth-highest IDIOS
scores(10.25[68.33%] and 9.02[60.11%], respectively).
This approach was not thoroughly evaluated in the litera- ture for panoramic radiography(no study reported the SN and SP of radiographic density assessed using panoramic radiography), hence its IDIOS score was low(1[6.7%]).
The radiographic density measurements made using multi- detector CT analyzed by Naitoh et al.38 revealed a weak correlation between the radiographic density of the man- dibular trabecular bone and the lumbar spine BMD; thus, its IDIOS score was low. The inclusion of the cortical bone in the measurement process in the CBCT-based study performed by Barngkgei et al.35 may be the reason for the improved correlation between radiographic density and BMD.Changes in the trabecular bone of the femoral neck during osteoporosis were confirmed many years ago.55 However, many studies found that trabecular bone mea- surements of the mandible were useless for osteoporosis prediction,35,36,38,56,57 in contrast to the correlation be- tween cortical measurements(thickness or density mea- sures), and the BMD of the femoral neck and lumbar ver- tebrae.35,57,58 A recent study found statistically significant correlations between DXA and the values of Hounsfield units acquired by CT and micro-CT of the mandibular cortex, but not of the mandibular trabecular bone.59 In a 24-year follow-up study, changes of the trabecular bone (toward sparse trabeculation) were not as obvious as the changes of the cortical bone(toward an eroded cortex).60 Two intraoral imaging-based studies25,46 found alterna- tions of the trabecular bone pattern; however, these stud- ies had small sample sizes and significant effects were only found in combination with clinical variables.25 Ad- vanced high-resolution imaging or functional imaging techniques(e.g., isotopes) may be future possibilities for exploring the actual influence of osteoporosis on trabecu- lar bone in the jaws.
Simple visual assessment of the cortices on panoramic radiographs may be a useful tool, somewhat similar to the MCI, with an IDIOS score of 8.4(55.7%). However, such indices are not considered objective and require consid- erable amount of training, which results in poor overall agreement.61 This also applies to visual assessments of the trabecular bone. In any case, trabecular bone sparse- ness was found to increase with age.60
Many panoramic radiography-derived indices other than those discussed above have been suggested(e.g., sty- loid process length, alveolar bone resorption, hierarchic segmentation analysis, antegonial measurements[angles and depth], mandibular angle, and calcified carotid artery
plaques),7,11,16,28 but they have not been thoroughly evalu- ated in well-designed studies.
The appropriate and standardized reporting of results will facilitate comparisons among different studies. The power of IDIOS is based on SN and SP, which are the most useful biostatistical parameters in the context of diagnosis/screening studies. Many studies, however, in- appropriately used simple correlation/relationship statis- tics to evaluate the relationships between measurements of dental images and DXA results, instead of using SN and SP. This did not allow a thorough evaluation of the screening power of the index in question, which is why many indices received a low IDIOS score. Ultimately, further evaluation is needed before making the final judg- ment of such indices.
Repeatability of measurements
A diagnostic tool is worthless if repeatability is not guaranteed, which is why reproducibility is a built-in cri- terion in IDIOS. Hence, calculating and reporting statis- tical parameters relating to reproducibility is paramount, and reporting even low values of these parameters is bet- ter than confusing readers by not reporting them. Many indices have not been evaluated for reproducibility, and such indices cannot be considered trustworthy tools. How- ever, in one study of the OSTEODENT project,62 the re- sults of one of the observers suggested that the MCI was not useful in osteoporosis screening, unlike the other ob- servers. On the whole, such a study is more reliable than studies that do not report reproducibility parameters at all.
Many studies63-65 were designed to test the extent to which trained or untrained dentists could apply certain indices.
In a study evaluating the reproducibility of the MCI, it was found that this index exhibited poor intraobserver and interobserver agreement. Moreover, minimal training in assessing the MCI(such as might be given in a lecture format) was found to be ineffective, and was associated with poor interobserver agreement and limited diagnostic validity in identifying the signs of osteoporosis.66 Thus, one might ask whether it is possible to generalize the use of these indices among untrained dentists or whether the results were valid. This is why objectivity was used as an additional criterion when calculating IDIOS. It should be emphasized, however, that in most of the studies analyzed in this study, experienced oral radiologists assessed the radiological measurements.
Furthermore, a study comparing digital and convention- al panoramic radiographs found that digital panoramic radiographs were better than analog radiographs for mea-
suring panoramic indices.67 Using software developed for specific measurements would resolve these reproducibil- ity-related issues. This is why the presence of specialized software was included as one of the IDIOS criteria. In addition, the software criterion will encourage those inter- ested in programming to create software to perform such analyses automatically.
Limitations of the included studies and suggestions for future research
Many of the studies we analyzed did not contain cases of osteopenia. The main aim of osteoporosis screening indices is the opportunistic screening of osteoporosis-that is, to detect the early stages of the disease, which may be classified as osteopenia. The accuracy of a diagnostic tool cannot be established without determining the capability of this tool to distinguish all individuals with a given con- dition from those with closely related conditions(such as osteopenia in this case). If a tool does not detect osteope- nia, its efficacy as a diagnostic tool cannot be established.
This is why the inclusion of all bone fragility groups was one of the IDIOS criteria.
The validity of IDIOS is a major question. However, in addition to the retrospective application of IDIOS to the current indices, its validity can be evaluated by con- ducting future studies on osteoporosis screening using dental images. Regardless of whether the indices are new or old, the IDIOS score will show if it is valid or not. For example, if an index proven to be effective in osteoporo- sis screening has a high IDIOS score, that finding would support the validity of IDIOS, and vice versa.
Finally, fracture risk assessment has become an import- ant topic in research related to osteoporosis. The IDIOS criteria may be applied to test the validity of fracture risk assessment rather than detecting osteoporosis. In addition, recent advances in some techniques(e.g., quantitative CT) that assess more than one aspect of bone quality, in comparison to DXA which measures BMD alone, may be used to assess an individual’s future risk of bone fracture.
Attempts to find correlations or relationships between the measurements derived from advanced techniques and dental imaging indices may lead to completely different results(i.e., higher IDIOS scores). This may be a topic for future research.
In conclusion, the findings of the current study can be summarized as follows:
1. Numerous indices have been suggested for osteopo- rosis screening based on dental images. These indices
differ in their power to detect osteoporosis. It is expect- ed that new indices will be developed as a result of the continuous development of new imaging techniques, new analytical procedures, and new assessment pro- grams.
2. IDIOS is an objective reference index to evaluate the osteoporosis detection indices in current use. In this study, this index was applied in a collective manner, assessing the results reported in all papers that were in- cluded.
3. The MCW, bone structure analyses on periapical radio- graphs, radiographic density in gray values(CBCT), and the MCI had the highest IDIOS scores(11.75[78.32%], 11[73.33%], 10.25[68.33%], and 9.72[64.77%], respec- tively).
4. When performing a new study on the detection of os- teoporosis based on dental images, it would be helpful to calculate the IDIOS scores of the relevant indices.
This would aid readers in assessing the validity of each index and allow the comparison of indices with each other and with the results reported in other papers.
5. As the maximum IDIOS score was 11.75(78.32%), it is clear that dental images are not yet an adequate sub- stitute for conventional methods of diagnosing osteopo- rosis.
references
1. NIH Consensus Development Panel on Osteoporosis Preven- tion, Diagnosis, and Therapy, March 7-29, 2000: highlights of the conference. South Med J 2001; 94: 569-73.
2. Assessment of fracture risk and its application to screening for postmenopausal osteoporosis. Report of a WHO Study Group.
World Health Organ Tech Rep Ser 1994; 843: 1-129.
3. Guglielmi G. Preface. Imaging of osteoporosis. Radiol Clin North Am 2010; 48: xv.
4. United Nations Scientific Committee on the Effects of Atomic Radiation. Hereditary effects of radiation: UNSCEAR Report to the general assembly with scientific annex. New York:
United Nations; 2001.
5. Mozzo P, Procacci C, Tacconi A, Martini PT, Andreis IA. A new volumetric CT machine for dental imaging based on the cone-beam technique: preliminary results. Eur Radiol 1998; 8:
1558-64.
6. Karayianni K, Horner K, Mitsea A, Berkas L, Mastoris M, Jacobs R, et al. Accuracy in osteoporosis diagnosis of a com- bination of mandibular cortical width measurement on dental panoramic radiographs and a clinical risk index(OSIRIS): the OSTEODENT project. Bone 2007; 40: 223-9.
7. Passos JS, Gomes Filho IS, Sarmento VA, Sampaio DS, Gonçalves FP, Coelho JM, et al. Women with low bone min- eral density and dental panoramic radiography. Menopause
![Table 2. Panoramic radiography-based osteoporosis screening indices included in this study(sorted alphabetically) IndexReferencesStatistical resultsIDIOS score(%)[subscores]* Anatomical indices (relative or absolute linear measurements)](https://thumb-ap.123doks.com/thumbv2/123dokinfo/5234202.128221/3.892.94.823.44.1090/panoramic-radiography-osteoporosis-alphabetically-indexreferencesstatistical-resultsidios-anatomical-measurements.webp)