Introduction
Cone-beam computed tomography(CBCT) has gained versatile applications due to its sub-millimeter spatial res- olution, relatively low cost, and low radiation dose admin- istered compared to conventional computed tomography.
Linear CBCT measurements are mainly used for pre-sur- gical implant planning to determine the available bone
dimensions and distance from the vital anatomical struc- tures.1,2 Orthodontic analyses and determination of lesion dimensions in the jaws also require linear measurements.3-5
Studies of the accuracy of CBCT-based measurements have produced conflicting results. While most studies have indicated the presence of measurement errors of less than 1mm, some have reported errors as high as 6mm. A dimensional inaccuracy of one-tenth of a millimeter has been reported to be sufficient to jeopardize the outcomes of surgical procedures such as implant insertion.6-9 Injury to the neurovascular bundle and resultant neuroma, par- esthesia, anesthesia, and hemorrhage are the most serious consequences of errors originating from inaccurate mea-
Effect of slice inclination and object position within the field of view on the measurement accuracy of potential implant sites on cone-beam computed tomography
Bardia Vadiati Saberi 1, Negar Khosravifard 2,*, Alireza Nourzadeh 3
1Dental Sciences Research Center, Department of Periodontics, School of Dentistry, Guilan University of Medical Sciences, Rasht, Iran
2Dental Sciences Research Center, Department of Maxillofacial Radiology, School of Dentistry, Guilan University of Medical Sciences, Rasht, Iran
3Department of Maxillofacial Radiology, School of Dentistry, Guilan University of Medical Sciences, Rasht, Iran
ABSTRACT
Purpose: The purpose of this study was to evaluate the accuracy of linear measurements in the horizontal and vertical dimensions based on object position and slice inclination in cone-beam computed tomography(CBCT) images.
Materials and Methods: Ten dry sheep hemi-mandibles, each with 4 sites(incisor, canine, premolar, and molar), were evaluated when either centrally or peripherally positioned within the field of view(FOV) with the image slices subjected to either oblique or orthogonal inclinations. Four types of images were created of each region: central/
cross-sectional, central/coronal, peripheral/cross-sectional, and peripheral/coronal. The horizontal and vertical dimensions were measured for each region of each image type. Direct measurements of each region were obtained using a digital caliper in both horizontal and vertical dimensions. CBCT and direct measurements were compared using the Bland-Altman plot method. P values <0.05 were considered to indicate statistical significance.
Results: The buccolingual dimension of the incisor and premolar areas and the height of the incisor, canine, and molar areas showed statistically significant differences on the peripheral/coronal images compared to the direct measurements(P<0.05). Molar area height in the central/coronal slices also differed significantly from the direct measurements(P<0.05). Cross-sectional images of either the central or peripheral position had no marked difference from the gold-standard values, indicating sufficient accuracy.
Conclusion: Peripheral object positioning within the FOV in combination with applying an orthogonal inclination to the slices resulted in significant inaccuracies in the horizontal and vertical measurements. The most undesirable effect was observed in the molar area and the vertical dimension.(Imaging Sci Dent 2020; 50: 37-43)
KEY WORDS: Cone-Beam Computed Tomography; Dimensional Measurement Accuracy; Patient Positioning
Copyright ⓒ 2020 by Korean Academy of Oral and Maxillofacial Radiology
This is an Open Access article distributed under the terms of the Creative Commons Attribution Non-Commercial License(http://creativecommons.org/licenses/by-nc/3.0) which permits unrestricted non-commercial use, distribution, and reproduction in any medium, provided the original work is properly cited.
Imaging Science in Dentistry·pISSN 2233-7822 eISSN 2233-7830 Received August 7, 2019; Revised November 12, 2019; Accepted November 20, 2019
*Correspondence to : Dr. Negar Khosravifard
Department of Maxillofacial Radiology, School of Dentistry, GUMS Complex, Saravan-Fouman Ring Road, Rasht, Iran
Tel) 98-1333363622, E-mail) [email protected]
surements.10
Several factors, including slice thickness, voxel size, and head orientation, have been proposed as contribu- tors to the amount of distortion in linear CBCT measure- ments.11,12 Contemporary devices provide various choices for the field-of-view(FOV) size as well as the position of the region of interest(ROI) within the FOV. It is assumed that central or peripheral positioning of the ROI in the FOV influences the magnitude of inaccuracy in the final image.13,14 Moreover, most CBCT software allows slices to be obtained in any orthogonal and non-orthogonal di- rection, which is likely to provide varying measurement results.10 The purpose of the present study was to de- termine the concomitant influence of object positioning within the FOV and slice inclination on the accuracy of linear measurements obtained from CBCT images of po- tential implant sites.
Materials and Methods
This in vitro experimental study received approv- al from the research ethics committee of Guilan Uni- versity of Medical Sciences(Approval ID: IR.GUMS.
REC.1397.076). Dry sheep hemi-mandibles of similar dimensions were used to simulate the alveolar bone.13 All hemi-mandibles in this study contained 4 distinct ar- eas: incisor, canine, premolar, and molar. Furthermore, the buccal and lingual cortical plates of all samples were intact. Hemi-mandibles with disrupted cortices, unusu- al bony undercuts, or evidence of previous bony lesions were excluded from the investigation.
Preparation of the samples
Ten dry sheep hemi-mandibles were selected for the study. The areas to be assessed in each hemi-mandible were determined according to the criteria described by Neves et al.10 which defined the incisor region to be 1cm distal from the mid-sagittal plane, the canine region 1cm distal from the former, and the premolar and molar re- gions at the mental foramen and 1-2cm distal to the men- tal foramen, respectively. A total of 40 areas were avail- able for measurement. Radiopaque gutta-percha markers (size 30; Meta Biomed, Cheongju, Korea) were fixed par- allel to each other on the buccal and lingual sides of the 4 areas of each hemi-mandible. Care was taken to position the buccal and lingual markers exactly facing each other by using threads to ensure standardized regions for ob- taining the measurements. Each hemi-mandible was coat- ed with 1.5cm of wax to simulate soft tissue density.15
Radiographic examinations
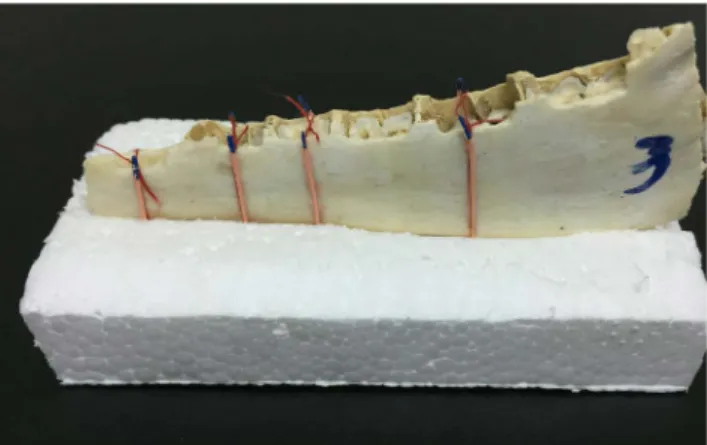
A rectangular piece of plastic foam was prepared with a 2-mm-deep longitudinal central slit for insertion of the hemi-mandibles(Fig. 1). Use of the plastic foam ensured the fixed position of each hemi-mandible during the ra- diographic examination.
The CBCT examinations were performed with a Pax-i 3D unit(Vatech, Hwaseong, Korea). The exposure proto- col was as follows: 95kV; 5.2mA; FOV, 150mm×150 mm; and voxel size, 0.2mm. Each hemi-mandible under- went 2 CBCT exposures while centrally and peripherally positioned. For the centrally positioned exposures, the plastic foam containing the hemi-mandible was placed on a straight line passing through the center of the FOV anteroposteriorly. The horizontal and vertical positions of exposures were kept on ‘center’ and ‘mandible’ settings, respectively. Peripherally positioned exposures were ac- quired by placing the hemi-mandibles on an oblique line that anteriorly formed an angle of 20° with the anterior end of the central line and posteriorly was 5cm distanced from the posterior end of the central line of the FOV(Fig. 2).
Radiographic assessments
In each of the central and peripheral exposures, image slices were created with 2 inclinations: cross-sectional (non-orthogonal) and coronal(orthogonal). Cross-sec- tional slices were created in the “section” part of the soft- ware(Ez3D-i, Vatech) by manually drawing a curved line through the center of the bone in the axial plane, resulting in the automatic creation of cross-sectional images in the buccolingual direction that were roughly perpendicular to the curved drawn line and therefore were oriented oblique- ly in relation to the buccolingual aspect of the bone. The
Fig. 1. A hemi-mandible fixed in the central slit of a plastic foam block. The 4 regions are defined by gutta-percha markers on the buccal and lingual sides.
thickness and interval of the slices were set at 1mm.
Coronal slices were acquired from the orthogonal slices that were provided automatically by the “MPR” section of the software. These slices were of the same thickness and interval as the cross-sectional slices.
For each region of the hemi-mandibles, the coronal slice corresponding to the full length of the buccal and lingual radiopaque markers was selected and stored as a saved project. A cross-sectional slice of each region that revealed the maximum extent(not necessarily the full length) of the markers was also selected and saved as a project. Displaying the full length of the buccolingual markers in a single cross-sectional slice was not possible, since in contrast to the coronal slices, cross-sectional slic- es do not pass perpendicularly through the center of the bone in the buccolingual direction.
In total, 4 types of image slices were saved for each re- gion: central/cross-sectional, central/coronal, peripheral/
cross-sectional, and peripheral/coronal. The saved image slices of each region were randomly presented to an ex- perienced maxillofacial radiologist with no knowledge of the real measurement values. The radiologist was asked to measure the buccolingual and vertical dimension(height) of the bone for each image type. The buccolingual dimen- sion was defined as the horizontal distance between the buccolingual radiopaque markers on their crestal portion.
Bone height was defined as the vertical distance from the superior crest to the inferior cortex of the bone(Fig. 3).
All measurements were performed twice, with measure- ments separated by a 2-week interval. Finally, for each re-
gion, the mean values of the first and second observations were calculated and recorded as the buccolingual dimen- sion and height for that specific area on the associated image type. All images were displayed on a medical LCD monitor(RadiForce MX241W; EIZO Corporation, Haku- san, Japan). As the images were stored as saved projects, neither the slices nor their inclinations could be altered by the observer. This ensured that the observer only assessed the determined areas.
Upon completion of the CBCT measurements, the buc- colingual dimension and height of each region were di- rectly measured using the gold-standard technique involv- ing a digital caliper(SC-6; Mitutoyo Corporation, Kawa- saki, Japan). The buccolingual dimension was measured as the horizontal distance between the crestal portion of the buccal and lingual markers of each region. Height was measured as the vertical distance between the superior cr- estal and inferior cortical portions of each area.
Statistical analysis
Data were imported to MedCalc statistical software version 18.9.1(MedCalc Inc., Ostend, Belgium). Com- parison of the measurements obtained from the different image slices with the gold-standard values was performed using the Bland-Altman method. P<0.05 was considered to indicate statistical significance.
Results
Measurements obtained from the cross-sectional slices
Fig. 2. Axial images of centrally(A) and peripherally positioned(B) exposures of a hemi-mandible.
A B
in both the central and peripheral positions did not show significant discrepancies from the directly measured val- ues in the horizontal and vertical dimensions in any of the 4 assessed regions(P>0.05).
The coronal slice measurements in the central position were also consistent with the direct values, except for the molar area height, which was overestimated by a mean of 0.34mm(P=0.01).
The coronal slices in the peripheral position showed the greatest amount of measurement discrepancy, which man- ifested as overestimation of the buccolingual dimension of the incisor and premolar areas by 0.56mm and 0.61 mm, respectively(P<0.05). Furthermore, the incisor, canine, and molar area heights were overestimated by an average of 0.34mm, 0.67mm, and 0.67mm, respectively (P<0.05).
Table 1 shows the mean differences in the upper and lower limits of the buccolingual dimension and height values obtained with each type of image slice compared to the gold-standard measurements with the Bland-Alt- man method. In this method, upper limits were designat-
ed as cases in which the test method measurements were greater than the real measurements, while cases in which the real measurements were greater were used to desig- nate lower limits. P<0.05 was considered to indicate sta- tistical significance.
Discussion
In the present study, different images were created of each region by placing the hemi-mandibles in the center or periphery of the FOV and applying non-orthogonal (oblique) and orthogonal(coronal) inclinations to the slic- es. Measurement accuracy was subsequently assessed in the horizontal and vertical dimensions. We intended to determine the influence of simultaneously altering the object position and slice inclination on measurement ac- curacy, since to our knowledge, the concomitant effect of manipulating these 2 variables has not been previously investigated.
Although CBCT manufacturers recommend optimal pa- tient positioning during image acquisition, patients with
A B
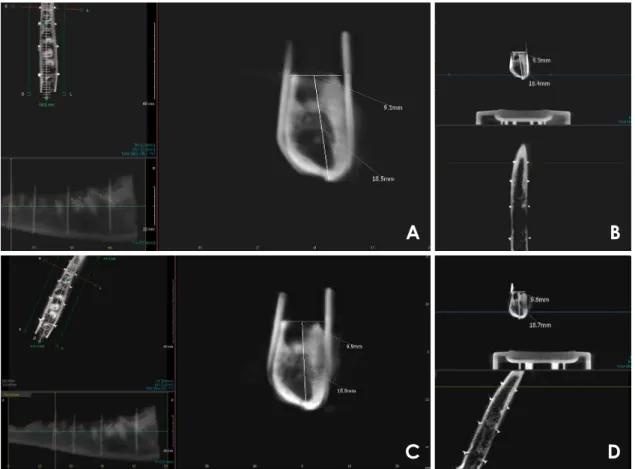
C D
Fig. 3. Various image types of the same region with buccolingual and height measurements. A. Central/coronal. B. Central/cross-sectional.
C. Peripheral/coronal. D. Peripheral/cross-sectional.
skeletal malformations and malocclusions are likely to be positioned improperly within the device.16 This prevents some portions of the jaw from being ideally positioned within the center of the FOV. However, contemporary CBCT software tools have the capability of creating im- age slices in any desired direction in accordance with the concept that CBCT benefits from isotropic voxel reso- lution.10 Given the potential of these variations to yield different results, their impact on the accuracy of the mea- surements must be fully investigated. Considering that CBCT images are routinely used for the pre-surgical plan- ning of potential implant sites, measurement errors could result in faulty decisions regarding implant size and type, as well as the need for augmentation procedures.
Studies of the reliability of CBCT volumetric measure- ments in orthodontic patients have failed to show signif- icant discrepancies;17,18 however, investigations of linear measurements of potential implant sites have yielded con- flicting results under certain circumstances.19 This may be attributed to the fact that implant site measurements are much more sensitive than orthodontic volumetric evalua- tions. A discrepancy of one-tenth of a millimeter is suffi- cient to threaten the integrity of regional cortical bound- aries and vital anatomical structures such as the inferior alveolar nerve.9
Moshfeghi et al.20 found no significant difference in the linear measurements obtained from the axial and coronal slices and with different voxel sizes. This finding could be attributed to the similar nature of these 2 slice types, both of which are orthogonally oriented. However, Neves et al.10 evaluated vertical measurements in the oblique (cross-sectional) and orthoradial(coronal) slices of differ- ent jaw regions and concluded that vertical measurements of the coronal slices in the molar region lack sufficient accuracy compared to cross-sectional slices. Similarly, in the present study, a significant difference was encoun- tered between direct measurements and measurements obtained from the coronal slices of the molar area in the central position(P<0.05). These differences were even more pronounced in the peripheral position, as coronal slices yielded inaccurate measurements in the horizontal dimension of the incisor and premolar areas, as well as the vertical dimension of the incisor, canine, and molar regions(P<0.05).
Sabban et al.9 and Visconti et al.11 assessed the accuracy of measurements made with different head orientations.
They applied tilt, flexion, and extension movements with a deviation of 20°. Measurement errors ranging between -2mm and 3mm were observed in different jaw regions.
Table 1. Mean differences(MDs) of the buccolingual dimension(BL) and height of the different image types compared to direct measurements by region(unit: mm) Image typeIncisor regionCanine regionPremolar regionMolar region MD of BLMD of height MD of BLMD of heightMD of BLMD of height MD of BLMD of height Central/cross- sectional
0.16 (0.49, -0.17)-0.27 (0.10, -0.63)-0.25 (-0.04, -0.50)-0.16 (0.22, -0.54)-0.02 (0.37, -0.42)-0.11 (0.17, -0.39)-0.35 (-0.09, -0.61)0.14 (-0.14, 0.41) Central/ coronal-0.04 (0.39, -0.47)-0.07 (0.33, -0.46)-0.31 (0.03, -0.65)-0.32 (0.09, -0.73)-0.04 (0.32, -0.41)-0.04 (0.16, -0.24)-0.15 (0.31, -0.61)0.34 (1.33, -0.65)*
Peripheral/cross- sectional
-0.04 (0.37, -0.45)-0.12 (0.18, -0.41)-0.18 (0.02, -0.38)0.26 (-0.16, 0.68)0.16 (0.62, -0.31)0.07 (-0.15, 0.29)0.20 (0.20, 0.21)0.26 (0.78, -0.25) Peripheral/ coronal0.56 (0.95, 0.16)*0.34 (0.10, 0.57)*0.34 (1.33, -0.65)0.67 (0.24, 1.10)*0.61 (1.12, 0.09)*0.09 (1.06, -0.88)0.63 (1.48, -0.21)0.67 (0.24, 1.10)* MD: calculated from the upper and lower limits obtained using the Bland-Altman method. *: P<0.05
In the present study, peripheral positioning was obtained by placing the hemi-mandibles 20° laterally from the cen- ter of the FOV to simulate abnormal conditions such as jaw asymmetry or head rotation during patient position- ing. Peripheral/coronal slices showed the greatest amount of inaccuracy, which was up to 0.63mm for the hori- zontal measurements and 0.67mm for the vertical mea- surements. The molar region was the area most strongly affected by measurement discrepancies, as coronal slices of this region showed significant inaccuracy even in the central position.
With regard to dimension, vertical measurements gen- erally tended to be more severely affected than horizontal measurements. Similarly, Sabban et al.9 suggested that vertical measurements are relatively susceptible to inac- curacy since the bone volume displaced eccentrically in the image layer is greater in the vertical dimension. This is concerning, since vertical errors usually result in more undesirable outcomes in the anatomical relationship of the implants with their surrounding structures.
Within the limitations of this in vitro study, it can be concluded that simultaneous peripheral positioning of the ROI in the FOV and application of orthogonal(coronal) slices result in the greatest amount of measurement inac- curacy. The molar area and vertical dimension are at par- ticularly high risk for overestimation by CBCT measure- ments, especially when not positioned ideally within the FOV.
Conflicts of Interest: None
Acknowledgements
The authors would like to thank Dr. Mohammad Ebra- him Ghaffari(Department of Biostatistics, Guilan Univer- sity of Medical Sciences) for the statistical consults.
References
1. Lascala CA, Panella J, Marques MM. Analysis of the accura- cy of linear measurements obtained by cone beam computed tomography(CBCT-NewTom). Dentomaxillofac Radiol 2004;
33: 291-4.
2. Kosalagood P, Silkosessak OC, Pittayapat P, Pisarnturakit P, Pauwels R, Jacobs R. Linear measurement accuracy of eight cone beam computed tomography scanners. Clin Implant Dent Relat Res 2015; 17: 1217-27.
3. Hassan B, van der Stelt P, Sanderink G. Accuracy of three-di- mensional measurements obtained from cone beam computed tomography surface-rendered images for cephalometric analy- sis: influence of patient scanning position. Eur J Orthod 2009;
31: 129-34.
4. Timock AM, Cook V, McDonald T, Leo MC, Crowe J, Ben- ninger BL, et al. Accuracy and reliability of buccal bone height and thickness measurements from cone-beam com- puted tomography imaging. Am J Orthod Dentofacial Orthop 2011; 140: 734-44.
5. Mah J, Hatcher D. Three-dimensional craniofacial imaging.
Am J Orthod Dentofacial Orthop 2004; 126: 308-9.
6. Kobayashi K, Shimoda S, Nakagawa Y, Yamamoto A. Ac- curacy in measurement of distance using limited cone-beam computerized tomography. Int J Oral Maxillofac Implants 2004; 19: 228-31.
7. Frei C, Buser D, Dula K. Study on the necessity for cross-sec- tion imaging of the posterior mandible for treatment planning of standard cases in implant dentistry. Clin Oral Implants Res 2004; 15: 490-7.
8. Ludlow JB, Laster WS, See M, Bailey LJ, Hershey HG. Ac- curacy of measurements of mandibular anatomy in cone beam computed tomography images. Oral Surg Oral Med Oral Pathol Oral Radiol Endod 2007; 103: 534-42.
9. Sabban H, Mahdian M, Dhingra A, Lurie AG, Tadinada A.
Evaluation of linear measurements of implant sites based on head orientation during acquisition: an ex vivo study using cone-beam computed tomography. Imaging Sci Dent 2015;
45: 73-80.
10. Neves FS, Vasconcelos TV, Oenning AC, de Azevedo-Vaz SL, de Almeida SM, Freitas DQ. Oblique or orthoradial CBCT slices for preoperative implant planning: which one is more accurate? Braz J Oral Sci 2014; 13: 104-8.
11. Visconti MA, Verner FS, Assis NM, Devito KL. Influence of maxillomandibular positioning in cone beam computed tomography for implant planning. Int J Oral Maxillofac Surg 2013; 42: 880-6.
12. Shokri A, Khajeh S. In vitro comparison of the effect of different slice thicknesses on the accuracy of linear measure- ments on cone beam computed tomography images in implant sites. J Craniofac Surg 2015; 26: 157-60.
13. Nikbin A, Dalili Kajan Z, Taramsari M, Khosravifard N. Ef- fect of object position in the field of view and application of a metal artifact reduction algorithm on the detection of vertical root fractures on cone-beam computed tomography scans: an in vitro study. Imaging Sci Dent 2018; 48: 245-54.
14. Alkhader M, Hudieb M, Jarab F, Shaweesh A. The visibility of mandibular canal on orthoradial and oblique CBCT slices at molar implant sites. Biotechnol Biotechnol Equip 2016; 30:
770-6.
15. Kamburoğlu K, Murat S, Kılıç C, Yüksel S, Avsever H, Far- man A, et al. Accuracy of CBCT images in the assessment of buccal marginal alveolar peri-implant defects: effect of field of view. Dentomaxillofac Radiol 2014; 43: 20130332.
16. Dawood A, Brown J, Sauret-Jackson V, Purkayastha S. Opti- mization of cone beam CT exposure for pre-surgical evalua- tion of the implant site. Dentomaxillofac Radiol 2012; 41: 70- 17. Moreira CR, Sales MA, Lopes PM, Cavalcanti MG. Assess-4.
ment of linear and angular measurements on three-dimension- al cone-beam computed tomographic images. Oral Surg Oral Med Oral Pathol Oral Radiol Endod 2009; 108: 430-6.
18. Frongia G, Piancino MG, Bracco P. Cone-beam computed to- mography: accuracy of three-dimensional cephalometry anal- ysis and influence of patient scanning position. J Craniofac Surg 2012; 23: 1038-43.
19. Rokn AR, Hashemi K, Akbari S, Kharazifard MJ, Barikani H, Panjnoosh M. Accuracy of linear measurements using cone
beam computed tomography in comparison with clinical mea- surements. J Dent(Tehran) 2016; 13: 333-9.
20. Moshfeghi M, Tavakoli MA, Hosseini ET, Hosseini AT, Hos- seini IT. Analysis of linear measurement accuracy obtained by cone beam computed tomography(CBCT- NewTom VG).
Dent Res J(Isfahan) 2012; 9(Suppl 1): S57-62.