https://doi.org/10.5624/isd.2019.49.2.159
Introduction
Three-dimensional(3D) cephalometric evaluations have always been a challenge and an important research topic in orthodontics. Such evaluations are conventionally per- formed by combining the data from panoramic radiographs with lateral and posterior-anterior(PA) cephalograms.
Two-dimensional images have a number of limitations re- lated to the type of projection, including distortion; an in- appropriate position of the head in the 3 dimensions(pitch,
roll, yaw); overlapping of the anatomical structures; differ- ences in magnification between the farther and the nearer side of the film due to the geometry of the X-ray beam; and anatomical differences between the right and left sides.1,2
Cone-beam computed tomography(CBCT) is a widely used tool in orthodontics and maxillo-facial surgery for 3D evaluations of cranio-maxillo-facial relationships, and it is usually preferred because it involves a lower radiation dose and lower costs than spiral CT, it allows the precise and ac- curate visualization of anatomical structures, and it makes it easier to obtain high-quality information than is possible using conventional 2D radiographs.3,4
CBCT allows “CBCT-reconstructed” lateral and PA cephalograms to be obtained, as well as 3D reconstruction of the patient’s skull. A mathematical algorithm calcu-
Use of an anatomical mid-sagittal plane for 3-dimensional cephalometry: A preliminary study
Roberto Antonio Vernucci 1,*, Huseynagha Aghazada 1, Kelly Gardini 1, Danilo Alunni Fegatelli 2, Ersilia Barbato 1, Gabriella Galluccio 1, Alessandro Silvestri 1
1Department of Oral and Maxillofacial Sciences, School of Dentistry, Sapienza University of Rome, Rome, Italy
2Department of Public Health Infectious Diseases, Sapienza University of Rome, Rome, Italy
AbstrAct
Purpose: Cone-beam computed tomography(CBCT) is widely used for 3-dimensional assessments of cranio-maxillo- facial relationships, especially in patients undergoing orthognathic surgery. We have introduced, for reference in CBCT cephalometry, an anatomical mid-sagittal plane(MSP) identified by the nasion, the midpoint between the posterior clinoid processes of the sella turcica, and the basion. The MSP is an updated version of the median plane previously used at our institution for 2D posterior-anterior cephalometry. This study was conducted to test the accuracy of the CBCT measures compared to those obtained using standard posterior-anterior cephalometry.
Materials and Methods: Two operators measured the inter-zygomatic distance on 15 CBCT scans using the MSP as a reference plane, and the CBCT measurements were compared with measurements made on patients’ posterior- anterior cephalograms. The statistical analysis evaluated the absolute and percentage differences between the 3D and 2D measurements.
results: As demonstrated by the absolute mean difference(roughly 1 mm) and the percentage difference(less than 3%), the MSP showed good accuracy on CBCT compared to the 2D plane, especially for measurements of the left side.
However, the CBCT measurements showed a high standard deviation, indicating major variability and low precision.
conclusion: The anatomical MSP can be used as a reliable reference plane for transverse measurements in 3D cephalometry in cases of symmetrical or asymmetrical malocclusion. In patients who suffer from distortions of the skull base, the identification of landmarks might be difficult and the MSP could be unreliable. Becoming familiar with the relevant software could reduce errors and improve reliability.(Imaging Sci Dent 2019; 49: 159-69)
Key words: Cephalometry; Cone-Beam Computed Tomography; Dimensional Measurement Accuracy
Copyright ⓒ 2019 by Korean Academy of Oral and Maxillofacial Radiology
This is an Open Access article distributed under the terms of the Creative Commons Attribution Non-Commercial License(http://creativecommons.org/licenses/by-nc/3.0) which permits unrestricted non-commercial use, distribution, and reproduction in any medium, provided the original work is properly cited.
Imaging Science in Dentistry·pISSN 2233-7822 eISSN 2233-7830 Received August 8, 2018; Revised February 2, 2019; Accepted February 20, 2019
*Correspondence to: Dr. Roberto Antonio Vernucci
Department of Oral and Maxillofacial Sciences, School of Dentistry, Sapienza University of Rome, Via Caserta 6, 00161 Roma, Italy
Tel) 39-06-4997-6611, E-mail) roberto.vernucci@uniroma1.it
lates and eliminates the effects of magnification during the CBCT reconstruction, so that the reconstructed 3D image presents a 1 : 1 ratio of the patient’s real skull. It is possible to improve the visibility of anatomical features, includ- ing soft tissues, by digitally removing the structures that generate overlapping in traditional 2D cephalograms(e.g., vertebrae in the PA projection). Furthermore, image ma- nipulation allows a cephalometric comparison of the right and left sides of the skull to be performed, or both sides to be overlapped if an asymmetry is present.5,6 However, routine CBCT use for these purposes remains controversial because of its higher radiation dose than conventional 2D radiographs.
Patients undergoing orthognathic surgery often suffer fr- om a dento-facial deformity involving all 3 spatial planes, ma king them suitable for a 3D evaluation using CBCT, as the sum of the radiation dose of the single 2D conventional X-ray images necessary for the orthodontic-surgical diag- nosis exceeds the dose from a CBCT scan. Most studies published in the literature about CBCT were in fact based on pre-surgical CBCT scans of orthodontic-surgical pa- tients.1
Research on CBCT should focus on fully understanding the data available through CBCT and/or on providing a di f- f erent interpretation of these data to improve diagnoses and / or treatment plans.7
The protocol for 3D cephalometric evaluation must in- clude a learning curve for clinicians, as they shift away from well-known 2D cephalograms, start localizing ceph- alometric landmarks in the 3D environment, and become familiar with the image processing software.8-10 However, a standardised, validated, and widely-used 3D cephalometry process, based on a series of consistent and reproducible data, has not been achieved yet.6
In the Unit of Orthodontics of the Department of Oral and Maxillofacial Sciences of the Sapienza University of Rome, the PA cephalometric analysis currently used for the evaluation of orthodontic-surgical patients is based on a median reference plane given by the perpendicular plane passing through the midpoint of the inter-zygomatic line(the line joining the medial points of the right and left fronto-zygomatic sutures; Zr and Zl).11 Updating this pro- tocol for 3D cephalometry involved setting an anatomical mid-sagittal plane(MSP) as the reference plane, identified by 3 median landmarks: the nasion, the midpoint between the posterior clinoid processes of the sella turcica(PCM), and the basion.
The purpose of this study was to test the clinical accura- cy of the anatomical MSP with respect to the median plane
that we previously used in our PA analyses. A statistical analysis was performed in order to test the accuracy of the CBCT values relative to those measured using 2D standard PA cephalograms.
Materials and Methods
Among all patients for whom orthodontic surgery was planned in our unit, 15 were randomly selected for this study.
The included patients had previously received a PA ceph- alogram at the first consultation, and pre-surgical CBCT was requested at the beginning of the therapy to plan the orthodontic-surgical treatment; furthermore, the CBCT scans of the chosen patients had been performed with the same machine(NewTom VGI, QR srl, Verona, Italy), which created 376 slices with a 0.3mm×0.3mm×0.5mm voxel resolution(field of view, 21cm×19cm; tube volt- age, 110kV; current, 6.30mA for each second of the scan;
total scanning time, 5.4s). The group of patients consisted of 6 men and 9 women, who were numbered from 1 to 15 (Table 1). Seven patients suffered from symmetrical mal- occlusion and 8 from facial asymmetry(of whom 2 patients were affected with Hemifacial Microsomia and 6 with Condylar Hyperplasia). This study was approved by the Department of Oral and Maxillofacial Sciences and by the Ethical Committee of the Umberto I General Hospital of the Sapienza University of Rome(protocol No. 4663).
To test the clinical accuracy of the anatomical MSP with respect to the plane used for reference in 2D cephalometry, the inter-zygomatic distance between the Zr and Zl points on CBCT was measured and compared with the measure-
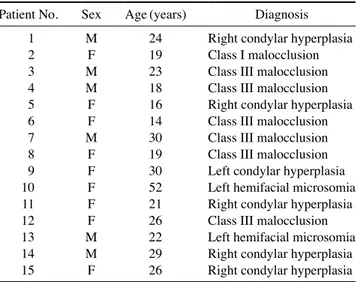
Table 1. Clinical characteristics of the patients involved in the study Patient No. Sex Age(years) Diagnosis
1 M 24 Right condylar hyperplasia
2 F 19 Class I malocclusion
3 M 23 Class III malocclusion
4 M 18 Class III malocclusion
5 F 16 Right condylar hyperplasia
6 F 14 Class III malocclusion
7 M 30 Class III malocclusion
8 F 19 Class III malocclusion
9 F 30 Left condylar hyperplasia
10 F 52 Left hemifacial microsomia
11 F 21 Right condylar hyperplasia
12 F 26 Class III malocclusion
13 M 22 Left hemifacial microsomia
14 M 29 Right condylar hyperplasia
15 F 26 Right condylar hyperplasia
No.: number
ments made on the standard PA cephalograms of the same patient. The method described below was used to compare the measurements.
CBCT measurements
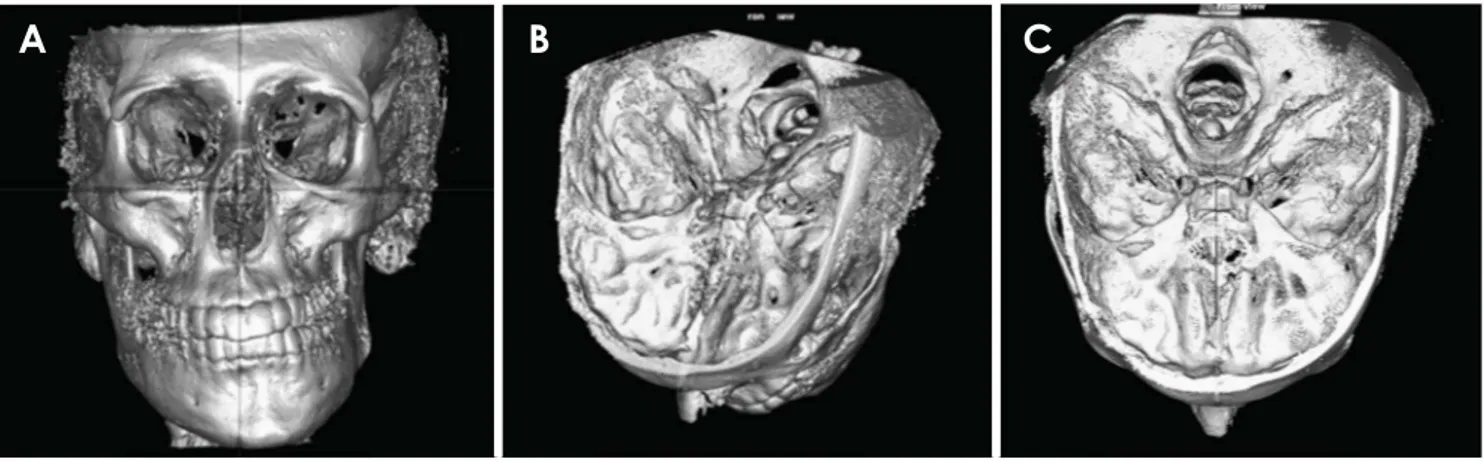
The CBCT slices were imported in the Digital Imaging and Communications in Medicine(DICOM) format using Dolphin software version 11.95 beta(Dolphin Imaging and Management Systems, Chatsworth, CA, USA) for 3D re- construction. For each patient, 2 operators were requested to localise 3 anatomical landmarks on the 3D-reconstruct- ed image to identify the reference MSP, after familiarising themselves with the software for a brief period of time. The authors gave the operators the exact 3D definition of these landmarks to avoid errors during the landmarks’ identifica- tion:1,2 the nasion was defined as the most anterior point of the fronto-nasal suture on the sagittal plane, and more cen- tral and superior on the frontal plane(Fig. 1A); the PCM was defined as the midpoint between the posterior clinoid processes(Fig. 1B); and the basion was defined as the most
anterior, low, and central point of the foramen magnum, also called the mid-dorsal point of the anterior margin of the foramen magnum in the literature(Fig. 1C).21 The oper- ators had different levels of experience with 2D cephalom- etry(operator 1, post-graduate in orthodontics, 10years of experience; operator 2, DDS, 5years of experience), but no experience with 3D cephalometry.
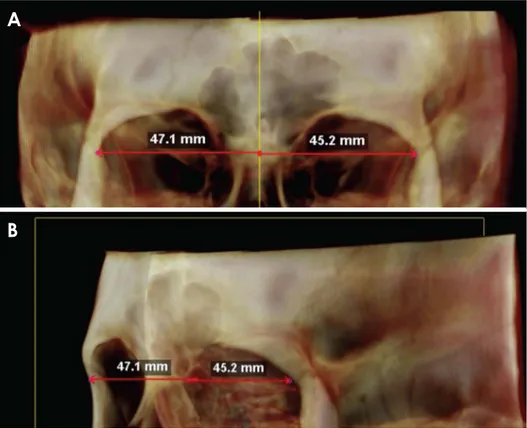
After the landmarks were localised, the software traced the MSP and re-oriented the skull on the CBCT(Fig. 2).
The operators were then asked to locate the right and left zygomatic points(Zr and Zl, respectively, corresponding to the medial and inferior-most points on the frontal plane and the anterior-most points on the sagittal plane of the right and left fronto-zygomatic sutures). At this time, 1 of the authors(H.A.) measured the orthogonal distance between each point and the MSP using the software function “Dist.
to midline”(Fig. 3). Therefore, each operator provided, for all 15 patients involved in the study, two 2D measurements on CBCT(the orthogonal distances Zr-MSP and Zl-MSP), for a total of 30 measurements.
A B
Fig. 2. The anatomical mid-sagittalplane traced by the software on a patient’s cone-beam computed to- mography 3-dimensional reconstruc- tion. A. Axial orientation. B. Sagittal orientation.
A B C
Fig. 1. Landmarks selected for tracing the mid-sagittal plane on cone-beam computed tomographic(CBCT) images. A. Localisation of the na- sion. B. Localisation of the midpoint between the posterior clinoid processes. C. Localisation of the basion.
In order to ensure a proper comparison of the inter-zygo- matic distances measured on CBCT to those measured on PA cephalograms, the “3D distance” function was not used, as 3D measurements could be affected by the sagittal posi- tion of the 2 landmarks(e.g., in patient No. 6, the right zy- gomatic suture was more anterior in the sagittal plane than the left zygomatic suture). The inter-zygomatic distance on CBCT was thus calculated as the sum of the projections of Zr and Zl to the MSP(CBCT Zr-Zl=Zr-MSP+Zl-MSP).
PA cephalogram measurements
As the routine procedure applied in our unit to perform PA cephalometry is based on the vertical plane passing through the midpoint of the inter-zygomatic distance, this value was considered to be the “anatomical truth”11 for this study. Hence, the same 2 operators were requested to perform a simplified cephalometric tracing on PA cephalo- grams of every patient involved in the study, to localise the Zr and Zl landmarks, and to trace the median plane. Then, 1 of the authors(K.G.) measured the inter-zygomatic dis- tance, taking into account whether the printed X-ray had a (2D Zr-Zl). Therefore, each operator measured the inter-zy- gomatic distance for every patient included in the study.
Data analysis
The inter-zygomatic distances measured on CBCT scans
were compared to those measured on PA cephalograms.
The right-side CBCT measurements(Zr-MSP) and the left- side measurements(Zl-MSP) were compared to a value equal to half of the inter-zygomatic distance measured on the PA cephalograms.
The accuracy of the CBCT measurements of the in- ter-zygomatic distance compared to the PA cephalogram measurements was evaluated using the “error calculation”
definition, which was the absolute difference in millimetres between the CBCT measurements and the PA cephalogram measurements(i.e., the reference value).
By calculating the percentage error, we were able to per- form a pure evaluation of the difference between measures with respect to the reference value without using units of measurement. The percentage error was calculated as:
(CBCT measurement -2D measurement)/2D measure- ment×100.
The data were analysed using the R statistical analysis software(version 3.3.1; https://www.r-project.org/). The pur- pose of the statistical analysis was to determine the signifi- cance of any observed differences between the CBCT val- ues and the measures obtained from the PA cephalograms.
A descriptive statistical analysis was performed to test the accuracy and precision of the MSP identified on CBCT rela- tive to the previously used method(PA cephalograms). For each operator, the minimum and maximum values, first and
Fig. 3. Different views of the “Dist.
to midline” function used to mea- sure the distance from the right and left zygomatic suture to the mid-sagittal plane on cone-beam computed tomography. Note how the orientation of the skull in the 3-dimensional environment could lead to errors in the location of land- marks. Changes in the orientation help to locate the landmarks in the correct 3-dimensional position. A.
Frontal orientation. B. Oblique ori- entation.
A
B
third quartile, mean, median, and standard deviation were reported, both for the total values and for the measurements on the right and left sides.
results
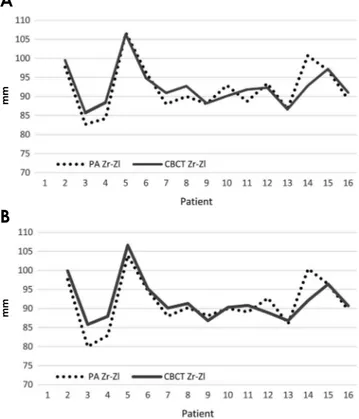
Figures 4A and B compare, for each operator, the values of the CBCT measurements of the inter-zygomatic distance to the values measured on the PA cephalograms. Operator 1 made 13 CBCT measurements that were greater than the corresponding PA cephalogram measurements, while oper- ator 2 made 9 CBCT measurements greater than the corre- sponding PA cephalogram measurements.
Figure 5 presents a comparison between the CBCT mea- surements of both Zr and Zl to the MSP and those taken on PA cephalograms, calculated as the half of the inter-zygo- matic distance. In total, 62 of the 90 CBCT measurements were greater than the corresponding PA cephalogram mea- surements, meaning that the CBCT measurements general- ly reflected overestimations respect to the PA values. Op-
erator 1 made 12 right-side and 9 left-side CBCT measure- ments that were greater than the corresponding PA cepha- logram measurements, while operator 2 made 12 right-side and 7 left-side CBCT measurements that were greater than the corresponding PA cephalogram measurements. Both operators made CBCT measurements that were smaller than the corresponding PA cephalogram measurements for patients No. 8(left-side measurement), 9(left-side mea- surement), 11(total and left-side measurements), and 13(all 3 measurements).
The calculated error reflecting the absolute differences between the CBCT and PA cephalogram measurements, expressed in millimetres, is shown in Figure 6. The box- plot of data for each operator is shown in Figure 7. Most values were above 0, with a median of about 1mm. In the left-side measurements, the median was very close to 0, suggesting congruence between the CBCT and PA cepha-
A
B
Fig. 5. Raw data of right-side and left-side cone-beam comput- ed tomography(CBCT) measurements compared with half of the inter-zygomatic distance measured on PA cephalograms.
2D.mid=distance between the 2D mid-plane and the Zr/Zl land- marks on posterior-anterior cephalograms, given by the formula 2D Zr-Zl/2; Zr-MSP=CBCT Zr-mid-sagittal plane(MSP) distance;
Zl-MSP=CBCT Zl-MSP. A. Operator 1. B. Operator 2.
A
B
Fig. 4. Comparison of the inter-zygomatic distance measured on cone-beam computed tomography(CBCT) to values measured on PA cephalograms, stratified by operator. PA Zr-Zl: inter-zygomatic distance measured on posterior-anterior cephalograms, CBCT Zr-Zl:
inter-zygomatic distance on CBCT, measured according the formu- la: Zr-MSP distance+Zl-MSP distance(see text). A. Operator 1. B.
Operator 2.
mmmm
logram measurements. The right-side CBCT measurements were slightly overestimated compared to the PA cephalo- gram measurements.
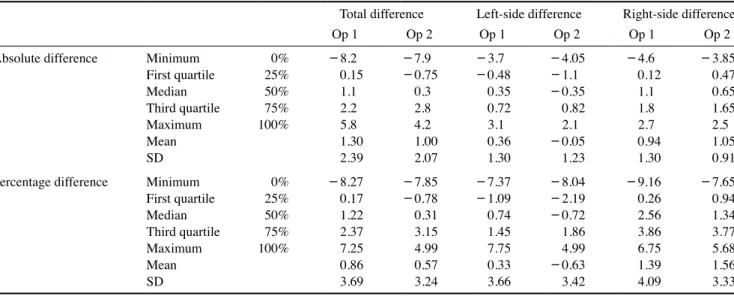
The standard deviation, however, indicated strong vari- ability for the 3 comparisons(Table 2). Information con-
cerning the extreme values and quartiles was added for sta- tistical purposes, because an anomalous value(patient No.
13; Fig. 8) affected the average and standard deviation.
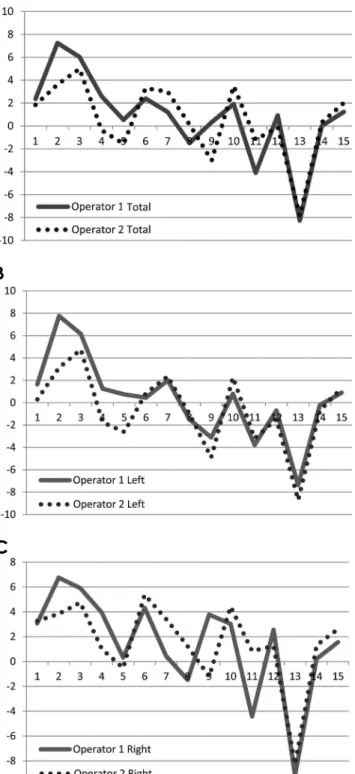
The percentage error of the differences for each patient is shown in Figure 9: the average and, most importantly, the standard deviation indicated that a difference large enough to call into question the accuracy of the measurement was only found in a small percentage of subjects, as only 3 sub- jects showed a percentage difference higher than 5%(pa- tients No. 2, 3, 11, 13).
discussion
After a patient’s slices have been imported into cepha- lometric software in DICOM format, the software orients the 3D reconstruction of the skull into a system of cartesian axes and 3D coordinates. The patient’s orientation is the first aspect to be considered in 2D cephalometry, since an improper position of the head during the X-ray imaging process itself could generate well-known distortion phe- nomena. CBCT image processing eliminates the factors causing distortion in conventional radiographs, since it is possible to digitally change the orientation of the patient’s head.1 Hassan et al.13 and Berco et al.14 reported that these changes did not affect the accuracy or reliability of mea- surements performed on 3D-reconstructed CBCT images, specifically due to the absence of image distortion and the 1:1 ratio. The starting point we chose for orienting the skull in the 3D coordinate system and for 3D cephalometry is an anatomical MSP, which can be thought of as an upgrade of the commonly used reference plane in our standard 2D
Table 2. Descriptive statistics of the data stratified by the operator and measurement
Total difference Left-side difference Right-side difference
Op 1 Op 2 Op 1 Op 2 Op 1 Op 2
Absolute difference Minimum 0% -8.2 -7.9 -3.7 -4.05 -4.6 -3.85
First quartile 25% 0.15 -0.75 -0.48 -1.1 0.12 0.47
Median 50% 1.1 0.3 0.35 -0.35 1.1 0.65
Third quartile 75% 2.2 2.8 0.72 0.82 1.8 1.65
Maximum 100% 5.8 4.2 3.1 2.1 2.7 2.5
Mean 1.30 1.00 0.36 -0.05 0.94 1.05
SD 2.39 2.07 1.30 1.23 1.30 0.91
Percentage difference Minimum 0% -8.27 -7.85 -7.37 -8.04 -9.16 -7.65
First quartile 25% 0.17 -0.78 -1.09 -2.19 0.26 0.94
Median 50% 1.22 0.31 0.74 -0.72 2.56 1.34
Third quartile 75% 2.37 3.15 1.45 1.86 3.86 3.77
Maximum 100% 7.25 4.99 7.75 4.99 6.75 5.68
Mean 0.86 0.57 0.33 -0.63 1.39 1.56
SD 3.69 3.24 3.66 3.42 4.09 3.33
Op: operator
Fig. 6. Differences between measurements in millimetres, strati- fied by operator. A. Operator 1. B. Operator 2.
A
B
Difference (mm)Difference (mm)
PA cephalometry. This plane passes through 3 points on the cranial base and defines a vertical median line that sep- arates the skull into right and left anatomical parts; there- fore, it can be used to evaluate the degree of symmetry in a patient. The MSP proposed herein was derived from Bjork’s classical landmarks: the nasion, the PCM, and the basion.
The landmarks of the MSP should be ideally located on the cranial base, on unpaired anatomical structures, and as centred as possible on the median axis of the skull.
Moreover, for geometric reasons, the landmarks should be placed at a certain distance between each other in order to reduce the possibility of incorrect localisation.3,15 Ideal landmarks should also undergo minimal or no positional changes, either during growth or in case of dento-facial deformities,16 and, in particular, the landmarks of the MSP should not have variations in the transverse plane.
According to Enlow’s classic studies,17 the median part of the cranial base undergoes minimal expansion during
growth with respect to the lateral parts of the endocranium, which grow together with the lobes of the cerebral hemi- spheres. Most cranial base growth occurs in the first 5years of life, with minimal changes after this age. The overall movement of the clivus occurs in the sagittal plane in the anterior-inferior direction, both during the intrinsic growth of the spheno-occipital synchondrosis and during the re- sorption of the endocranic surface of the clivus. The clivus also grows due to bone apposition on the esocranic side at the edge of the foramen magnum. The position of the nasi- on is the result of activity of the naso-frontal suture, and the growth direction of the nasion leads to changes in its verti- cal and sagittal position, but not in its transverse direction.
DeCoster18 stated that the anterior region of the cranial base, from the anterior base of the sella turcica to the inter- nal parts of the frontal bone, does not change after 7years of age. Therefore, the 3 landmarks utilized in this study can be used as reference points, because during growth they undergo modifications only in the sagittal plane(i.e., only in the vertical or anterior-posterior direction), but not in the transverse plane.
The use of an anatomical MSP is limited in patients who present with distortions of the skull base, such as patients with plagiocephaly: according to Farkas,19 the identifica- tion of an MSP in patients with severe craniofacial asym-
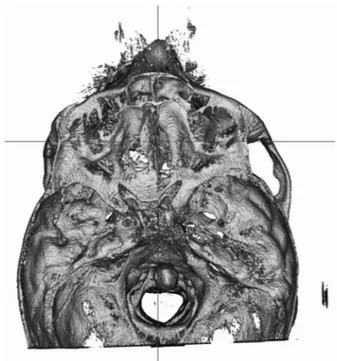
Fig. 8. Three-dimensional axial orientation of patient No. 13 show- ing how, given the distortion of his skull base, the mid-sagittal plane was not suitable for dividing the skull into 2 perfectly symmetric anatomical halves: measurements of this patient were considered to be outliers in the statistical analysis.
Total difference Left difference Right difference
Operator Operator Operator
1 2 1 2 1 2
6
4
2
0
- 2
- 4
- 6
- 8
6
4
2
0
- 2
- 4
- 6
- 8
6
4
2
0
- 2
- 4
- 6
- 8
Fig. 7. Box-plots of the absolute differences show the distributions of the 3 sets of measurements assessed in this study stratified by the operator. Extreme values were measured in patient No. 13, who was considered to be an outlier and represented by dots. Most of the differences between measurements are above 0 for the total inter-zygomatic measurements and the right-side measurements, with the lower and the higher side of the box representing the first and the third quartiles of the distribution. The thick black line represents the median value, which is close to 0, indicating that the left-side measurements were more accurate than the right-side measurements.
metries often becomes a subjective and difficult process.
Kwon et al.20 noted that cranial base morphology did not differ between symmetric and asymmetric patients, and
concluded that the structures of the cranial base are not the dominant factor influencing the degree of facial asymme- try; therefore, the cranial base can be used as a reference in patients with mild to moderate craniofacial asymmetries.
Several planes have been also proposed in the litera- ture,12,21,22 with some of them passing through 3 median points, and others through 2 median structures perpendic- ular to a horizontal plane. The plane passing through the sella-nasion(SN) line perpendicular to the Frankfurt plane was found to be the most accurate by Damstra et al.,12 but due to the high standard deviation of the measurements, it cannot be used as a reference in patients with congenital malformations of the skull. The classical references of 2D cephalometry are not useful in 3D cephalometry: the SN line passes only through 2 points, and the Frankfurt plane cannot be traced on 4 points, as it is defined by the porion and the bilateral orbitales. Furthermore, cranial landmarks are far from the base of the skull and can be subjected to important positional alterations in patients with pathologies such as hemifacial microsomia.12,20,22
In our study, the mean difference between the CBCT and PA cephalogram measurements was approximately 1mm for every measure analysed, but consistently with the liter- ature, the high standard deviation caused the differences to be statistically significant. The mean difference of approx- imately 2mm in the total CBCT measurements compared to the PA values was obviously affected by the sum of the left-side and right-side measurements. The mean values, as an index of accuracy, indicated that the CBCT measure- ments were overestimations compared to the PA cephalo- gram measurements, especially on the right side. The low mean and standard deviation of the left-side measurements, along with their greater proximity to the reference values, confirm Schlicher’s observation that left-side measure- ments showed greater accuracy and precision than right- side measurements.21
While the total difference is useful for calculating sta- tistical significance, the percentage difference represents clinical significance; most of the measurements showed a difference of less than 2%, meaning that in this preliminary study, the MSP showed sufficient accuracy for clinical pur- poses. Among the 4 patients with the highest percentage differences, 2 suffered from symmetric malocclusion and 2 were asymmetric. In accordance with Kwon et al.,20 the transverse characteristics of the malocclusion did not in- fluence our statistical findings, since no differences were found between symmetric and asymmetric malocclusions.
Patient No. 13, who was considered to be an outlier for sta- tistical purposes, was clinically affected by Hemifacial Mi-
A
B
C
Fig. 9. Percentage difference between cone-beam computed to- mography measurements and the posterior-anterior cephalogram measurements, stratified by operator(see text for the formula). A.
Inter-zygomatic distance. B. Left-side measurements. C. Right- side measurements.
crosomia and by a deformation of the cranial base; hence, for such cases, the MSP cannot be considered clinically reliable(Fig. 5).
Inaccuracies in the identification of anatomical land- marks might lead to errors that could affect reliability and reproducibility, and the likelihood of such inaccuracies may depend on the operator’s familiarity with the 3D envi- ronment, the accuracy of the imaging system(CBCT scan parameters), and the software available for cephalometric analysis.12,21-23
In this study, the operators were both unfamiliar with the 3D environment and had different degrees of clinical experience with traditional cephalometric analyses. This variable seems not to have influenced the identification of landmarks and measurements, as also highlighted by de Oliveira et al.23 Regarding cephalometric software, the 3D landmarks must be as easy as possible to locate on images with the lowest available voxel resolution; although a bet- ter resolution could be achieved by increasing the patient’s exposure to radiation, a voxel resolution of 0.4mm seems to be adequate to make cranio-facial measurements.16,24 With the currently available technologies, some landmarks are difficult to locate on 3D images(e.g., the gonion and condylion), as the low resolution of the voxels could create noise during the rendering of the bony structures or imper- fections in the rendering of curved surfaces.4,21,22,24
Since 3D landmarks are identified by 3, not 2, coordi- nates, an incorrect orientation or visualization of the skull can affect the accuracy of localization. Orthodontists and maxillo-facial surgeons interested in exploring 3D cepha- lometry must become familiar with the relevant software and with the 3D environment in order to ensure correct vi- sualisation of the skull, especially during the identification of landmarks. In our study, with the software at our dispos- al, the operators often needed to change the orientation of the skull in order to locate the landmarks in the correct 3D position. Studies on landmark reliability have often used metal markers to reduce error,15,25,26 but we did not use markers because the aim of this study was to reproduce the normal clinical conditions that an orthodontist is accus- tomed to, rather than to investigate precision.
Several studies have shown that radiographic measure- ments performed on 3D CBCT reconstructions are very close to real measurements made on dry skulls,7-9,15 but not completely accurate.27 Van Vlijmen et al.10 and Cassetta et al.28 did not find significant differences between the mea- surements performed on conventional 2D radiographs and those performed on 3D models, but the measurement error of 3D cephalometry is greater than that of 2D cephalome-
try because the addition of the third dimension is an addi- tional source of inaccuracy. The meta-analysis conducted by Trpkova et al.29 concluded that the level of acceptable error in 2D cephalometry is 0.59mm on the X-axis and 0.56 mm on the Y-axis.
Some studies have suggested locating landmarks on a se- g mented surface or in a multiplanar slice sequence instead of using a 3D-rendered environment as a way of making protocols simpler and more accurate.2,4,19,22,26,30 Among the studies conducted with the software that we used, Schli- cher et al.21 evaluated the accuracy of landmarks using the 4 viewing modes available in Dolphin(i.e., 3D reconstruc- tion and orthogonal projections on the X-, Y-, and Z-axes).
Periago et al.15, like us, analysed the accuracy of linear measurements directly on 3D-rendered volumes without using fiducial markers and established that most of the lin- ear 3D measurements were statistically significantly differ- ent from the anatomical measurements(60% of the mea- surements showed a difference of over 1mm, while 10%
showed a difference of over 2mm) in craniofacial analyses.
According to the literature, the landmarks so far exam- ined(the nasion, basion, Zr, and Zl) can be detected with high reliability and a low standard deviation in all 3 dimen- sions.2,21 Schlicher et al.21 stated that the sella(originally proposed by Bjork for 2D lateral cephalometry) had the best consistency as a landmark, while Zamora et al.2 traced an MSP between the nasion, sella, and basion points, using the sella instead of the PCM. We initially used the sella as a reference point, but found that it was the most difficult landmark for operators to localise in the 3D environment, as was also reported by Muramatsu et al.31 The PCM, on the other hand, was simpler to localise than the sella, prob- ably because it is easier to localise landmarks on convex surfaces than on concave surfaces.
This preliminary study showed that an MSP, based on anatomical landmarks that are easy to locate and trace on the skull, can be used as a reference plane for 3D cepha- lometry. The average differences and the high standard de- viation of our sample indicate that this procedure has good clinical accuracy but low precision, suggesting that further research is needed to improve the clinical usefulness of the available software. As stated in the literature, and sup- ported by our study, the MSP can be useful for assessing the symmetry of the skull, even in patients with skeletal mandibular asymmetry, but without skull base distortions.
Projections on the MSP enable the evaluation of differenc- es between the right and left anatomical structures on the transverse plane, without considering positional variations of the landmarks in the sagittal plane. The effects of sagit-
tal variations in the landmarks have not been analysed, but could be a promising topic for further studies.
Further analyses are required with a greater number of patients, who should be stratified by skull symmetry as symmetric or asymmetric, in order to improve the statisti- cal significance of the results.
Acknowledgements
The authors would like to thank Dr. Biagia Elisabetta Perrucci and Mr. Gabriele Monachesi for their help in im- proving the text.
references
1. Mah JK, Huang JC, Choo H. Practical applications of cone- beam computed tomography in orthodontics. J Am Dent Assoc 2010; 141 Suppl 3: 7S-13S.
2. Zamora N, Llamas JM, Cibrián R, Gandia JL, Paredes V. A study on the reproducibility of cephalometric landmarks when undertaking a three-dimensional(3D) cephalometric analysis.
Med Oral Patol Oral Cir Bucal 2012; 17: e678-88.
3. Langlade M. Céphalométrie orthodontique. Paris: Maloine;
1978.
4. Grauer D, Cevidanes LS, Proffit WR. Working with DICOM craniofacial images. Am J Orthod Dentofacial Orthop 2009;
136: 460-70.
5. Olszewski R, Tanesy O, Cosnard G, Zech F, Reychler H. Re- producibility of osseous landmarks used for computed tomogra- phy based three-dimensional cephalometric analyses. J Cranio- maxillofac Surg 2010; 38: 214-21.
6. Nur RB, Çakan DG, Arun T. Evaluation of facial hard and soft tissue asymmetry using cone-beam computed tomography. Am J Orthod Dentofacial Orthop 2016; 149: 225-37.
7. Rossini G, Cavallini C, Cassetta M, Barbato E. 3D cephalomet- ric analysis obtained from computed tomography. Review of the literature. Ann Stomatol(Roma) 2011; 2: 31-9.
8. Olszewski R, Zech F, Cosnard G, Nicolas V, Macq B, Reychler H. Three-dimensional computed tomography cephalometric craniofacial analysis: experimental validation in vitro. Int J Oral Maxillofac Surg 2007; 36: 828-33.
9. Moreira CR, Sales MA, Lopes PM, Cavalcanti MG. Assess- ment of linear and angular measurements on three-dimensional cone-beam computed tomographic images. Oral Surg Oral Med Oral Pathol Oral Radiol Endod 2009; 108: 430-6.
10. van Vlijmen OJ, Maal T, Bergé SJ, Bronkhorst EM, Katsaros C, Kuijpers-Jagtman AM. A comparison between 2D and 3D cephalometry on CBCT scans of human skulls. Int J Oral Max- illofac Surg 2010; 39: 156-60.
11. Cascone P, De Ponte F, Schaerf M. Cephalometric analysis in maxillofacial surgery. A proposed computerized analysis in an- tero-postero projection for study of maxillofacial abnormalities.
Mondo Ortod 1987; 12: 97-106.
12. Damstra J, Fourie Z, De Wit M, Ren Y. A three-dimensional comparison of a morphometric and conventional cephalometric
midsagittal planes for craniofacial asymmetry. Clin Oral Inves- tig 2012; 16: 285-94.
13. Hassan B, van der Stelt P, Sanderink G. Accuracy of three-di- mensional measurements obtained from cone beam computed tomography surface-rendered images for cephalometric analy- sis: influence of patient scanning position. Eur J Orthod 2009;
31: 129-34.
14. Berco M, Rigali PH Jr, Miner RM, DeLuca S, Anderson NK, Will LA. Accuracy and reliability of linear cephalometric mea- surements from cone-beam computed tomography scans of a dry human skull. Am J Orthod Dentofacial Orthop 2009; 136:
17.e1-9.
15. Periago DR, Scarfe WC, Moshiri M, Scheetz JP, Silveira AM, Farman AG. Linear accuracy and reliability of cone beam CT derived 3-dimensional images constructed using an orthodontic volumetric rendering program. Angle Orthod 2008; 78: 387-95.
16. Moro A, Correra P, Boniello R, Gasparini G, Pelo S. Three-di- mensional analysis in facial asymmetry: comparison with model analysis and conventional two-dimensional analysis. J Craniofac Surg 2009; 20: 417-22.
17. Enlow DH, Hans MG. Essentials of facial growth. Philadelphia:
WS Saunders Co.; 1996.
18. De Coster L. A new line of reference for the study of lateral fa- cial teleradiographs. Am J Orthod 1953; 39: 304-6.
19. Farkas LG. Anthropometry of the head and face. 2nd ed. New York: Raven Press; 1994.
20. Kwon TG, Park HS, Ryoo HM, Lee SH. A comparison of cra- niofacial morphology in patients with and without facial asym- metry - a three-dimensional analysis with computed tomogra- phy. Int J Oral Maxillofac Surg 2006; 35: 43-8.
21. Schlicher W, Nielsen I, Huang JC, Maki K, Hatcher DC, Miller AJ. Consistency and precision of landmark identification in three-dimensional cone beam computed tomography scans. Eur J Orthod 2012; 34: 263-75.
22. Lagravère MO, Low C, Flores-Mir C, Chung R, Carey JP, Heo G, et al. Intraexaminer and interexaminer reliabilities of landmark identification on digitized lateral cephalograms and formatted 3-dimensional cone-beam computerized tomography images. Am J Orthod Dentofacial Orthop 2010; 137: 598-604.
23. de Oliveira AE, Cevidanes LH, Phillips C, Motta A, Burke B, Tyndall D. Observer reliability of three-dimensional cephalo- metric landmark identification on cone-beam computerized to- mography. Oral Surg Oral Med Oral Pathol Oral Radiol Endod 2009; 107: 256-65.
24. Eliades T. Research methods in orthodontics: a guide to under- standing orthodontic research. Heidelberg: Springer; 2013.
25. Gribel BF, Gribel MN, Frazão DC, McNamara JA Jr, Manzi FR. Accuracy and reliability of craniometric measurements on lateral cephalometry and 3D measurements on CBCT scans.
Angle Orthod 2011; 81: 26-35.
26. Neiva MB, Soares ÁC, Lisboa Cde O, Vilella Ode V, Motta AT.
Evaluation of cephalometric landmark identification on CBCT multiplanar and 3D reconstructions. Angle Orthod 2015; 85:
11-7.
27. Fernandes TM, Adamczyk J, Poleti ML, Henriques JF, Fried- land B, Garib DG. Comparison between 3D volumetric ren- dering and multiplanar slices on the reliability of linear mea- surements on CBCT images: an in vitro study. J Appl Oral Sci
2015; 23: 56-63.
28. Cassetta M, Altieri F, Di Giorgio R, Silvestri A. Two-dimension- al and three-dimensional cephalometry using cone beam com- puted tomography scans. J Craniofac Surg 2015; 26: e311-5.
29. Trpkova B, Major P, Prasad N, Nebbe B. Cephalometric land- marks identification and reproducibility: a meta analysis. Am J Orthod Dentofacial Orthop 1997; 112: 165-70.
30. Lee ST, Choi NR, Song JM, Shin SH. Three-dimensional mor-
phometric analysis of mandibule in coronal plane after bimax- illary rotational surgery. Maxillofac Plast Reconstr Surg 2016;
38: 49.
31. Muramatsu A, Nawa H, Kimura M, Yoshida K, Maeda M, Katsumata A, et al. Reproducibility of maxillofacial anatomic landmarks on 3-dimensional computed tomographic images determined with the 95% confidence ellipse method. Angle Or- thod 2008; 78: 396-402.