Introduction
Joint effusion in the temporomandibular joint (TMJ) space typically appears as a high signal intensity on T2- weighted magnetic resonance imaging (MRI). Joint effusion has been suggested to indicate intra-articular inflammation in patients with internal derangement1,2and osteoarthritis.3 Further, joint effusion has been commonly considered to be a sign of synovitis in internal derangement.1,2 On the other hand, TMJ osteoarthrosis refers to a non-inflamma-
tory joint disease that is characterized by the deterioration of articular surfaces and a simultaneous remodeling of the underlying bone.4Therefore, the synovial fluid of a normal joint is not observed on T2-weighted MRI.
The etiology of pain in TMD patients has not been clear- ly understood. There are several possible sources of TMJ pain, such as inflammatory changes in the synovial mem- brane including fluid resulting in joint effusion,5-9 alter- ations in the bone marrow of the mandibular condyle,10 and impingement and compression.11
Emshoff et al7have shown a positive relationship between joint effusion and joint pain. Further, there have been sev- eral studies11-13that have reported that only certain types of TMJ pain are related to joint effusion, such as sponta- neous pain and provoked pain.13Takahashi et al13revealed
Received July 7, 2014; Revised September 11, 2014; Accepted September 17, 2014
*Correspondence to : Prof. Kwang-Joon Koh
Department of Oral and Maxillofacial Radiology, School of Dentistry, 20 Geonjiro, Deokjin-gu, Jeonju-si, Jeollabuk-do 561-712, Korea
Tel) 82-63-250-2023, Fax) 82-63-250-2081, E-mail) [email protected]
Copyright ⓒ 2014 by Korean Academy of Oral and Maxillofacial Radiology
This is an Open Access article distributed under the terms of the Creative Commons Attribution Non-Commercial License (http://creativecommons.org/licenses/by-nc/3.0) which permits unrestricted non-commercial use, distribution, and reproduction in any medium, provided the original work is properly cited.
Imaging Science in Dentistry∙pISSN 2233-7822 eISSN 2233-7830
Relationship between pain and effusion on magnetic resonance imaging in temporomandibular disorder patients
Ha-Na Park1, Kyoung-A Kim1, Kwang-Joon Koh1,*
1Department of Oral and Maxillofacial Radiology, School of Dentistry and Institute of Oral Bioscience, Chonbuk National University, Jeonju, Korea
ABSTRACT
Purpose: This study was performed to find the relationship between pain and joint effusion using magnetic resonance imaging (MRI) in temporomandibular disorder (TMD) patients.
Materials and Methods: The study subjects included 232 TMD patients. The inclusion criteria in this study were the presence of spontaneous pain or provoked pain on one or both temporomandibular joints (TMJs). The provoked pain was divided into three groups: pain on palpation (G1), pain on mouth opening (G2), and pain on mastication (G3).
MRI examinations were performed using a 1.5-T MRI scanner. T1- and T2-weighted images with para-sagittal and para-coronal images were obtained. According to the T2-weighted image findings, the cases of effusions were divided into four groups: normal, mild (E1), moderate (E2), and marked effusion (E3). A statistical analysis was carried out using the χ2test with SPSS (version 12.0, SPSS Inc., Chicago, IL, USA).
Results: Spontaneous pain, provoked pain, and both spontaneous and provoked pain were significantly related to joint effusion in TMD patients (p⁄0.05). However, among the various types of provoked pain, pain on palpation of the masticatory muscles and TMJ (G1) was not related to joint effusion in TMD patients (p¤0.05).
Conclusion: Spontaneous pain was related to the MRI findings of joint effusion; however, among the various types of provoked pain, pain on palpation of the masticatory muscles and TMJ was not related to the MRI findings of joint effusion. These results suggest that joint effusion has a significant influence on the prediction of TMJ pain. (Imaging Sci Dent 2014; 44: 293-9)
KEY WORDS: Pain; Effusion; Temporomandibular Joint; Magnetic Resonance Imaging
that joint effusion was found in 80% of painful joints and in 39% of pain-free joints during palpation or mouth open- ing. According to Murakami et al,12MRI detection of high signal intensity in the case of closed locking did not direct- ly correlate with the presence of TMJ pain, but only chew- ing pain, and joint effusion showed a positive correlation in patients with a TMJ closed lock. However, Ohlmann et al14revealed that MRI-depicted anatomic changes such as internal derangement and osteoarthrosis were not signifi- cantly correlated with the presence of TMJ pain. Further, Adame et al15reported that it was not possible to find a relationship between pain and effusion.
While there is general agreement that joint effusion might reflect the pathologic collection of fluid in the joint space, the relationship between the MRI evidence of joint effusion and the occurrence of pain remains unclear.
Elimination of joint pain is the main goal of TMJ treat- ment in TMD patients. If the correlation between joint effusion and TMJ pain were proved, many TMD patients could be relieved from TMJ pain through an appropriate change of treatment plan.
The aim of this study was to find the relationship between the MRI evidence of joint effusion and TMJ pain.
Materials and Methods
The study subjects included 232 TMD patients (464 TMJs) who visited Chonbuk National University Dental Hospital with TMJ pain from 2008 to 2013. Their dental records were investigated, and MRI examinations were performed after receiving patient consent.
The inclusion criteria in this study were the presence of spontaneous pain or provoked pain on one or both TMJs.
Spontaneous pain was considered to be painful when the patient referred to a history of pain. The provoked pain was classified into three groups: pain on palpation (G1), pain on mouth opening (G2), and pain on mastication (G3). The severity of pain was assessed by using a visual analog scale (VAS, 0-10).
MRI examinations were performed using a 1.5-T MRI scanner (Symphony, Siemens, Olangan, Germany) with a 7.5-cm surface coil. A section thickness of 3 mm, field of view (FOV) of 140 mm×140 mm, and spin echo (SE) mul- tisection images were used for the T1-weighted images (T1WIs: repetition time (TR) in milliseconds/echo time (TE) in milliseconds==510-520/11-15) and T2-weighted images (T2WIs: TR/TE==2410-2740/40-107). Eighteen para-coronal and 11 para-sagittal images were obtained.
All TMJs were evaluated to detect the presence of joint effusion on the MRIs.
According to the MRI findings on T2WIs, the degrees of effusion were classified into four subgroups: normal, mild effusion (E1), moderate effusion (E2), and marked effusion (E3). The specifications for the classification of TMJ effu- sion were as follows: 1) Mild effusion: a dot or line denot- ing high signal intensity along the articular surface as described by Westesson and Brooks16(Fig. 1A); 2) Moder- ate effusion: between mild and marked signal intensity (Fig. 1B); 3) Marked effusion: collection with pooling in the joint space (Fig. 1C).
Evaluations of MRI were performed at different points in time by two experienced oral and maxillofacial radiolo- gists. When there was disagreement, the final assessment was reached by consensus.
A statistical analysis was carried out using the χ2 test with SPSS version 12.0 (SPSS Inc., Chicago, IL, USA).
Fig. 1.T2-weighted magnetic resonance images show the joint effusion in the joint spaces. A. Mild effusion: a dot of high signal intensity in the superior joint space. B. Moderate effusion: between mild and marked effusion. C. Marked effusion: collection with pooling in the superior joint space.
A B C
All p values of ⁄0.05 in the comparison of TMJ pain and effusion were considered statistically significant.
Results
Table 1 shows the age and gender distribution of the study subjects. The subjects consisted of 232 TMD patents (54 males and 178 females). The ratio between the males and the females was 0.3. Most (68.1%) of the 232 TMD pati- ents who had suffered from TMJ pain were in their 20 s or 30 s. The mean age was 25.8 years, with a range of 11 to 74 years.
Table 2 shows the distribution of pain in TMD patients according to the site. Of the 232 right TMJs examined, spontaneous pain was found in 50 (13.0%), G1 in 133 (34.5%), G2 in 116 (30.1%), and G3 in 87 (22.4%) joints.
Of the 232 left TMJs examined, spontaneous pain was found in 46 (12.0%), G1 in 137 (35.9%), G2 in 114 (29.8%), and G3 in 85 (22.3%) joints.
Table 3 shows the distribution of joint effusion according to the site. Of the 232 right TMJs, T2-weighted MR images revealed 59 (25.4%) to be normal, with E1 in 80 (34.5%), E2 in 47 (20.3%), and E3 in 46 (19.8%) joints. Of the 232 left TMJs, T2-weighted MR images revealed 59 (25.4%) to be normal, with E1 in 82 (35.3%), E2 in 59 (25.4%), and E3 in 32 (13.9%) joints.
Table 4 shows the relationship between spontaneous pain and joint effusion in TMJ. Of the 96 painful joints, T2- weighted MR images revealed 13 (13.5%) to be normal, with E1 in 39 (40.6%), E2 in 22 (22.9%), and E3 in 22
(22.9%). On the other hand, of the 368 joints without pain, T2-weighted MR images revealed 105 (28.5%) to be nor- mal, with E1 in 123 (33.4%), E2 in 84 (22.8%), and E3 in 56 (15.2%). Spontaneous pain was statistically significant- ly related to effusion in TMD patients (p==0.014).
Table 5 shows the results of the statistical analysis of the relationship between provoked pain and effusion in TMJ according to the types of provoked pain. Of the 270 painful G1 joints, T2-weighted MR images revealed 54 (20.0%) to be normal, with E1 in 96 (35.6%), E2 in 68 (25.2%), and E3 in 52 (19.2%) joints. On the other hand, of the 194 G1 joints without pain, T2-weighted MR images revealed 64 (33.0%) to be normal, with E1 in 66 (34.0%), E2 in 38 (19.6%), and E3 in 26 (13.4%) joints. Of the 230 painful G2 joints, T2-weighted MR images revealed 30 (13.0%) to be normal, with E1 in 86 (37.4%), E2 in 60 (26.1%), and E3 in 54 (23.5%) joints. As for the 234 G2 joints without pain, T2-weighted MR images revealed 88 (37.6%) to be normal, with E1 in 76 (32.5%), E2 in 46 (19.7%), and E3
Table 2.Distribution of temporomandibular joint (TMJ) pain in temporomandibular disorder (TMD) patients
TMJ Pain Number (%)
Right Left
Spontaneous pain 50 (13.0) 46 (12.0)
Provoked pain G1 133 (34.5) 137 (35.9)
G2 116 (30.1) 114 (29.8)
G3 87 (22.4) 85 (22.3)
Total 386 (100.0) 382 (100.0)
G1: Pain on palpation, G2: Pain on mouth opening, G3: Pain on mastication
Table 1.Age and gender distribution of the study subjects
Age Number
M F %
10s 19 49 29.3
20s 22 68 38.8
30s 7 23 12.9
40s 3 14 7.3
50s- 3 24 11.7
Total 54 178 100.0
Table 3.Distribution of effusion according to the site on magnetic resonance imaging
Effusion Right (%) Left (%)
Normal 59 (25.4) 59 (25.4)
E1 80 (34.5) 82 (35.3)
E2 47 (20.3) 59 (25.4)
E3 46 (19.8) 32 (13.9)
Total 232 (100.0) 232 (100.0)
E1: mild effusion, E2: moderate effusion, E3: marked effusion
Table 4.Results of statistical analysis of the relationship between spontaneous pain and effusion in temporomandibular joint
Spontaneous Pain Effusion
Total (%) χ2 p
Normal (%) E1 (%) E2 (%) E3 (%)
Painful 13 (13.5) 39 (40.6) 22 (22.9) 22 (22.9) 96 (100.0)
10.544 0.014
No pain 105 (28.5) 123 (33.4) 84 (22.8) 56 (15.2) 368 (100.0)
Total 118 (25.4) 162 (34.9) 106 (22.8) 78 (16.9) 464 (100.0)
E1: mild effusion, E2: moderate effusion, E3: marked effusion
in 24 (10.2%) joints. Of the 172 painful G3 joints, T2- weighted MR images revealed 24 (14.0%) to be normal, with E1 in 62 (36.0%), E2 in 46 (26.7%), and E3 in 40 (23.3%) joints. Among the 302 G3 joints without pain, T2- weighted MR images revealed 94 (31.1%) to be normal, with E1 in 100 (33.1%), E2 in 70 (23.2%), and E3 in 38 (12.6%) joints. Provoked pain was significantly related to effusion in G2 (p==0.000) and G3 (p==0.004); however, there was no statistically significant relationship between provoked pain and joint effusion in G1 (p==0.055).
Table 6 shows the results of the statistical analysis of the relationship between provoked pain and effusion in TMJ.
Of the 672 painful joints, T2-weighted MR images revealed 108 (16.1%) to be normal, with E1 in 244 (36.3%), E2 in 174 (25.9%), and E3 in 146 (21.7%) joints. On the other hand, of the 730 joints without pain, T2-weighted MR images revealed 246 (33.7%) to be normal, with E1 in 242 (33.2%), E2 in 154 (21.1%), and E3 in 88 (12.0%) joints.
Provoked pain was statistically significantly related to effusion in TMD patients (p==0.000).
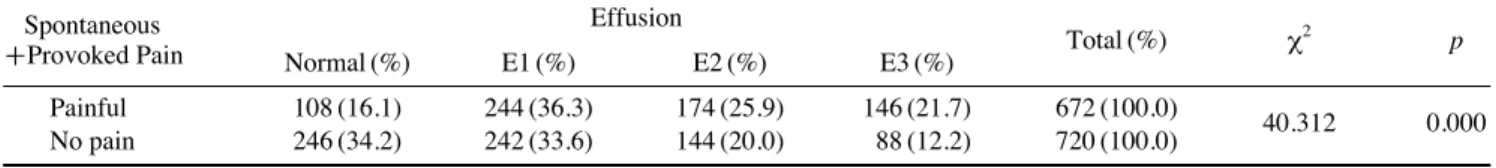
Table 7 shows the results of the statistical analysis of the
relationship between pain (spontaneous and provoked pain) and effusion in TMJ. Of the 672 painful joints, T2-weight- ed MR images revealed 108 (16.1%) to be normal, with E1 in 244 (36.3%), E2 in 174 (25.9%), and E3 in 146 (21.7%) joints. On the other hand, of the 720 joints without pain, T2-weighted MR images revealed 246 (34.2%) to be nor- mal, with E1 in 242 (33.6%), E2 in 144 (20.0%), and E3 in 88 (12.2%) joints. The pain including spontaneous and provoked pain was statistically related to joint effusion in TMD patients (p==0.000).
Discussion
A clinical examination should be supported by imaging to make a TMD diagnosis. MRI is suitable as the modality of choice for the assessment of TMD because it defines the disc position and shape of the TMJ and shows the osseous changes in the TMJ.
On T2-weighted spin-echo (SE) images, joint effusion is detected as an area of high signal intensity in the upper and lower joint spaces. Joint effusion detected on T2-weighted
Table 6.Results of statistical analysis of the relationship between provoked pain and effusion in temporomandibular joint
Provoked Pain Effusion
Total (%) χ2 p
(G1++G2++G3) Normal (%) E1 (%) E2 (%) E3 (%)
Painful 108 (16.1) 244 (36.3) 174 (25.9) 146 (21.7) 672 (100.0)
40.312 0.000
No pain 246 (33.7) 242 (33.2) 154 (21.1) 88 (12.0) 730 (100.0)
G1: pain on palpation, G2: pain on mouth opening, G3: pain on mastication, E1: mild effusion, E2: moderate effusion, E3: marked effusion
Table 5.Results of statistical analysis of the relationship between provoked pain and effusion in temporomandibular joint according to the type of provoked pain
Provoked Pain Effusion
Total (%) χ2 p
Normal (%) E1 (%) E2 (%) E3 (%)
G1 Painful 54 (20.0) 96 (35.6) 68 (25.2) 52 (19.2) 270 (100.0)
8.35 0.055
No pain 64 (33.0) 66 (34.0) 38 (19.6) 26 (13.4) 194 (100.0)
G2 Painful 30 (13.0) 86 (37.4) 60 (26.1) 54 (23.5) 230 (100.0)
22.22 0.000
No pain 88 (37.6) 76 (32.5) 46 (19.7) 24 (10.2) 234 (100.0)
G3 Painful 24 (14.0) 62 (36.0) 46 (26.7) 40 (23.3) 172 (100.0)
14.49 0.004
No pain 94 (31.1) 100 (33.1) 70 (23.2) 38 (12.6) 302 (100.0)
G1: pain on palpation, G2: pain on mouth opening, G3: pain on mastication, E1: mild effusion, E2: moderate effusion, E3: marked effusion
Table 7.Results of statistical analysis of the relationship between pain and effusion in temporomandibular joint
Spontaneous Effusion
Total (%) χ2 p
+
+Provoked Pain Normal (%) E1 (%) E2 (%) E3 (%)
Painful 108 (16.1) 244 (36.3) 174 (25.9) 146 (21.7) 672 (100.0)
40.312 0.000
No pain 246 (34.2) 242 (33.6) 144 (20.0) 88 (12.2) 720 (100.0)
E1: mild effusion, E2: moderate effusion, E3: marked effusion
MR images in the superior compartment of the TMJ is com- monly considered a sign of synovitis in internal derange- ment.1,2 Further, joint effusion is observed more often in joints at more advanced stages of internal derangement, disc displacement without reduction,17and osteoarthritis.3 However, joint effusion can also be observed in asymp- tomatic joints without clinical symptoms.18Several rese- archers have found some or marked joint effusion in 10%
of asymptomatic joints.17,18For this reason, Larheim9de- fined an abnormal amount of joint fluid as more fluid than the amount maximally seen in the asymptomatic controll- ed group, named “moderate fluid.” In other words, only marked fluid was considered abnormal. In this study, mild and moderate effusion as well as marked effusion were included as joint effusion because a small or moderate amount of joint fluid might reflect the intra-articular path- ology of the TMJ.
Suenaga et al17reported that 5 (9%) of 56 asymptomatic joints showed joint effusion, but no contrast enhancement was found in any of these 5 joints. Given these findings, the absence of enhancement may not necessarily indicate inflammatory changes in the TMJ but rather reflect a low rate of fluid washout owing to chronic changes in the syn- ovium. According to Segami et al19synovitis significantly correlated with the degree of joint effusion. The hyperpla- sia and the presence of inflammatory cells were related to the amount of joint effusion. This means that joint effusion might contain not only synovial fluid but also hyperplastic synovial tissue, which has probably formed in response to an inflammatory reaction.
Clinical examination assesses joint pain, joint sounds, mandibular range of motion, and muscle and joint tender- ness. The Research Diagnostic Criteria (RDC)/TMD allows examiners to achieve acceptable levels of inter-observer reliability for investigating muscle pain, disc displacements, and degenerative diseases of the TMJ.20 According to a systematic review of the TMJ,20only a few examiners21-24 complied with the RDC/TMD guidelines.
There are several possible sources of TMJ pain, such as inflammatory changes in the synovial membrane including joint effusion,5-9 inflammatory changes in the retrodiscal tissue,25alterations in the bone marrow of the mandibular condyle,10impingement, and compression.11
Harms et al26reported that high signal intensity around the articular disc on T2-weighted SE images reflected the presence of fluid or inflammation, as in the knee and hip joints. Several researchers5-7,27have studied the prevalence and localization of effusion in the TMJ with various MR sequences.
According to Yano et al,8 a significant difference was observed between TMJ pain and the quantity of joint fluid.
There was also a significant difference between the changes in the quantity of fluid and TMJ pain, and all joints in which fluid was reduced showed improvements in TMJ pain or had no pain. Several authors5-7have also reported a positive relationship between joint effusion and TMJ pain. Emshoff et al7revealed a statistically significant rela- tionship between the presence of TMJ pain and joint effu- sion. They found that with an increase in the probability of intra-articular pain in disc displacement without reduction, the probability of joint effusion increased. Suenaga et al17 also reported that the relationship between the contrast enhancement of joint effusion and joint pain was much stronger than that between the extent of joint effusion and clinical symptoms.
Some reports insisted that only a certain type of TMJ pain was related to joint effusion.11,13Güler et al11reported that there was a correlation between spontaneous pain and joint effusion. However, they did not find a correlation between the severity of pain and joint effusion, even though painful joints were more likely to demonstrate the contrast enhancement of joint effusion. Takahashi et al13showed the relationship between provoked pain and joint effusion.
According to Murakami et al,12 only chewing pain and joint effusion showed a positive correlation in patients with TMJ closed lock. Pain scores, such as those of pain on mouth opening and pain on palpation of the masticatory muscles, did not correlate with joint effusion. These pains might be related to other sources such as the capsular liga- ment component. However, Adame et al15and Ohlmann et al14 reported that there was no relationship between TMJ pain and joint effusion.
According to the biochemical investigations of TMJ syn- ovial fluids, degenerative changes in the disc or the articu- lar surface of the condyle lead to the release of chemical agents such as tumor necrosis factor alpha (TNF-α)28and total protein.29Emshoff et al28 reported that a TMJ pain condition of capsulitis or synovitis was significantly related to the synovial fluid aspirate findings of the TNF-α level.
According to Güler et al,29the total protein concentration of the synovial fluid increased with increased synovial inflammation, and the chemical agents could change the rate of contents in the synovial fluid. Suenaga et al17report- ed that the nitric oxide concentration in the TMJ fluid is closely related to the inflammatory changes and joint pain owing to TMJ synovitis. Nishimura et al30 reported that synovitis, as a cause of TMJ pain, was significantly corre- lated with the concentrations of bradykinin and leukotriene
B4 (LB4). Although there is general agreement that joint effusion may reflect the intra-articular pathology in joints, the relationship between joint effusion and pain remains a matter of controversy.
In this study, spontaneous pain, provoked pain, and both spontaneous and provoked pain were significantly related to joint effusion in TMD patients. However, pain on palpa- tion of the masticatory muscles and TMJ (G1) was not significantly related to joint effusion in TMD patients.
In conclusion, spontaneous pain was related to the MR findings of joint effusion; however, pain on palpation of the masticatory muscles and TMJ was not related to the MR findings of joint effusion in TMD patients. These results suggested that joint effusion had a statistically sig- nificant influence on the prediction of TMJ pain. Further studies might provide more insight into the relationship between the diagnostic usefulness of internal derangement and osteoarthritis and TMJ pain.
References
1. Emshoff R, Rudisch A. Validity of clinical diagnostic criteria for temporomandibular disorders: clinical versus magnetic res- onance imaging diagnosis of temporomandibular joint internal derangement and osteoarthrosis. Oral Surg Oral Med Oral Pathol Oral Radiol Endod 2001; 91: 50-5.
2. Emshoff R, Brandlmaier I, Bertram S, Rudisch A. Relative odds of temporomandibular joint pain as a function of mag- netic resonance imaging findings of internal derangement, osteoarthrosis, effusion, and bone marrow edema. Oral Surg Oral Med Oral Pathol Oral Radiol Endod 2003; 95: 437-45.
3. Bertram S, Rudisch A, Innerhofer K, Pümpel E, Grubwieser G, Emshoff R. Diagnosing TMJ internal derangement and osteoarthritis with magnetic resonance imaging. J Am Dent Assoc 2001; 132: 753-61.
4. Drace JE, Enzmann DR. Defining the normal temporo- mandibular joint: closed-, partially open-, and open-mouth MR imaging of asymptomatic subjects. Radiology 1990; 177: 67-71.
5. Haley DP, Schiffman EL, Lindgren BR, Anderson Q, Andrea- sen K. The relationship between clinical and MRI findings in patients with unilateral temporomandibular joint pain. J Am Dent Assoc 2001; 132: 476-81.
6. Rudisch A, Innerhofer K, Bertram S, Emshoff R. Magnetic resonance imaging findings of internal derangement and effu- sion in patients with unilateral temporomandibular joint pain.
Oral Surg Oral Med Oral Pathol Oral Radiol Endod 2001; 92:
566-71.
7. Emshoff R, Brandlmaier I, Bertram S, Rudisch A. Risk factors for temporomandibular joint pain in patients with disc displace- ment without reduction - a magnetic resonance imaging study.
J Oral Rehabil 2003; 30: 537-43.
8. Yano K, Sano T, Okano T. A longitudinal study of magnetic resonance (MR) evidence of temporomandibular joint (TMJ) fluid in patients with TMJ disorders. Cranio 2004; 22: 64-71.
9. Larheim TA. Role of magnetic resonance imaging in the clinical diagnosis of the temporomandibular joint. Cells Tissues Organs 2005; 180: 6-21.
10. Emshoff R, Rudisch A. Temporomandibular joint internal derangement and osteoarthrosis: are effusion and bone marrow edema prognostic indicators for arthrocentesis and hydraulic distention? J Oral Maxillofac Surg 2007; 65: 66-73.
11. Güler N, Yatmaz PI, Ataoglu H, Emlik D, Uckan S. Temporo- mandibular internal derangement: correlation of MRI findings with clinical symptoms of pain and joint sounds in patients with bruxing behaviour. Dentomaxillofac Radiol 2003; 32:
304-10.
12. Murakami K, Segami N, Fujimura K, Iizuka T. Correlation between pain and synovitis in patients with internal derange- ment of the temporomandibular joint. J Oral Maxillofac Surg 1991; 49: 1159-62.
13. Takahashi T, Nagai H, Seki H, Fukuda M. Relationship bet- ween joint effusion, joint pain, and protein levels in joint lavage fluid of patients with internal derangement and osteoarthritis of the temporomandibular joint. J Oral Maxillofac Surg 1999; 57:
1187-94.
14. Ohlmann B, Rammelsberg P, Henschel V, Kress B, Gabbert O, Schmitter M. Prediction of TMJ arthralgia according to clinical diagnosis and MRI findings. Int J Prosthodont 2006; 19: 333-8.
15. Adame CG, Monje F, Offnoz M, Martin-Granizo R. Effusion in magnetic resonance imaging of the temporomandibular joint:
a study of 123 joints. J Oral Maxillofac Surg 1998; 56: 314-8.
16. Westesson PL, Brooks SL. Temporomandibular joint: relation- ship between MR evidence of effusion and the presence of pain and disk displacement. AJR Am J Roentgenol 1992; 159: 559- 63.
17. Suenaga S, Abeyama K, Hamasaki A, Mimura T, Noikura T.
Temporomandibular disorders: relationship between joint pain and effusion and nitric oxide concentration in the joint fluid.
Dentomaxillofac Radiol 2001; 30: 214-8.
18. Smith HJ, Larheim TA, Aspestrand F. Rheumatic and non- rheumatic disease in the temporomandibular joint: gadolinium- enhanced MR imaging. Radiology 1992; 185: 229-34.
19. Segami N, Suzuki T, Sato J, Miyamaru M, Nishimura M, Yoshimura H. Does joint effusion on T2 magnetic resonance images reflect synovitis? Part 3. Comparison of histologic findings of arthroscopically obtained synovium in internal derangements of the temporomandibular joint. Oral Surg Oral Med Oral Pathol Oral Radiol Endod 2003; 95: 761-6.
20. Koh KJ, List T, Petersson A, Rohlin M. Relationship between clinical and magnetic resonance imaging diagnoses and find- ings in degenerative and inflammatory temporomandibular joint diseases: a systemic literature review. J Orofac Pain 2009;
23: 123-39.
21. Barclay P, Hollender LG, Maravilla KR, Truelove EL. Com- parison of clinical and magnetic resonance imaging diagnosis in patients with disk displacement in the temporomandibular joint. Oral Surg Oral Med Oral Pathol Oral Radiol Endod 1999; 88: 37-43.
22. Huddleston Slater JJ, Lobbezoo F, Chen YJ, Naeije M. A com- parative study between clinical and instrumental methods for the recognition of internal derangements with a clicking sound on condylar movement. J Orofac Pain 2004; 18: 138-47.
23. U¸sümez S, Oz F, Güray E. Comparison of clinical and mag- netic resonance imaging diagnoses in patients with TMD history. J Oral Rehabil 2004; 31: 52-6.
24. Limchaichana N, Nilsson H, Ekberg EC, Nilner M, Petersson A. Clinical diagnoses and MRI findings in patients with TMD pain. J Oral Rehabil 2007; 34: 237-45.
25. Sano T, Westesson PL. Magnetic resonance imaging of the temporomandibular joint. Increased T2 signal in the retrodiskal tissue of painful joints. Oral Surg Oral Med Oral Pathol Oral Radiol Endod 1995; 79: 511-6.
26. Harms SE, Wilk RM, Wolford LM, Chiles DG, Milam SB. The temporomandibular joint: magnetic resonance imaging using surface coils. Radiology 1985; 157: 133-6.
27. Emshoff R, Brandimaier I, Bertram S, Rudisch A. Magnetic resonance imaging findings of osteoarthrosis and effusion in patients with unilateral temporomandibular joint pain. Int J Oral
Maxillofac Surg 2002; 31: 598-602.
28. Emshoff R, Puffer P, Rudisch A, Gassner R. temporomandi- bular joint pain: relationship to internal derangement type, osteoarthrosis, and synovial fluid mediator level of tumor necrosis factor-alpha. Oral Surg Oral Med Oral Pathol Oral Radiol Endod 2000; 90: 442-9.
29. Güler N, Uçkan S, Imirzalio˘glu P, Açikgözo˘glu S. Temporo- mandibular joint internal derangement: relationship between joint pain and MR grading of effusion and total protein concen- tration in the joint fluid. Dentomaxillofac Radiol 2005; 34:
175-81.
30. Nishimura M, Segami N, Kaneyama K, Suzuki T, Miyamaru M. Relationships between pain-related mediators and both synovitis and joint pain in patients with internal derangements and osteoarthritis of the temporomandibular joint. Oral Surg Oral Med Oral Pathol Oral Radiol Endod 2002; 94: 328-32.