I. Introduction
Developing countries are characterized by poor infrastruc- ture and limited resources. The World Health organization has indicated that with the current financing strategy, many developing countries do not meet the requirements for uni- versal healthcare coverage. Angola spends 3.4% of their GDP on healthcare expenditure. Republic of Congo spends 2.5%;
Eritrea spends 2.6%, and Kuwait spends 2.7% of their GDP on health compared to the Unites States which spends 17.9%
of their GDP [1]. Developing countries struggle under the burden of human immunodeficiency virus (HIV), tubercu- losis and malaria [2]. HIV is an incurable disease which af- fects the functioning of the immune system of a human over a long period of time.
Machine Learning to Improve the Effectiveness of ANRS in Predicting HIV Drug Resistance
Yashik Singh, PhD
Department of Telehealth, Nelson R Mandela School of Medicine, University of KwaZulu Natal, South Africa
Objectives: Human immunodeficiency virus infection and acquired immune deficiency syndrome (HIV/AIDS) is one of the major burdens of disease in developing countries, and the standard-of-care treatment includes prescribing antiretroviral drugs. However, antiretroviral drug resistance is inevitable due to selective pressure associated with the high mutation rate of HIV. Determining antiretroviral resistance can be done by phenotypic laboratory tests or by computer-based interpretation algorithms. Computer-based algorithms have been shown to have many advantages over laboratory tests. The ANRS (Agence Nationale de Recherches sur le SIDA) is regarded as a gold standard in interpreting HIV drug resistance using mutations in genomes. The aim of this study was to improve the prediction of the ANRS gold standard in predicting HIV drug resistance.
Methods: A genome sequence and HIV drug resistance measures were obtained from the Stanford HIV database (http://
hivdb.stanford.edu/). Feature selection was used to determine the most important mutations associated with resistance pre- diction. These mutations were added to the ANRS rules, and the difference in the prediction ability was measured. Results:
This study uncovered important mutations that were not associated with the original ANRS rules. On average, the ANRS algorithm was improved by 79% ± 6.6%. The positive predictive value improved by 28%, and the negative predicative value improved by 10%. Conclusions: The study shows that there is a significant improvement in the prediction ability of ANRS gold standard.
Keywords: Medical Informatics, Health Informatics, Computational Biology, Artificial Intelligence, Clinical Informatics, Ma- chine Learning
Healthc Inform Res. 2017 October;23(4):271-276.
https://doi.org/10.4258/hir.2017.23.4.271 pISSN 2093-3681 • eISSN 2093-369X
Submitted: June 24, 2017 Revised: October 16, 2017 Accepted: October 20, 2017 Corresponding Author Yashik Singh, PhD
Department of Telehealth, Nelson R Mandela School of Medicine, Uni- versity of KwaZulu Natal, South Africa. Tel: +27-312604543, E-mail:
singhyashik@gmail.com
This is an Open Access article distributed under the terms of the Creative Com- mons Attribution Non-Commercial License (http://creativecommons.org/licenses/by- nc/4.0/) which permits unrestricted non-commercial use, distribution, and reproduc- tion in any medium, provided the original work is properly cited.
ⓒ 2017 The Korean Society of Medical Informatics
There are currently almost 6.4 million people infected with HIV in South Africa, which is approximately 12.2% of the South African population [3,4]. Swaziland has a HIV infec- tion prevalence of 26%, Botswana 25%, and Lesotho 24% [5].
The burden of HIV in Africa is understood when acknowl- edging the contrast with the prevalence of HIV in developed countries. France and Spain have a prevalence of 0.4%, while Netherland has a prevalence of 0.2%. It is also estimated that there are almost 500,000 patients who exhibit AIDS defining conditions in South Africa [6].
HIV is managed by highly active antiretroviral therapy, which consists of antiretroviral (ARV) drugs from protease inhibitors, reverse transcriptase inhibitors, integrate inhibi- tors, fusion inhibitors, and entry inhibitors. However, the success of managing HIV with ARVs is dependent on the actual treatment, stage of the disease, drug potency, patient adherence, achievable drug concentrations, drug resistance and toxic effects of the drugs [7,8]. Of these factors, drug resistance is crucial and defined as the diminished ability of antiretroviral drugs to reduce the HIV viral load adequately [2].
HIV drug resistance is inevitable due to selective pressure facilitated by the presence of ARVs during the management of HIV, high replication errors of the virus and initial infec- tion [8]. Thus, the ability to easily determine drug resistance is vital in the treatment of HIV positive patients. HIV drug resistance is normally tested using phenotypic tests [9].
Briefly, phenotypic tests work by analyzing the concentra- tion of ARV that is required to reduce the reproduction of a laboratory grown sample of the HIV that has infected a spe- cific patient by 50%. The ratio of this concentration over the concentration required when using the wild type (original) HIV virus is called the IC50. The IC50 score is compared to cutoff values obtained from the literature and is thus char- acterized as being either resistant to ARV drugs, susceptible to ARV drugs or intermediate resistance to ARV drugs. Al- though the IC50 score is seen as the absolute measurement, laboratory based tests are relatively expensive, time consum- ing, and susceptible to errors, and each test detects resistance to a single drug, and thus, many tests are required to deter- mine multiple drug resistances [10]. With the current dis- ease burden and lack of resources in developing countries, phenotypic tests are not viable.
Electronic computerized algorithms [11] (a part of the medical informatics domain) may also be used to determine ARV drug resistance and have many advantages over phe- notype testing. Computer-based genotype interpretation al- gorithms usually determine mutations in a patient’s pol gene
and uses this information to determine which ARV drugs the patient is resistant to. The literature has associated mu- tations with particular resistance profiles. These computer based tests are faster and cheaper than phenotypic tests.
One widely used computer based interpretation algorithm was built by the French ANRS (Agence Nationale de Re- cherches sur le SIDA; National Agency for AIDS Research) AC11 Resistance group and is called the Agence Nationale de Recherches sur le SIDA. ANRS is seen as a gold standard in interpreting HIV drug resistance using mutations in ge- nomes. ANRS classifies ARV resistance according to three levels: susceptible, intermediate, and resistant. ‘Susceptible’
indicates that a particular ARV drug will be effective against HIV; ‘intermediate’ indicates that the ARV drug is partially effective; and if the ARV is not effective at all, it is classified
‘resistant’.
ANRS algorithm is based on a linear combination of muta- tions. If a particular mutation or a group of mutations are present in the genome, the algorithm returns a resistance profile applicable to that particular sequence, e.g., if the mu- tation A98S is present in the genome, resistance to the NVP is deduced, whereas an E138K mutation will indicate inter- mediate resistance to the NVP drug.
Each rule consists of a Boolean expression. For example, an ANRS rule for abacavir (version 13, July 2005) states: “If there are five or more of the following RT mutations (M41L, D67N, L74V, M184V/I, L210W, T215Y/F), report resistance to abacavir” [12].
The ANRS system bases its interpretations almost entirely on genotype outcome studies, and the ANRS has published a large proportion of studies linking genotype to the virologi- cal outcome, including studies on genotypic predictors of re- sponse to abacavir [13], tenofovir [13], and didanosine [14].
ANRS is based on an experts’ understanding of the do- main and available datasets as well as the published litera- ture. Therefore, there may be discrepancies and room for improvement. The average accuracy of ANRS was 59% [2].
Thus, the aim of this study was to use machine learning to see if there can be improvements in the effectiveness of ANRS in predicting HIV drug resistance.
II. Methods
The methods used in this paper are divided into three parts:
data-processing, development of an association matrix, and the determination of the effectiveness of ANRS with the in- corporation of the association matrix.
1. Data Processing
Free publically available and de-identified genotype- phenotype datasets that consisted of approximately 23,000 protease (PR) gene and 23,000 reverse transcriptase (RT) gene sequences were obtained from the Stanford HIV drug resistance database (http://hivdb.stanford.edu/).
These datasets were fed into the ANRS algorithm, and a re- sistance measure was obtained for each sequence. The ANRS result was then compared to the known resistance measure obtained from a laboratory test for each sequence, and the accuracy of the ANRS algorithm was calculated.
2. Development of the Association Matrix
Machine learning is an artificial intelligence technique that tries to create a model that maps inputs into outputs. There are two parts to machine learning: training, where one ap- plies the principles of a particular machine learning model on data to create the mathematical mapping function, and the testing component, where one tests the predictive ability of the model on data with known outcomes. A 5-fold cross- validation was done with testing and training. The dataset was randomly divided into a training set that consisted of 18,400 PR and RT sequences and a testing dataset that con- sisted of 4,600 PR and RT sequences. This was done five times, and an average of the accuracies was calculated.
Feature selection was chosen as the machine learning tech- nique because it helps determine the importance of each of the inputs into the model, and in that way, the importance of each mutation in determining HIV drug resistance may be calculated.
Feature selection (ReliefF), MODTree filtering, FCBF fil- tering, and CFS filtering were used to determine the impor-
tance of each mutation in predicting HIV drug resistance.
ReliefF is a component for automatic variable selection in a supervised learning task, which can handle both continuous and discrete descriptors. FCBF filtering is a fast correlation based filtering approach. CFS filtering is a correlation based filtering approached whereas MODTree is a multivalued oblivious decision tree approach.
The open-source software used to perform the machine learning is called Tanagra, version 1.4 [15]. PR and RT se- quences were used separately when determining the impor- tance of particular mutations using these feature selection techniques. The results of the filters were combined addi- tively, and the top 10 mutation positions were calculated for each ARV drug that mathematically had the biggest contri- bution to predicting HIV drug resistance. These created the association matrix for each drug.
3. Effectiveness of the ANRS with the Incorporation of the Association Matrix
The association matrix for each drug was added to the rules of the ANRS algorithm. This new model was then applied to a separate (unused in the training process) testing dataset, and the changes in the ability to predict HIV drug resistance was analyzed. Changes in the accuracy, sensitivity, and speci- ficity were calculated.
III. Results
The feature selection algorithms were successfully run, and mutations that do not exist in the ANRS rules were found to contribute to resistance for all 10 ARVs tested: IDV (indina- vir), LPV (lopinavir), NFV (nelfinavir), SQV (saquinavir),
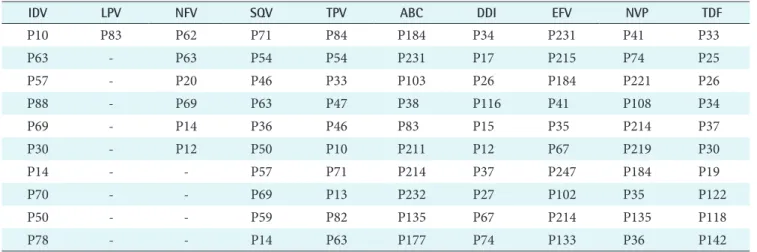
Table 1. Important mutations that contribute to the resistance of each ARV
IDV LPV NFV SQV TPV ABC DDI EFV NVP TDF
P10 P83 P62 P71 P84 P184 P34 P231 P41 P33
P63 - P63 P54 P54 P231 P17 P215 P74 P25
P57 - P20 P46 P33 P103 P26 P184 P221 P26
P88 - P69 P63 P47 P38 P116 P41 P108 P34
P69 - P14 P36 P46 P83 P15 P35 P214 P37
P30 - P12 P50 P10 P211 P12 P67 P219 P30
P14 - - P57 P71 P214 P37 P247 P184 P19
P70 - - P69 P13 P232 P27 P102 P35 P122
P50 - - P59 P82 P135 P67 P214 P135 P118
P78 - - P14 P63 P177 P74 P133 P36 P142
ARV: antiretroviral, IDV: indinavir, LPV: lopinavir, NFV: nelfinavir, SQV: saquinavir, TPV: tipranavir, ABC: abacavir, DDI: didano- sine, EFV: efavirenz, NVP: nevirapine, TDF: tenofovir.
TPV (tipranavir), ABC (abacavir), DDI (didanosine), EFV (efavirenz), NVP (nevirapine), and TDF (tenofovir). These mutations are listed in Table 1. To determine the difference in predicating HIV drug resistance, the correctly and incor- rectly classified sequences were calculated shown in Tables 2 and 3. Tables 4 and 5 present the results on the sensitivity and specificity that were calculated to further investigate the effectiveness of adding the association matrix to the ANRS original rules.
This study showed considerable improvement in predicting HIV drug resistance using machine learning against the gold standard ANRS.
IV. Discussion
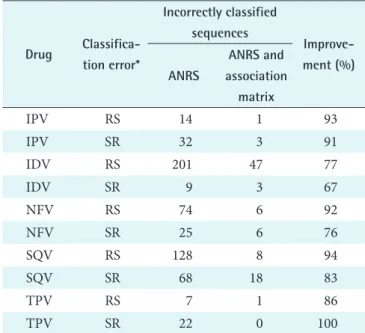
The results show that the ANRS gold standard can be im- Table 2. The correctly classified sequences out of the total se
quences and the accuracy in percentage for all the PR ARVs
Drug Classifica
tion error*
Incorrectly classified sequences
Improve
ment (%) ANRS
ANRS and association
matrix
IPV RS 14 1 93
IPV SR 32 3 91
IDV RS 201 47 77
IDV SR 9 3 67
NFV RS 74 6 92
NFV SR 25 6 76
SQV RS 128 8 94
SQV SR 68 18 83
TPV RS 7 1 86
TPV SR 22 0 100
PR: protease, ARV: antiretroviral, ANRS: National Agency for AIDS Research, IPV: inactivated poliovirus vaccine, IDV: in- dinavir, NFV: nelfinavir, SQV: saquinavir, TPV: tipranavir, RS:
the sequence was incorrectly classified as resistant instead of susceptible, SR: the sequence was incorrectly classified as sus- ceptible instead of resistant.
Table 3. The correctly classified sequences out of the total se
quences and the accuracy in percentage for all the RT ARVs
Drug Classifica
tion error*
Incorrectly classified sequences
Improve
ment (%) ANRS
ANRS and association
matrix
ABC RS 55 13 76
ABC SR 206 28 86
DDI RS 165 29 82
DDI SR 165 44 73
EFV RS 233 96 59
EFV SR 131 20 85
NVP RS 170 73 57
NVP SR 177 45 75
TDF RS 25 8 68
TDF SR 55 10 82
RT: reverse transcriptase, ARV: antiretroviral, ANRS: National Agency for AIDS Research, ABC: abacavir, DDI: didanosine, EFV:
efavirenz, NVP: nevirapine, TDF: tenofovir, RS: the sequence was incorrectly classified as resistant instead of susceptible, SR: the se- quence was incorrectly classified as susceptible instead of resistant.
Table 4. PPV and NPV for all the PR ARVs used in the study
ARV Initial PPV (%)
PPV with assosiation matrix (%)
Initial NPV (%)
NPV with assosiation matrix (%)
IDV 70 92a 98 99a
LPV 97 100a 93 99a
NFV 88 99a 96 99a
SQV 74 98a 94 99a
TPV 0 86a 95 100a
PR: protease, AVR: antiretroviral, PPV: positive predictive value, NPV: negative predictive value.
aZ-score is >1.98, indicating there is a statically significant dif- ference when adding the association matrix.
Table 5. PPV and NPV of predicting HIV resistance for PR ARV drugs for both the ANRS algorithm alone and when the machine learning mutations are incorporated into them
ARV Initial PPV (%)
PPV with assosiation matrix (%)
Initial NPV (%)
NPV with assosiation matrix (%)
ABC 76 94a 74 96a
DDI 42 85a 81 95a
EFC 66 71a 82 97a
NPV 80 97a 78 94a
IDF 24 75a 84 97a
PPV: positive predictive value, NPV: negative predictive value, HIV: human immunodeficiency virus, PR: protease, AVR: anti- retroviral, ANRS: National Agency for AIDS Research.
aZ-score is >1.98, indicating there is a statically significant dif- ference when adding the association matrix.
proved with respect to predicting HIV drug resistance for all ten ARV drugs tested. Table 1 lists the mutations not present in the ANRS algorithm for each of the 10 ARV drugs. Some of the major contributors to predicting HIV drug resistance for protease ARV drugs, using the feature selection algo- rithms, were P63, P57, P82, and P69. However, the ANRS algorithm only has P82 in its major mutation list. Similarly, P30, P35, P142, and P83 were identified as important muta- tions for RT ARV drugs, which were not a part of the ANRS algorithm. Up to the ten most important mutations for each ARV, which were not present in the ANRS algorithm, were combined with the original ANRS algorithm to determine if there were any changes to the ability of the new algorithm to predict the susceptibility and resistance to ARV drugs.
Eighty-five PI sequences (59%) were supposed to be inter- preted as resistant but were classified as susceptible accord- ing to the original ANRS. Adding the rules derived from the machine learning algorithm results in an 88% ± 7.1%
improvement in the overall accuracy. A t-test was performed to determine if the improvement was due to random chance, and a p < 0.001 was obtained. This indicates that there is a statistically significant improvement in the prediction of the susceptibility measure for the five PR drugs.
Thirty-one PI sequences (63%) were wrongly classified as susceptible instead of resistant according to the original ANRS algorithm. Adding the rules derived from the ma- chine learning algorithm, results in an 83% ± 12.1% im- provement in the overall accuracy. A t-test was performed to determine if the improvement was due to random chance, and a p < 0.004 was obtained. This indicates that there is a statistically significant improvement in the prediction of the resistant measure for the five PR drugs.
Nearly 130 RT sequences (58%) were wrongly classified as susceptible instead of resistant. Using the machine learning algorithm rules results in a 69% ± 10.9% improvement in the overall accuracy. A t-test was performed to determine if the improvement was due to random chance, and a p-value of 0.004 was obtained. This indicates that there is a statistically significant improvement in the prediction of the susceptibil- ity measures for the five RT drugs.
One hundred forty-seven RT sequences (60%) were wrong- ly classified as susceptible instead of resistant. Adding the rules derived from the machine learning algorithm results in an 80% ± 5.9% improvement in the overall accuracy. A t-test was performed to determine if the improvement was due to random chance, and a p < 0.004 was obtained. This indicates that there is a statistically significant improvement in the prediction of resistant measures for the five RT drugs.
Table 4 shows the positive predictive value (PPV) and negative predictive value (NPV) of all the PR ARVs used in the study. A Z-score >1.98 was obtained when the new ANRS rules where used indicating there is a statically signif- icant difference when adding the association matrix. Table 5 shows the PPV and NPV of predicting HIV resistance for PR ARV drugs for both the ANRS algorithm alone and when the machine learning mutations are incorporated into them. The PPV improved by 27% while the NPV improved by 16%. These results show that the incorporation of the ma- chine learning mutation does positively influence the ability of ANRS to predict RT ARV drug resistance.
In conclusion, the above study shows that there is a signifi- cant improvement in the prediction ability of the ANRS gold standard. On average, the ANRS algorithm was improved by 79% ± 6.6%. The positive predictive value improved by 28%, and the negative predicative value improved by 10%.
Some of the major contributors to predicting HIV drug re- sistance for protease ARV drugs, using the feature selection algorithms, were P63, P57, P82, and P69. Similarly, P30, P35, P142, and P83 were identified as important mutations for RT ARV drugs. These indicate that the ANRS gold standard has its limitations, which can be improved. Future studies may include using other machine learning algorithms like support vector machines and Bayesian networks. A larger dataset will be of benefit.
Conflict of Interest
No potential conflict of interest relevant to this article was reported.
References
1. Lv Z, Zhu H. Health care expenditure and GDP in Af- rican countries: evidence from semiparametric estima- tion with panel data. ScientificWorldJournal 2014;2014:
905747.
2. Yashik S, Maurice M. Predicting a single HIV drug re- sistance measure from three international interpretation gold standards. Asian Pac J Trop Med 2012;5(7):566-72.
3. Actuarial Society of South Africa. ASSA2008 model [Internet]. Cape Town, South Africa: Actuarial Society of South Africa; 2011 [cited at 2017 Oct 15]. Available from: http://www.actuarialsociety.org.za/committees/
demography-epidemiology-committee/aids-models/.
4. Shisana O, Rehle T, Simbayi LC, Zuma K, Jooste S, Zungu N, et al. South African National HIV Prevalence,
Incidence and Behaviour Survey, 2012. Pretoria, South Africa: Human Sciences Research Council; 2014 [cited at 2107 Oct 15]. Available from: http://www.hsrc.ac.za/
en/research-data/view/6871.
5. Central Intelligence Agency. The World Factbook: HIV/
AIDS - adult prevalence rate [Internet]. Washington (DC): Central Intelligence Agency; 2012 [cited at 2017 Oct 15]. Available from: https://www.cia.gov/library/
Publications/the-world-factbook/fields/2155.html.
6. Health Systems Trust. Percentage of deaths due to AIDS Health Indicators [Internet]. Durban, South Africa:
Health Systems Trust; 2011 [cited at 2017 Oct 15]. Avail- able from: http://www.hst.org.za/.
7. Richman D, Staszewski S. HIV drug resistance and its implications for antiretroviral treatment strategies. Lon- don: International Medical Press; 1997.
8. EuroGuidelines Group for HIV Resistance. Clinical and laboratory guidelines for the use of HIV-1 drug resis- tance testing as part of treatment management: recom- mendations for the European setting. AIDS 2012;15(3):
309-20.
9. Meynard JL, Vray M, Morand-Joubert L, Race E, Des- camps D, Peytavin G, et al. Phenotypic or genotypic re- sistance testing for choosing antiretroviral therapy after treatment failure: a randomized trial. AIDS 2002;16(5):
727-36.
10. Bartlett JC, Gallant JE. Medical Management of HIV infection. Baltimore (MD): John Hopkins University AIDS Service; 2004.
11. Toor JS, Sharma A, Kumar R, Gupta P, Garg P, Arora SK. Prediction of drug-resistance in HIV-1 subtype C based on protease sequences from ART naive and first- line treatment failures in North India using genotypic and docking analysis. Antiviral Res 2011;92(2):213-8.
12. Liu TF, Shafer RW. Web resources for HIV type 1 geno- typic-resistance test interpretation. Clin Infect Dis 2006;
42(11):1608-18.
13. Katlama C, Clotet B, Plettenberg A, Jost J, Arasteh K, Bernasconi E, et al. The role of abacavir (ABC, 1592) in antiretroviral therapy-experienced patients: results from a randomized, double-blind, trial. CNA3002 European Study Team. AIDS 2000;14(7):781-9.
14. Masquelier B, Assoumou KL, Descamps D, Bocket L, Cottalorda J, Ruffault A, et al. Clinically validated muta- tion scores for HIV-1 resistance to fosamprenavir/rito- navir. J Antimicrob Chemother 2008;61(6):1362-8.
15. Rajkumar A, Reena GS. Diagnosis of heart disease us- ing datamining algorithm. Glob J Comput Sci Technol 2010;10(10):38-43.