Endocrinol Metab 2016;31:86-92
http://dx.doi.org/10.3803/EnM.2016.31.1.86 pISSN 2093-596X · eISSN 2093-5978
Original Article
The Relationship between 10-Year Cardiovascular Risk Calculated Using the Pooled Cohort Equation and the Severity of Non-Alcoholic Fatty Liver Disease
Jeong In Lee, Min Chul Kim, Byung Sub Moon, Young Seok Song, Eun Na Han, Hyo Sun Lee, Yoonjeong Son, Jihyun Kim, Eun Jin Han, Hye-Jeong Park, Se Eun Park, Cheol-Young Park, Won-Young Lee, Ki-Won Oh, Sung-Woo Park, Eun-Jung Rhee
Division of Endocrinology and Metabolism, Department of Internal Medicine, Kangbuk Samsung Hospital, Sungkyunkwan University School of Medicine, Seoul, Korea
Background: We investigated the association between the severity of non-alcoholic fatty liver disease (NAFLD) and the esti- mated 10-year risk of cardiovascular disease (CVD) calculated by Pooled Cohort Equation (PCE) and Framingham risk score (FRS).
Methods: A total of 15,913 participants (mean age, 46.3 years) in a health screening program were selected for analysis. The presence and severity of fatty liver was assessed by abdominal ultrasonogram. Subjects who drank alcohol more than three times a week were excluded from the study.
Results: Among the participants, 57.6% had no NAFLD, 35.4% had grade I, 6.5% had grade II, and 0.5% had grade III NAFLD.
Mean estimated 10-year CVD risk was 2.59%, 3.93%, 4.68%, and 5.23% calculated using the PCE (P for trend <0.01) and 4.55%, 6.39%, 7.33%, and 7.13% calculated using FRS, according to NAFLD severity from none to severe (P for trend <0.01).
The odds ratio for ≥7.5% estimated CVD risk calculated using the PCE showed a higher correlation with increasing severity of NAFLD even after adjustment for conventional CVD risk factors (1.52, 2.56, 3.35 vs. the no NAFLD group as a reference, P<0.01) compared with calculated risk using FRS (1.65, 1.62, 1.72 vs. no NAFLD group as a reference, P<0.01).
Conclusion: In our study of apparently healthy Korean adults, increasing severity of NAFLD showed a higher correlation with estimated 10-year CVD risk when calculated using the PCE than when calculated using FRS.
Keywords: Non-alcoholic fatty liver disease; Pooled Cohort Equation; Framingham risk score
INTRODUCTION
Non-alcoholic fatty liver disease (NAFLD) falls on a patholog- ic spectrum ranging from simple steatosis and non-alcoholic steatohepatitis, progressing to end-stage liver disease with liver
cirrhosis and hepatocellular carcinoma [1]. NAFLD is recog- nized as the most common cause of liver disease worldwide, with a prevalence of 15% to 35% in various populations [2-7];
an increasing incidence of NAFLD has been observed.
Recent studies demonstrate that 10-year cardiovascular risk
Received: 29 May 2015, Revised: 18 June 2015, Accepted: 2 July 2015 Corresponding author: Eun-Jung Rhee
Division of Endocrinology and Metabolism, Department of Internal Medicine, Kangbuk Samsung Hospital, Sungkyunkwan University School of Medicine, 29 Saemunan-ro, Jongno-gu, Seoul 03181, Korea
Tel: +82-2-2001-2485, Fax: +82-2-2001-1588, E-mail: [email protected]
Copyright © 2016 Korean Endocrine Society
This is an Open Access article distributed under the terms of the Creative Com- mons Attribution Non-Commercial License (http://creativecommons.org/
licenses/by-nc/4.0/) which permits unrestricted non-commercial use, distribu- tion, and reproduction in any medium, provided the original work is properly cited.
factors may correlate with the severity of NAFLD [8,9]. In 2010, Chiang et al. [8] observed that the severity of NAFLD had a significant positive correlation with Framingham risk score (FRS). However, in 2013, the American College of Car- diology (ACC)/American Heart Association (AHA) Task Force released a new report on the treatment of blood cholesterol, suggesting the four groups with benefit of statin treatment and removing the specific target levels for blood cholesterol for the reduction of cardiovascular disease (CVD) from the guideline [10]. This guideline recommended a new risk assessment tool to assess 10-year atherosclerotic cardiovascular disease (AS- CVD) risk, named the Pooled Cohort Equation (PCE), which uses age, sex, race, total cholesterol, high density lipoprotein cholesterol (HDL-C), systolic blood pressure, treatment for high hypertension, diabetes and smoking as risk factors. This is different from assessment with FRS, which uses age, sex, total cholesterol, HDL-C, blood pressure, and smoking as risk fac- tors [11]. Although the FRS has been validated in many popu- lations, its accuracy is somewhat limited among Asian popula- tions [12,13]. There is no report validating or applying the PCE to assess CVD risk with severity of NAFLD.
Therefore, we investigated the association between NAFLD severity and 10-year cardiovascular risk and compared cardio- vascular risk estimated by the PCE with that estimated by FRS in a healthy Korean population.
METHODS
Study design and population
This was a cross-sectional study of a subset of participants in a medical health checkup program in the Health Promotion Cen- ter of Kangbuk Samsung Hospital, Sungkyunkwan University School of Medicine, Seoul, Korea. The purpose of the medical health checkup program is to promote the health of employees through regular health checkups and to enhance early detection of existing diseases. Most of the participants are employees and family members of various industrial companies from around the country. The cost of medical examinations is largely paid for by their employers, and a considerable proportion of the participants undergo examinations annually or biannually.
The initial study population included 19,920 subjects who participated in the medical checkup program from January 2011 to December 2012, and in whom fatty liver grades were available. We excluded participants who drank three or more times a week and those with medical illnesses that could affect liver function, such as chronic liver disease, liver cirrhosis, and
malignancy. In addition, we excluded the subjects with history of ischemic stroke, ischemic heart disease or taking aspirin due to other atherosclerotic diseases. These strict exclusion criteria resulted in a final study population of 15,913 participants.
All participants provided written informed consent for the use of their health screening data for this study. The design, pro- tocol and the consent procedure of this study were reviewed and approved by Institutional Review Board of Kangbuk Samsung Hospital in accordance with the Helsinki Declaration of 1975.
Laboratory measurements
Height and weight were measured twice and then averaged.
Body mass index (BMI) was calculated by dividing the weight (kg) by the square of the height (m). Blood pressure was mea- sured using a standardized sphygmomanometer after 5 minutes of rest. A smoker was defined as a participant who had smoked at least five complete packs of cigarettes in his or her lifetime.
All participants were examined after an overnight fast. The hexo- kinase method was used to test fasting glucose concentrations (Hitachi Modular D2400, Roche, Tokyo, Japan). Serum aspartate aminotransferase (AST) and alanine aminotransferase (ALT) levels were measured by a photometric UV test (Hitachi Modu- lar D2400). An enzymatic calorimetric test was used to measure total cholesterol and triglyceride concentrations. A selective inhi- bition method was used to measure the level of HDL-C, and a homogeneous enzymatic calorimetric test was used to measure the level of low density lipoprotein cholesterol (LDL-C).
The presence of diabetes mellitus was determined according to a self-administered questionnaire and the diagnostic criteria of the American Diabetes Association [14]. Whether a partici- pant was taking antihypertensive medication was assessed via self-administered questionnaire. The presence or absence of metabolic syndrome was defined according to the criteria from the International Diabetes Federation and AHA/National Heart, Lung and Blood Institute [15].
Assessment of the severity of NAFLD
The diagnosis of fatty liver was based on abdominal ultrasonog- raphy results with a 3.5-MHz transducer (Logic Q700 MR, GE, Milwaukee, WI, USA). Three experienced radiologists who were blinded to both study aims and laboratory values per- formed ultrasonography. Images were captured in a standard fashion, with participants in the supine position with their right arm raised above their head. All ultrasonographic images were stored on the image server and were also taken with instant film for later inspection by radiologists and physicians. Grade I fatty
liver was defined as when echogenicity was increased, grade II as when the echogenic liver obscured the echogenic walls of the portal vein branches, and grade III fatty infiltration as when the echogenic liver obscured the diaphragmatic outline [16,17].
Ten-Year CVD risk calculation
Individual estimation of participants’ 10-year CVD risk was performed with the use of two calculations, the PCE, which was recommended by the new guidelines, and FRS.
Statistical analysis
All data are presented as the mean±SD, and were analyzed us- ing SPSS version 18.0 (SPSS Inc., Chicago, IL, USA). Partici- pants were divided into four groups according to NAFLD grade:
grade 0, grade I, grade II, and grade III. Comparisons of the pa- rameters between participants with NAFLD grade were per- formed using Student t tests and chi-square tests. Bivariate cor- relation analyses between 10-year CVD risk and the other vari- ables were performed using Pearson’s correlation analysis. One-
way analysis of variance (ANOVA) tests were used to compare the means of the PCE and FRS according to severity of NAFLD.
Univariate logistic regression analyses were performed to exam- ine the association of ≥7.5% 10-year CVD risk levels with se- verity of NAFLD and multivariate-adjusted odds ratios (ORs) and their 95% confidence intervals (CIs) were assessed with ad- justment for conventional CVD risk factors such as age, sex, BMI, hypertension, diabetes mellitus, dyslipidemia, metabolic syndrome, and smoking. Significance was defined as P<0.05.
RESULTS
Baseline characteristics
Mean age of the total participants was 46 years and 92.3%
were men. In total, 6,752 subjects (42.4%) had NAFLD, 1,228 subjects (7.7%) had diabetes, 1,247 subjects (7.8%) had hyper- tension, and 2,796 subjects (17.6%) had metabolic syndrome.
Mean serum AST level was 23.0 IU/L, and mean ALT level was 26.3 IU/L (Table 1).
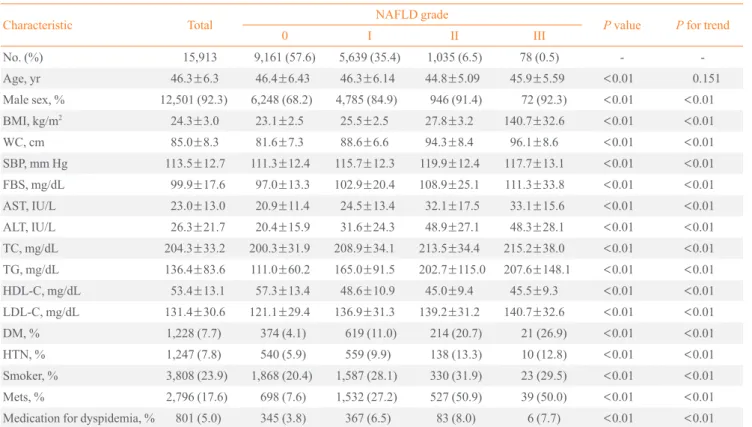
Table 1. Baseline Characteristics of the Participants
Characteristic Total NAFLD grade
P value P for trend
0 I II III
No. (%) 15,913 9,161 (57.6) 5,639 (35.4) 1,035 (6.5) 78 (0.5) - -
Age, yr 46.3±6.3 46.4±6.43 46.3±6.14 44.8±5.09 45.9±5.59 <0.01 0.151
Male sex, % 12,501 (92.3) 6,248 (68.2) 4,785 (84.9) 946 (91.4) 72 (92.3) <0.01 <0.01
BMI, kg/m2 24.3±3.0 23.1±2.5 25.5±2.5 27.8±3.2 140.7±32.6 <0.01 <0.01
WC, cm 85.0±8.3 81.6±7.3 88.6±6.6 94.3±8.4 96.1±8.6 <0.01 <0.01
SBP, mm Hg 113.5±12.7 111.3±12.4 115.7±12.3 119.9±12.4 117.7±13.1 <0.01 <0.01
FBS, mg/dL 99.9±17.6 97.0±13.3 102.9±20.4 108.9±25.1 111.3±33.8 <0.01 <0.01
AST, IU/L 23.0±13.0 20.9±11.4 24.5±13.4 32.1±17.5 33.1±15.6 <0.01 <0.01
ALT, IU/L 26.3±21.7 20.4±15.9 31.6±24.3 48.9±27.1 48.3±28.1 <0.01 <0.01
TC, mg/dL 204.3±33.2 200.3±31.9 208.9±34.1 213.5±34.4 215.2±38.0 <0.01 <0.01
TG, mg/dL 136.4±83.6 111.0±60.2 165.0±91.5 202.7±115.0 207.6±148.1 <0.01 <0.01
HDL-C, mg/dL 53.4±13.1 57.3±13.4 48.6±10.9 45.0±9.4 45.5±9.3 <0.01 <0.01
LDL-C, mg/dL 131.4±30.6 121.1±29.4 136.9±31.3 139.2±31.2 140.7±32.6 <0.01 <0.01
DM, % 1,228 (7.7) 374 (4.1) 619 (11.0) 214 (20.7) 21 (26.9) <0.01 <0.01
HTN, % 1,247 (7.8) 540 (5.9) 559 (9.9) 138 (13.3) 10 (12.8) <0.01 <0.01
Smoker, % 3,808 (23.9) 1,868 (20.4) 1,587 (28.1) 330 (31.9) 23 (29.5) <0.01 <0.01
Mets, % 2,796 (17.6) 698 (7.6) 1,532 (27.2) 527 (50.9) 39 (50.0) <0.01 <0.01
Medication for dyspidemia, % 801 (5.0) 345 (3.8) 367 (6.5) 83 (8.0) 6 (7.7) <0.01 <0.01
Values are expressed as mean±SD or number (%).
NAFLD, non-alcoholic fatty liver disease; BMI, body mass index; WC, waist circumference; SBP, systolic blood pressure; FBS, fasting blood sugar;
AST, aspartate aminotransferase; ALT, alanine aminotransferase; TC, total cholesterol; TG, triglyceride; HDL-C, high density lipoprotein cholester- ol; LDL-C, low density lipoprotein cholesterol; DM, diabetes mellitus; HTN, hypertension; Mets, metabolic syndrome.
Relationship between 10-year CVD risk and NAFLD severity
A one-way ANOVA test was performed between 10-year CVD risk and NAFLD severity to assess the relationship (Fig. 1).
The severity of NAFLD was significantly positively correlated with 10-year CVD risk. In general, mean 10-year CVD risk es- timated using the PCE according to NAFLD grade was numer- ically lower than those calculated using the FRS. The mean 10- year CVD risk estimated by the PCE was 2.59%, 3.93%, 4.68%, and 5.23% for NAFLD grades 0 to III (Fig. 1A). In contrast, mean 10-year CVD risk estimated by the FRS was 4.55%, 6.39%, 7.33%, and 7.13% for NAFLD grade 0 to III, although there were no significant differences between a few individual groups in post hoc analyses (Fig. 1B).
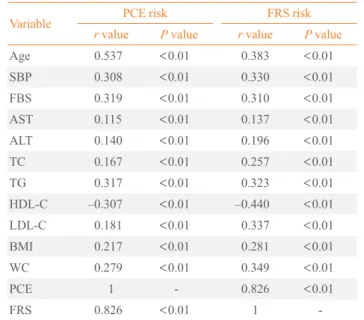
Correlation of 10-year CVD risk with various parameters In correlation analyses, 10-year CVD risks calculated by the two risk scores showed significantly positive correlation with age, systolic blood pressure, fasting blood sugar, liver enzymes, total cholesterol, triglyceride, LDL-C, BMI, and WC, and showed negative correlation with HDL-C (Table 2).
Risk for ≥7.5% estimated CVD risk
Univariate logistic regression analyses were performed with ≥ 7.5% estimated CVD risk as the dependent variable. Compared with NAFLD grade 0, the unadjusted OR for ≥7.5% estimated CVD risk was significantly higher in more severe NAFLD and increased steadily with increasing NAFLD severity. The ad- justed OR for conventional 10-year CVD risk followed the same pattern, with a significantly increasing OR for ≥7.5% es-
timated CVD risk with more severe NAFLD severity. In par- ticular, increased severity of NAFLD showed numerically in- creasing OR for PCE compared with FRS. Adjusted ORs for 10-year CVD risk estimated using the PCE were 1.52 (95% CI, 1.24 to 1.86), 2.56 (95% CI, 1.83 to 3.59), and 3.35 (95% CI, 1.52 to 7.29; P<0.001) for NAFLD grades I to III, respectively, and those calculated using the FRS were 1.65 (95% CI, 1.45 to
% %
6 5 4 3 2 1
0 Grade 0
P<0.01 with one-way ANOVA test
Grade I Grade II Grade III 2.59
3.93
4.68
5.23
a
a
A
8 7 6 5 4 3 2 1
0 Grade 0
P<0.01 with one-way ANOVA test
Grade I Grade II Grade III 4.55
6.39
7.33 7.13
b a
a, b
B Fig. 1. Comparison of 10-year cardiovascular disease risk estimated by (A) Pooled Cohort Equation and (B) Framingham risk score ac- cording to the severity of non-alcoholic fatty liver disease. ANOVA, analysis of variance. a,bSame superscript letters denote no significant differences in post hoc analyses.
Table 2. Correlation of PCE and FRS with Various Parameters
Variable PCE risk FRS risk
r value P value r value P value
Age 0.537 <0.01 0.383 <0.01
SBP 0.308 <0.01 0.330 <0.01
FBS 0.319 <0.01 0.310 <0.01
AST 0.115 <0.01 0.137 <0.01
ALT 0.140 <0.01 0.196 <0.01
TC 0.167 <0.01 0.257 <0.01
TG 0.317 <0.01 0.323 <0.01
HDL-C –0.307 <0.01 –0.440 <0.01
LDL-C 0.181 <0.01 0.337 <0.01
BMI 0.217 <0.01 0.281 <0.01
WC 0.279 <0.01 0.349 <0.01
PCE 1 - 0.826 <0.01
FRS 0.826 <0.01 1 -
PCE, Pooled Cohort Equation; FRS, Framingham risk score; SBP, systolic blood pressure; FBS, fasting blood sugar; AST, aspartate ami- notransferase; ALT, alanine aminotransferase; TC, total cholesterol;
TG, triglyceride; HDL-C, high density lipoprotein cholesterol; LDL- C, low density lipoprotein cholesterol; BMI, body mass index; WC, waist circumference.
1.86), 1.62 (95% CI, 1.30 to 2.02), and 1.72 (95% CI, 0.93 to 3.17;
P<0.001) with NAFLD grades I to III, respectively (Table 3).
DISCUSSION
In this study, we found that NAFLD severity was significantly positively correlated with 10-year CVD risk. More specifically, 10-year CVD risk estimated using the PCE increased more with higher NAFLD grade than when estimated using the FRS.
In univariate logistic regression analyses, more severe NAFLD showed numerically increasing adjusted ORs for 10-year CVD estimated by PCE compared with the FRS. These results indi- cated that NAFLD severity was an independent factor for in- creased estimated CVD risk.
FRS is a sex-specific coronary heart disease prediction tool that was developed based on data from the Framingham Heart Study, which estimated the 10-year risk of coronary heart dis- ease [13]. The Adult Treatment Panel (ATP) III guidelines rec- ommend the use of the FRS. This score includes the following risk factors: age, sex, total cholesterol, HDL-C, blood pressure, smoking and the use of antihypertensive medication [18]. The FRS has several limitations; it can overestimate or underesti- mate risk in understudied populations such as other whites, blacks, Asians, and Hispanics [19,20]. In addition, it does not predict the risk for stroke, transient ischemic attack or heart failure. Based on this, in 2013, the ACC/AHA Task Force re- leased a new report on the treatment of blood cholesterol, sug- gesting the four groups with benefit of statin treatment and re- moving the specific target levels for blood cholesterol for the reduction of CVD from the guideline. This guideline recom- mended a new risk assessment tool to assess 10-year ASCVD risk named the PCE, which uses age, sex, race, total cholester-
ol, HDL-C, systolic blood pressure, treatment for high hyper- tension, diabetes, and smoking as risk factors [10].
There have been several studies assessing the association be- tween NAFLD and 10-year CVD risk. In 2006, Ioannou et al.
[21] noted that elevated ALT activity in NAFLD was associat- ed with a high risk of CHD, as determined by the FRS. In 2009, Choi et al. [22] reported that individuals with NAFLD had an elevated 10-year risk of developing CHD, as estimated using the FRS. At the same time, a large cohort study by Sung et al. [23] found that the severity of NAFLD was associated with an increased CVD risk of >10% as estimated by the FRS.
In 2010, a study by Chiang et al. [8] reported that the severity of NAFLD was correlated with increased FRS, especially among elderly participants and those with increased baseline C-reactive protein. Previous studies that described the associa- tion between NAFLD and 10-year CVD risk used only the FRS according to the The Adult Treatment Panel (ATP)-III guideline.
Of particular importance, our study found that severity of NAFLD was associated with 10-year CVD as estimated by the newly recommended guideline calculator rather than by the ATP-III guideline calculator. The OR adjusted for age, sex, BMI, hypertension, diabetes, dyslipidemia, and metabolic syn- drome increased with increasing severity of NAFLD. In partic- ular, the ≥7.5% estimated CVD risk calculated based on the PCE showed a numerically increasing adjusted OR. The asso- ciation between the severity of NAFLD and 10-year CVD was better reflected when calculated using the PCE.
These findings are likely a result of the difference in risk fac- tors considered between the PCE and the FRS. The FRS had a limitation in that it was tested on a predominantly white popu- lation, with limited data regarding other ethnic groups. In con- Table 3. Odds Ratios for ≥7.5% Estimated Cardiovascular Disease Risk according to Non-Alcoholic Fatty Liver Disease Severity
Variable
PCE FRS
Crude OR Multivariable OR (95% CI)
Crude OR Multivariable OR (95% CI)
Model 1a Model 2b Model 1a Model 2b
Grade 0 1.00 (ref) 1.00 (ref) 1.00 (ref) 1.00 (ref) 1.00 (ref) 1.00 (ref)
Grade I 2.02 (1.80–2.27) 1.89 (1.63–2.20) 1.52 (1.24–1.86) 2.41 (2.21–2.63) 1.91 (1.72–2.13) 1.65 (1.45–1.86) Grade II 3.24 (2.71–3.88) 3.71 (2.92–4.71) 2.56 (1.83–3.59) 3.3 (2.85–3.82) 2.46 (2.06–2.94) 1.62 (1.30–2.02) Grade III 4.02 (2.33–6.92) 3.57 (1.90–6.71) 3.35 (1.52–7.39) 4.36 (2.74–6.93) 2.66 (1.60–4.41) 1.72 (0.93–3.17)
P for trend <0.01 <0.01 <0.01 <0.01 <0.01 <0.01
PCE, Pooled Cohort Equation; FRS, Framingham risk score; OR, odds ratio; CI, confidence interval.
aModel 1: adjusted for age, sex, and body mass index; bModel 2: adjusted for model 1 plus hypertension, diabetes, medication for dyslipidemia, pres- ence of metabolic syndrome, and smoking.
trast, our study population included only healthy Koreans, and the PCE includes race as a risk factor when evaluating for 10- year CVD risk. In addition, NAFLD is known to be associated with insulin resistance and metabolic syndrome [24,25]. Based on these results, the association between NAFLD and 10-year CVD risk is influenced by the presence or absence of diabetes.
These differences among risk factors may have contributed to our observation that the severity of NAFLD is significantly correlated with increasing 10-year CVD when estimated using the PCE.
Our study has several limitations. NAFLD was defined as fatty liver without chronic liver disease, such as liver cirrhosis or hepatocellular carcinoma. However, our study population was not evaluated for viral markers, such as the hepatitis B vi- rus or hepatitis C virus. In addition, because our study popula- tion included active participants in the medical checkup pro- gram, the number of participants with NAFLD grade III was relatively small (n=78).
In conclusion, more severe NAFLD is associated with great- er 10-year CVD risk as estimated using the PCE. Increased NAFLD severity showed a numerically increasing adjusted OR for 10-year CVD as estimated using the PCE compared with that calculated using the FRS. These findings suggest that NAFLD severity was an independent factor for ≥7.5% esti- mated CVD risk and that the PCE calculation may be appropri- ate when assessing 10-year CVD risk among individuals with NAFLD.
CONFLICTS OF INTEREST
No potential conflict of interest relevant to this article was re- ported.
ORCID
Eun-Jung Rhee http://orcid.org/0000-0002-6108-7758
REFERENCES
1. Angulo P. Nonalcoholic fatty liver disease. N Engl J Med 2002;346:1221-31.
2. Bedogni G, Miglioli L, Masutti F, Tiribelli C, Marchesini G, Bellentani S. Prevalence of and risk factors for nonalcohol- ic fatty liver disease: the Dionysos nutrition and liver study.
Hepatology 2005;42:44-52.
3. Browning JD, Szczepaniak LS, Dobbins R, Nuremberg P,
Horton JD, Cohen JC, et al. Prevalence of hepatic steatosis in an urban population in the United States: impact of eth- nicity. Hepatology 2004;40:1387-95.
4. Clark JM, Diehl AM. Hepatic steatosis and type 2 diabetes mellitus. Curr Diab Rep 2002;2:210-5.
5. Fan JG, Zhu J, Li XJ, Chen L, Li L, Dai F, et al. Prevalence of and risk factors for fatty liver in a general population of Shanghai, China. J Hepatol 2005;43:508-14.
6. Flegal KM, Carroll MD, Kit BK, Ogden CL. Prevalence of obesity and trends in the distribution of body mass index among US adults, 1999-2010. JAMA 2012;307:491-7.
7. Vernon G, Baranova A, Younossi ZM. Systematic review:
the epidemiology and natural history of non-alcoholic fatty liver disease and non-alcoholic steatohepatitis in adults. Al- iment Pharmacol Ther 2011;34:274-85.
8. Chiang CH, Huang CC, Chan WL, Chen JW, Leu HB. The severity of non-alcoholic fatty liver disease correlates with high sensitivity C-reactive protein value and is indepen- dently associated with increased cardiovascular risk in healthy population. Clin Biochem 2010;43:1399-404.
9. Hamaguchi M, Kojima T, Takeda N, Nakagawa T, Taniguchi H, Fujii K, et al. The metabolic syndrome as a predictor of nonal- coholic fatty liver disease. Ann Intern Med 2005;143:722-8.
10. Stone NJ, Robinson JG, Lichtenstein AH, Bairey Merz CN, Blum CB, Eckel RH, et al. 2013 ACC/AHA guideline on the treatment of blood cholesterol to reduce atherosclerotic car- diovascular risk in adults: a report of the American College of Cardiology/American Heart Association Task Force on Prac- tice Guidelines. J Am Coll Cardiol 2014;63(25 Pt B):2889- 934.
11. Kannel WB, McGee D, Gordon T. A general cardiovascular risk profile: the Framingham Study. Am J Cardiol 1976;38:46- 51.
12. Berger JS, Jordan CO, Lloyd-Jones D, Blumenthal RS.
Screening for cardiovascular risk in asymptomatic patients.
J Am Coll Cardiol 2010;55:1169-77.
13. D’Agostino RB Sr, Grundy S, Sullivan LM, Wilson P;
CHD Risk Prediction Group. Validation of the Framingham coronary heart disease prediction scores: results of a multi- ple ethnic groups investigation. JAMA 2001;286:180-7.
14. Standards of medical care in diabetes 2015: summary of re- visions. Diabetes Care 2015;38 Suppl:S4.
15. Alberti KG, Eckel RH, Grundy SM, Zimmet PZ, Cleeman JI, Donato KA, et al. Harmonizing the metabolic syndrome:
a joint interim statement of the International Diabetes Fed- eration Task Force on Epidemiology and Prevention; Na-
tional Heart, Lung, and Blood Institute; American Heart Association; World Heart Federation; International Athero- sclerosis Society; and International Association for the Study of Obesity. Circulation 2009;120:1640-5.
16. Saadeh S, Younossi ZM, Remer EM, Gramlich T, Ong JP, Hurley M, et al. The utility of radiological imaging in nonal- coholic fatty liver disease. Gastroenterology 2002;123:745- 50.
17. Singh D, Das CJ, Baruah MP. Imaging of nonalcoholic fat- ty liver disease: a road less travelled. Indian J Endocrinol Metab 2013;17:990-5.
18. Expert Panel on Detection, Evaluation, and Treatment of High Blood Cholesterol in Adults. Executive summary of the third report of The National Cholesterol Education Pro- gram (NCEP) Expert Panel on Detection, Evaluation, and Treatment of High Blood Cholesterol in Adults (Adult Treatment Panel III). JAMA 2001;285:2486-97.
19. Brindle P, Emberson J, Lampe F, Walker M, Whincup P, Fahey T, et al. Predictive accuracy of the Framingham cor- onary risk score in British men: prospective cohort study.
BMJ 2003;327:1267.
20. Liu J, Hong Y, D’Agostino RB Sr, Wu Z, Wang W, Sun J, et al. Predictive value for the Chinese population of the Fram-
ingham CHD risk assessment tool compared with the Chi- nese Multi-Provincial Cohort Study. JAMA 2004;291:2591- 9.
21. Ioannou GN, Weiss NS, Boyko EJ, Mozaffarian D, Lee SP.
Elevated serum alanine aminotransferase activity and cal- culated risk of coronary heart disease in the United States.
Hepatology 2006;43:1145-51.
22. Choi SY, Kim D, Kim HJ, Kang JH, Chung SJ, Park MJ, et al. The relation between non-alcoholic fatty liver disease and the risk of coronary heart disease in Koreans. Am J Gastroenterol 2009;104:1953-60.
23. Sung KC, Ryan MC, Wilson AM. The severity of nonalco- holic fatty liver disease is associated with increased cardio- vascular risk in a large cohort of non-obese Asian subjects.
Atherosclerosis 2009;203:581-6.
24. Cankurtaran M, Tayfur O, Yavuz BB, Geyik S, Akhan O, Ar- slan S. Insulin resistance and metabolic syndrome in patients with NAFLD but without diabetes: effect of a 6 month re- gime intervention. Acta Gastroenterol Belg 2007;70:253-9.
25. Rector RS, Thyfault JP, Wei Y, Ibdah JA. Non-alcoholic fatty liver disease and the metabolic syndrome: an update.
World J Gastroenterol 2008;14:185-92.