ORIGINAL ARTICLE
수위변화에 따른 하상재료의 분광특성정보 분석
An Analysis of Spectral Characteristic Information on the Water Level Changes and Bed Materials
강준구1ㆍ이창훈2ㆍ김지현3ㆍ고동우4ㆍ김종태5*
1한국건설기술연구원 국토보전연구본부 연구위원, 2주식회사 자연과기술 연구원, 3한국건설기술연구원 국토보전연구본부 연구원,
4주식회사 자연과기술 책임연구원, 5주식회사 자연과기술 연구소장
Joongu Kang1, Changhun Lee2, Jihyun Kim3, Dongwoo Ko4 and Jongtae Kim5*
1Research Fellow, Department of Land, Water and Environment Research, Korea Institute of Civil Engineering and Building Technology, Goyang 10223, Korea
2Researcher, Nature and Technology Inc., Yecheon 36849, Korea
3Researcher, Department of Land, Water and Environment Research, Korea Institute of Civil Engineering and Building Technology, Goyang 10223, Korea
4Head Researcher, Nature and Technology Inc., Yecheon 36849, Korea
5Director, Nature and Technology Inc., Yecheon 36849, Korea
Received 14 November 2019, revised 25 November 2019, accepted 26 November 2019, published online 31 December 2019
ABSTRACT: The purpose of this study is to analyze the reflectance of bed materials according to changes in the water level using a drone-based hyperspectral sensor. For this purpose, we took hyperspectral images of bed materials such as soil, gravel, cobble, reed, and vegetation to compare and analyze the spectral data of each material. To adjust the water level, we constructed an experimental channel to control the discharge and installed the bed materials within the channel. In this study, we configured 3 cases according to the water level (0.0 m, 0.3 m, 0.6 m). After the imaging process, we used the mean value of 10 points for each bed material as analytical data. According to the analysis, each material showed a similar reflectance by wavelength and the intrinsic reflectance characteristics of each material were shown in the visible and near-infrared region. Also, the deeper the water level, the lower the peak reflectance in the visible and near-infrared region, and the rate of decrease differed depending on the bed material. We expect the intrinsic properties of these bed materials to be used as basic research data to evaluate river environments in the future.
KEYWORDS: Bed material, Hyperspectral sensor, Reflectance, Visible region, Water level
요 약: 본 연구는 드론 기반의 초분광 센서를 활용하여 수위변화에 대한 하상재료의 분광정보 차이를 분석하는 것이 목적이다.
하상재료는 흙, 자갈, 호박돌, 갈대, 식생을 대상으로 하였으며 5개 하상재료에 대한 초분광 영상촬영을 실시하고 각 재료의 분광정보를 비교 분석하였다. 수위 변화를 위해 유량조절이 가능한 실험수로를 제작하고 수로 내 하상재료를 설치하였다. 수위 조건은 0.0 m, 0.3 m, 0.6 m이며 수위에 따라 CASE를 구분하였다. 영상촬영 후 각 하상재료별 10개 포인트를 평균한 값을 분석 자료로 사용하였다. 분석 결과 흙, 자갈, 호박돌, 갈대의 파장별 반사율은 비슷한 유형을 보이지만 각 재료별 가시광선과 근적외선 영역에서는 분광정보의 고유특징이 나타났다. 또한 수위가 깊어질수록 가시광선과 근적외선 영역에서 반사율은 감소하고 있으며 감소 비율은 하상재료에 따라 차이가 발생하였다. 하상재료에 대한 고유정보는 향후 하천환경평가를 위한 기초연구 자료로 활용될 것으로 기대된다.
핵심어: 하상재료, 초분광 센서, 반사율, 가시광선, 수위
*Corresponding author: [email protected], ORCID 0000-0003-0865-479X
ⓒ Korean Society of Ecology and Infrastructure Engineering. All rights reserved.
This is an open-access article distributed under the terms of the Creative Commons Attribution Non-Commercial License (http://creativecommons.org/licenses/by-nc/3.0/), which permits unrestricted non-commercial use, distribution, and reproduction in any medium, provided the original work is properly cited.
243
1. 서 론
광역적인 하천환경 인자의 정확한 측정을 위해 원격 탐사 (Remote Sensing) 기법이 다수 활용되고 있다. 특 히 위성과 항공 영상을 이용한 기술이 광범위한 지역의 정보 수집과 활용에 적용되고 있다. 그러나 하천환경평 가를 위한 하상재료 분석방법은 하천수심, 재료의 종류 등을 고려한 후 분석이 수행되어야 하므로 접근방법이 어려운 현실이다. 또한 위성에 탑재되었던 다중분광 센 서에서 공간해상도를 1 m 내외까지 향상시킨 상업용 고해상도 센서까지 발전되었으나, 다중분광영상 (multi- spectral image)은 주로 10여개 미만의 한정된 파장에 서 대상물에 대한 분광특성 정보를 표현하는 데에는 한 계가 있다. 따라서 본 연구에서는 드론 기반의 초분광 영상을 활용하여 수위변화에 대한 하상재료의 분광정 보 특성을 비교하였다.
초분광 영상은 일반 카메라와 달리 가시광선 영역 (400 – 780 nm)과 근적외선 영역 (781 – 1000 nm) 파장 대를 수 백개로 세분화하여 촬영함으로써 일반 사람의 눈으로 보는 것보다 훨씬 다양한 스펙트럼의 빛을 감지 할 수 있다 (Asner et al. 2003, Gao et al. 2004). 이로 인 해 초기에는 군사용이나 농업용으로 활용이 되었으며 2000년대 이후 수질이나 특정 식생의 성장상태 평가 등 을 목적으로 연구가 수행되고 있지만 하천 관리 및 하상 재료 분석을 위한 연구는 아직 부족하다 (Park et al. 2014, Stratoulias et al. 2015).
국내에서는 하천 수심을 예측하기 위해 초분광 영상 정보와 실측 수심 데이터의 관계 분석에 대한 연구가 수 행되었으며 초분광 영상의 강도값이 증가할수록 수심 은 감소하는 것으로 나타났다 (Kang et al. 2019). 또한 초분광 영상의 노이즈로 인한 영향을 줄이고 감독분류 기법을 적용하여 하천환경 특성에 따른 공간분류도 수 행되었으며 항공기 탑재용 초분광 카메라를 이용하여 연안지역의 토지 피복분류를 실시하고 분광해상도에 따라 아스팔트와 콘크리트 도로의 구분 가능성에 대한 연구결과도 있었다 (Cho and Lee 2014, Kim et al.
2018, Lee et al. 2018). Han et al. (2003)은 초분광 영상 을 이용하여 밴드 추출방식을 알아보고, 분류영상에 대 한 정확도를 평가하여 효용성을 검증하였으며 초분광 원격탐사 기법을 이용하여 선박 접근이 어려운 연안지 역의 수심을 산정한 연구도 수행되었다 (Yu et al. 2008).
또한 Jang et al. (2013)은 다양한 연구 분야에 적용할 수
있는 테스트베드의 구축 방법 및 효용성에 대한 기초 연 구를 수행하였으며 초분광 영상 처리를 위한 대리보정 및 효용성에 대해 분석하였다.
국외에서는 1970년대부터 미국 항공우주국 (NASA) 에서 초분광 영상 센서 (hyperspectral imaging sensor) 개발이 시작되었으나 초분광 영상을 이용하여 연구한 사례는 다중분광센서 보다 많지 않다. 그러나 새로운 데이터베이스의 확보가 쉽고 영상관련 기술이 발달하 면서 해석 방법도 다양해졌다. Koponen et al. (2002)은 초분광 영상을 통해 탁도, 엽록소, 수질 등의 분류 및 분 석에 대하여 연구하였으며 Song et al. (2012)는 초분광 영상을 이용한 수질항목의 농도 분석과 효율적인 측정 방법을 제시하고 또한 최적화된 분광정보 분석을 통해 초분광 원격탐사의 가능성을 평가하였다. 특히 드론 기 반의 초분광 영상 취득이 가능해지면서 토지, 수질, 농 업, 국방 분야에 정밀연구가 수행되었으며 높은 분광해 상도를 가지는 초분광 영상을 획득할 수 있게 되었다 (Smith et al. 2002, Herold et al. 2004, Goetz 2009, Kokaly et al. 2009, Pignatti et al. 2009, Long et al.
2019, Myers et al. 2019).
그러나 초분광 영상을 이용한 연구는 현재까지 특정 분야에 집중되어 있으며 하천에서 활용 가능성 및 영상 분석에 대한 정량적 연구는 부족하다. 따라서 본 연구 에서는 실험 수로에 5개 하상재료를 설치하고 초분광 영상을 촬영하였으며 분광복사량을 획득하고 반사특 성을 계산하여 재료별로 비교하였다. 또한 수위가 증가 할 때 반사율 변화를 분석하여 향후 하천조사를 위한 초 분광 영상의 활용가능성에 대해 평가하였다.
2. 연구 방법
2.1 연구 개요
하천환경 평가를 위한 원격탐사는 광범위한 지역에 대한 정보 수집과 활용에 적용이 가능하다. 특히 초분 광 영상은 육안으로 관찰이 불가능한 다양한 하상재료 에 대한 자료를 확보할 수 있으며 드론 탑재가 가능해지 면서 활용 영역이 넓어 수위 변화에 대한 하상재료의 정 확한 구별이 가능할 것으로 판단된다. 영상자료 획득의 경우 대기에 의한 흡수, 반사 등의 영향을 받기 때문에 보정이 필요하다. 그러나 현장에서 초분광 센서를 이용 하여 하상재료에 대한 분광정보를 분석할 경우에는 대
기에서 발생하는 복사휘도나 재료에서 반사되는 에너 지가 대기의 영향을 거의 받지 않기 때문에 본 연구에서 는 대기보정을 고려하지 않았다. 특히 본 연구에서는 실험수로 대차를 이용하여 지상에서 근접 촬영하였으 므로 드론의 흔들림과 대기의 영향을 거의 받지 않았기 때문에 기하보정과 대기보정을 고려하지 않았다.
2.2 연구 방법
본 연구는 하상재료의 분광정보를 분석하는 것이 목 적으로써 유량조절이 가능한 실험수로에서 수위 차이 에 따라 5개 하상재료 (흙, 자갈, 호박돌, 갈대, 식생)의 초분광 영상촬영을 실시하고 가시광선과 근적외선 영 역의 분석 결과를 비교하였다. 하상재료의 분광정보를 분석하는 것이 목적이므로 하상재료의 크기는 측정하 지 않았으며 식생은 다년생 수생식물인 워터코인 (Water pennywort)을 활용하였다. 초분광 센서는 미국 Headwall Photonics사의 Nano-Hyperspec을 사용하였다. 또한 영상촬영을 위한 무인항공기는 독일 Aibotix의 Aibot X6 드론을 사용하였으며 영상분석은 Harris Geospatial Solutions사의 ENVI 5.5버전을 사용하였다. 영상분석 은 각 재료별로 10개 포인트를 평균한 값을 사용하였으 며 분광특성 정보인 강도값 (Data Value)과 반사율 (Reflectance)을 계산하였다. 또한 전자파에너지는 계 절별, 시간대별 태양복사에너지에 의해 달라지기 때문
에 99%의 반사특성을 갖는 백색판을 이용하여 태양복 사에너지의 변화에서 발생할 수 있는 오차를 최소화 하 고 반사율로 변환시켰다.
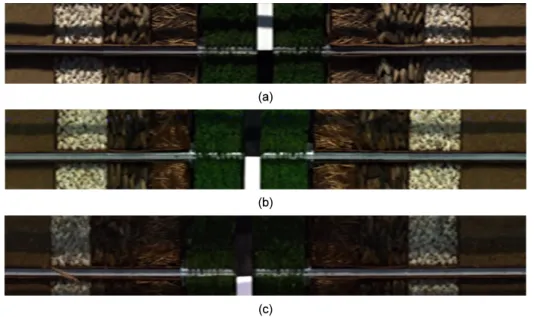
강도값은 분광복사량 (radiance) 값을 말하며, 최대 반사율값은 파장영역 (400 – 1000 nm) 범위에서 최대 로 크게 측정된 반사율을 의미한다. 백색판은 하상재료 와 같이 설치하였으며 수위 조건은 0.0 m, 0.3 m, 0.6 m 이며 수위에 따라 CASE를 구분하였다. Fig. 1은 각 CASE에 대한 백색판 위치 및 초분광 영상촬영 결과를 나타낸다.
3. 연구 내용 및 결과
3.1 CASE 1에 대한 분석 결과
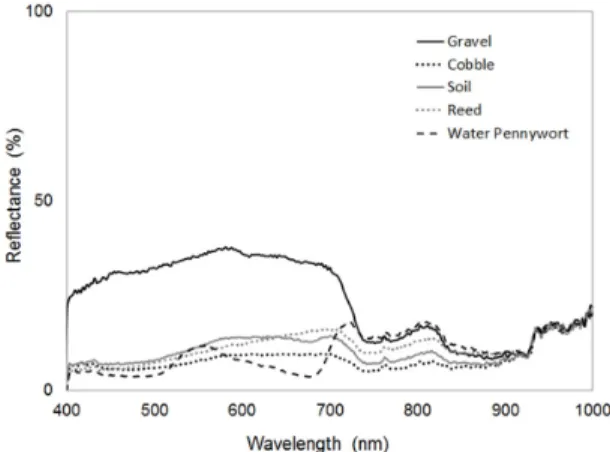
CASE 1은 수위가 0.0 m 조건으로써 가시광선과 근 적외선 영역의 반사율 및 파장을 분석하였다. Fig. 2는 5개 하상재료에 대한 파장별 반사율 값을 나타낸 그래 프이며 Table 1은 가시광선과 근적외선 영역의 최대 반 사율과 파장을 나타낸 표이다. 그래프 유형은 재료별 비슷하지만 반사율 차이가 있었으며 특히 식생의 경우 반사율이 낮고 500 nm – 600 nm에서 변화가 확인되었 다. 식생의 경우 엽록소가 파랑색과 빨강색의 파장대를 흡수하고 녹색과 근적외선 파장대를 반사하는 분광학 적 특성을 가지기 때문으로 판단된다. 식생은 가시광선
(a)
(b)
(c)
Fig. 1. Results on the hyperspectral imagery (a) CASE 1 (b) CASE 2 (c) CASE 3.
에서 가장 낮은 반사율을 보이지만 근적외선 영역에서 는 두 번째로 높은 값을 보이고 있다. CASE 1에 대한 분석 결과 흙의 최대 반사율은 근적외선 영역의 57.6%, 자갈의 최대 반사율은 가시광선 영역의 80.5%, 호박돌 의 최대 반사율은 근적외선 영역의 56.9%, 갈대의 최대 반사율은 근적외선 영역의 61.0%, 식생의 최대 반사율 은 근적외선 영역의 69.3%으로 나타났다. 재료별 가시 광선의 최대 반사율이 나타낸 파장의 범위는 764.7 nm – 780.0 nm이며 근적외선의 최대 반사율이 나타난 파장 은 789.2 nm – 999.3 nm로 나타났다.
3.2 CASE 2에 대한 분석결과
CASE 2는 수위가 0.3 m 조건으로써 가시광선과 근 적외선 영역의 반사율 및 파장을 분석하였다. Fig. 3은 5개 하상재료에 대한 파장별 반사율 값을 나타낸 그래 프이며 Table 2는 CASE 2의 가시광선 및 근적외선 영 역의 최대 반사율과 파장을 나타낸 표이다. 그래프 유 형에 대한 분석결과 수위 증가로 인해 CASE 1보다 반 사율이 전반적으로 감소하는 경향을 보이고 있으며 자 갈의 최대 반사율은 37.9%로써 가장 높게 나타났다. 흙
Fig. 2. Graph on the reflectance and wavelength of bed materials (CASE 1).
Fig. 3. Graph on the reflectance and wavelength of bed materials (CASE 2).
Table 1. Peak reflectance and wavelength on CASE 1
CA SE
Region
Bed materials
Soil Gravel Cobble Reed Water pennywort
Peak reflect- ance(%)
Wave length
(nm)
Peak reflect- ance(%)
Wave length
(nm)
Peak reflect- ance(%)
Wave length
(nm)
Peak reflect- ance(%)
Wave length
(nm)
Peak reflect- ance(%)
Wave length
(nm) 1
Visible 46.2 764.7 80.5 766.9 49.1 764.7 42.0 780.0 66.4 775.8
Near
infrared 57.6 994.8 79.6 789.2 56.9 999.3 61.0 992.6 69.3 950.1
Table 2. Peak reflectance and wavelength on CASE 2
CA SE
Region
Bed materials
Soil Gravel Cobble Reed Water pennywort
Peak reflect- ance(%)
Wave length
(nm)
Peak reflect- ance(%)
Wave length
(nm)
Peak reflect- ance(%)
Wave length
(nm)
Peak reflect- ance(%)
Wave length
(nm)
Peak reflect- ance(%)
Wave length
(nm) 2
Visible 14.4 699.9 37.9 581.4 9.8 686.5 16.3 695.4 18.0 722.2
Near
infrared 21.2 997.0 22.4 997.0 20.9 999.2 22.2 999.2 20.3 999.2
의 최대 반사율은 근적외선 영역의 21.2%, 자갈의 최대 반사율은 가시광선 영역의 37.9%, 호박돌의 최대 반사 율은 근적외선 영역의 20.9%, 갈대의 최대 반사율은 근 적외선 영역의 22.2%, 식생의 최대 반사율은 근적외선 영역의 20.3%으로 나타났다. 재료별 가시광선의 최대 반사율이 나타난 파장의 범위는 581.4 nm – 722.2 nm 이며 근적외선의 최대 반사율이 나타난 파장의 범위는 997.0 nm – 999.2 nm로 매우 유사하게 나타났다.
3.3 CASE 3에 대한 분석결과
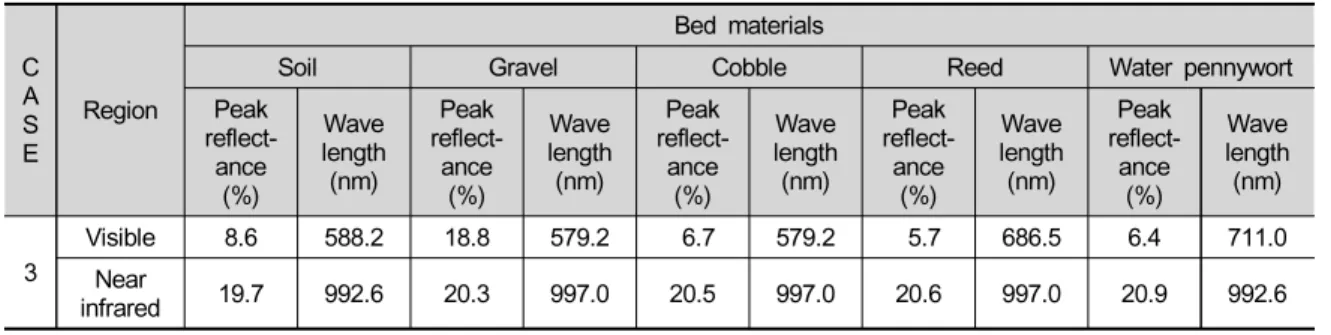
CASE 3은 수위가 0.6 m 조건으로써 가시광선과 근 적외선 영역의 반사율 및 파장을 분석하였다. Fig. 4는 5개 하상재료에 대한 파장별 반사율을 나타낸 그래프 이며 Table 3은 가시광선과 근적외선 영역의 최대 반사 율과 파장을 나타낸 표이다. 그래프 유형에 대한 분석 결과 수위의 영향으로 CASE 1과 CASE 2에 비해 반사
율이 전반적으로 감소하는 경향을 보이고 있으며 5개 하상재료 중 자갈의 반사율이 가장 높게 나타났다.
CASE 3에 대한 분석 결과 흙의 최대 반사율은 근적외 선 영역의 19.7%, 자갈의 최대 반사율은 근적외선 영역 의 20.3%, 호박돌의 최대 반사율은 근적외선 영역의 20.5%, 갈대의 최대 반사율은 근적외선 영역의 20.6%, 식생의 최대 반사율은 근적외선 영역의 20.9%로 나타 났다. 재료별 가시광선의 최대 반사율이 나타낸 파장의 범위는 579.2 nm – 711.0 nm이며 근적외선의 최대 반 사율이 나타난 파장의 범위는 992.6 nm – 997.0 nm로 나타났다. 자갈을 제외하면 수위로 인해 하상재료의 분 광정보 구분이 어려운 것으로 나타났다.
3.4 재료별 반사율 비교 분석
본 연구에서는 하상재료별 수위변화에 따른 반사율 을 비교하였다. Table 4는 Case 1의 값을 기준으로 최 대 반사율이 CASE에 따라 감소하는 비율을 나타낸 표 이며 Fig. 5와 Fig. 6은 가시광선과 근적외선의 최대 반 사율의 감소 정도를 나타낸 그래프이다. 분석결과 수위 가 증가할수록 수체의 분광특성으로 인해 하상재료 고 유의 분광특성이 사라지는 것으로 나타났다. 특히 가시 광선에서 식생의 최대 반사율은 CASE 1에 비해 9.64%
수준으로 감소율이 가장 높게 나타났다. 이는 식생이 흙, 자갈 등의 하상재료보다 수체의 분광특성 영향을 더 받는 것을 의미한다. 자갈의 경우 근적외선 영역에 서 반사율이 CASE 1에 비해 25.50% 수준으로 가장 낮 지만 가시광선에서는 가장 높은 반사율을 보였다. 또한 근적외선 영역의 경우 수위가 0.3 m 증가 시 (CASE 2) 반사율은 감소하지만 0.6 m 증가 시에는 변화가 거의 없는 것으로 나타났다.
Table 3. Peak reflectance and wavelength on CASE 3
CA SE
Region
Bed materials
Soil Gravel Cobble Reed Water pennywort
Peak reflect- ance(%)
Wave length
(nm)
Peak reflect- ance(%)
Wave length
(nm)
Peak reflect- ance(%)
Wave length
(nm)
Peak reflect- ance(%)
Wave length
(nm)
Peak reflect- ance(%)
Wave length
(nm) 3
Visible 8.6 588.2 18.8 579.2 6.7 579.2 5.7 686.5 6.4 711.0
Near
infrared 19.7 992.6 20.3 997.0 20.5 997.0 20.6 997.0 20.9 992.6
Fig. 4. Graph on the reflectance and wavelength of bed materials (CASE 3).
4. 결론 및 제언
본 연구에서는 하상재료들을 대상으로 초분광 영상 촬영을 실시하고 각 재료의 분광복사량을 획득하였다.
또한 백색판과 비교하여 반사율을 계산하고 하상재료 별 수위 증가에 따른 상관관계를 비교하였다. 영상 분 석결과 수위에 관계없이 자갈의 반사율이 가장 높게 나 타났다. 또한 하상재료와 초분광 센서 사이의 수체로 인해 하상재료의 분광특성이 수체의 분광특성으로 전 환되는 경향이 나타났다. 특히 식생의 경우 녹색과 근 적외선 파장대를 반사하는 분광학적 특성을 가지기 때 문에 분광정보의 변화가 나타났다. 자갈은 가시광선에 서 수위의 영향을 가장 적게 받는 것으로 나타났으나 근 적외선에서는 영향을 가장 많이 받는 것으로 나타났다.
하상재료별 가시광선과 근적외선 영역에서 분광정보 의 고유특징이 나타났기 때문에 향후 이 결과는 하천환 경평가를 위한 기초연구 자료로 활용될 수 있을 것으로 기대된다. 또한 식생은 가시광선에서 반사율은 낮으나 근적외선 영역에서는 높은 반사율을 보이고 있으며 자
갈은 가시광선과 근적외선에서 수위에 따라 감소율 차 이가 크기 때문에 이를 활용한 연구가 추가로 필요할 것 으로 판단된다.
감사의 글
본 연구는 국토교통부/국토교통과학기술진흥원 지 원 (과제번호 19AWMP-B121100-04)으로 수행되었 습니다.
References
Asner, G.P., Bustamante, M.M. and Townsend, A.R. 2003.
Scale dependence of biophysical structure in deforested areas bordering the Tapaos National Forest, Central Amazon. Remote Sensing of Environment 87: 507-520.
Cho, H.G. and Lee, K.S. 2014. Comparison between Hyperspectral and Multispectral Images for the Class- ification of Coniferous Species. Korean Journal of Remote Sensing 30: 25-36. (in Korean)
Gao, B.C., Montes. M.J. and Davis, C.O. 2004. Refinement
Fig. 5. Decreasing rate of the peak reflectance on thevisible region.
Fig. 6. Decreasing rate of the peak reflectance on the near infrared region.
Table 4. Decreasing rate of the peak reflectance
Region CASE Soil
(%) Gravel
(%) Cobble
(%) Reed
(%) Water
Pennywort (%) Visible
1 100.00 100.00 100.00 100.00 100.00
2 31.17 47.08 19.96 38.81 27.11
3 18.61 23.35 13.65 13.57 9.64
Near infrared
1 100.00 100.00 100.00 100.00 100.00
2 36.81 28.14 36.73 36.39 29.29
3 34.20 25.50 36.03 33.77 30.16