Copyright © 2017 The Korean Society for Bone and Mineral Research
This is an Open Access article distributed under the terms of the Creative Commons Attribution Non-Commercial Li- cense (http://creativecommons.org/licenses/by-nc/4.0/) which permits unrestricted non-commercial use, distribu- tion, and reproduction in any medium, provided the original work is properly cited.
Association between Sarcopenic Obesity and
Metabolic Syndrome in Postmenopausal Women:
A Cross-sectional Study Based on the Korean National Health and Nutritional Examination Surveys from 2008 to 2011
Sun-Young Kang, Gyeong Eun Lim, Yang Keun Kim, Hye Won Kim, Kayoung Lee, Tae-Jin Park, Jinseung Kim Department of Family Medicine, Busan Paik Hospital, Inje University College of Medicine, Busan, Korea
Background: Menopause contributes to an increase in visceral fat mass and a decrease in muscle protein synthesis. Therefore, we performed this study to examine their rela- tionship how effect the changes of body composition as obesity and sarcopenia on met- abolic syndrome (MS) as a predictor of cardiovascular disease in postmenopausal wom- en. Methods: Using data from the Korean National Health and Nutrition Examination Survey (KNHANES) from 2008 to 2011, we estimated that 4,183 postmenopausal wom- en underwent dual energy X-ray absorptiometry scans. Sarcopenia was defined as an appendicular skeletal muscle mass divided by body weight that was less than 1 stan- dard deviation below the sex specific mean for the young reference group. After classifi- cation into four groups, the results were adjusted with menopausal age and hormonal treatment. The relationship between sarcopenic obesity (SO) and MS in postmenopausal women was analyzed by logistic regression analysis in a complex sampling. Results: In an unadjusted model, the odds ratio (OR) of MS for sarcopenia was 1.94 (95% confidence interval [CI], 1.52-2.49); the obesity group had an OR of 4.55 (95% CI, 3.63-5.71); and dis- tinctly, the SO group had an OR of 6.26 (95% CI, 5.10-7.70). Even though there was con- trolling for variable adjustment, no definite difference was seen in the results. Conclu- sions: Sarcopenia and obesity were associated with MS independent of other metabolic impairment risk factors in both early menopausal and postmenopausal women. The re- sults showed that, in particular, the prevalence of MS has increased more in postmeno- pausal women compared with previous research.
Key Words: Menopause, Metabolic syndrome X, Sarcopenia
INTRODUCTION
The prevalence of metabolic syndrome (MS) is increasing worldwide, and it can create a burden on national economies. In South Korea, MS has increased signifi- cantly from 23.6% in 1998 to 28.0% in 2001.[1] However, currently, it has trend to decrease to 18.8% according to a report of the Ministry of Health and Welfare in Korea.[2] Although there are a number of risk factors, such as age, obesity, smok- Corresponding author
Jinseung Kim
Department of Family Medicine, Busan Paik Hospital, Inje University College of Medicine, 75 Bokji-ro, Busanjin-gu, Busan 47392, Korea Tel: +82-51-890-6729
Fax: +82-51-894-7554 E-mail: [email protected],
[email protected] Received: November 3, 2016 Revised: January 18, 2017 Accepted: January 21, 2017
No potential conflict of interest relevant to this article was reported.
Original Article
pISSN 2287-6375 eISSN 2287-7029
ing, dietary habits, and exercise, that affect MS as a predic- tor of cardiovascular disease, low skeletal muscle mass re- lated to a high prevalence of cardiovascular disease emerged as a spotlighted factor among them.[3]
Menopause-related hormonal changes influence the re- distribution of body fat and the loss of muscle mass and strength, independently of aging.[4,5] Menopause is clini- cally defined as a cessation of menstruation entirely for 1 year, which is reported to occur, on average, in Korean wom- en in their fifties. Women generally tend to gain weight (Wt) due to sudden hormonal changes.[6]
Hence, low skeletal muscle mass and high fat mass may have a synergistic impact on both metabolic impairment and physical disability,[7] especially in postmenopausal women.
Given the scarcity of studies about the relationship be- tween sarcopenic obesity (SO) and MS in postmenopausal women, Lim et al.[8] suggested that SO was more closely associated with MS in women aged 65 or older. This was measured by dual energy X-ray absorptiometry (DXA) scans (Hologic Inc., Bedford, MA, USA). In contrast, Peppa et al.[9]
investigated the traditional belief that lean body mass with- out fat and bone mass is favor associated with cardiometa- bolic risk factors in healthy postmenopausal women. It was found that women with a high arm lean mass index (LMI) displayed a significantly higher prevalence of MS compared to women with a low arm LMI when the central fat distri- bution was taken into consideration. Therefore, emerging evidence has shown that the relationship between SO and MS in postmenopausal women clearly was yet to be estab- lished.
In the present study, according to the recent interest in health and various dietary behaviors in the elderly, we in- vestigated the prevalence of sarcopenia and SO in Korean women with the natural decline of estrogen during the menopausal period and its relevance to MS, and whether there are significant changes after controlling multiple vari- ables in postmenopausal women.
MEHTODS
1. Data collectionThe sampling units of the Korean National Health and Nutrition Examination Survey (KNHANES) were households selected through a complex, stratified, multistage, and pro-
bability-cluster design. It represents the entire Korean pop- ulation by a complex sampling analysis through sampling Wts. We analyzed postmenopausal women who underwent DXA scans from July 2008 to May 2011. The DXA scans were used to measure whole and regional body compositions.
Appendicular skeletal muscle mass (ASM) was calculated as the sum of skeletal muscle in the arms and legs measured by DXA scans, assuming that all non-fat and non-bone tis- sue was skeletal muscle. To determine cut-off point for sar- copenia, previous studies showed various formulae such as ASM/height2 and ASM/body mass index (BMI).[10,11]
We identified the sarcopenic group defined as an ASM di- vided by Wt (ASM/Wt) that was less than 1 standard devia- tion (SD) below the mean of the reference group (20-39 years), which was modified from the studies of Janssen et al.[12] and Baumgartner et al.[13] The cutoff point of BMI for obesity was greater than or equal to 25 kg/m2 on the basis of the Asian Pacific criterion. According to the above definitions of sarcopenia and obesity, our study categorized MS into four groups: normal, obesity, sarcopenia, and SO.
MS was diagnosed according to the criteria of the Ameri- can Heart Association, the National Heart, Lung, and Blood Institute, and the criteria of the International Diabetes Fed- eration.[14,15] This definition was fulfilled by the presence of at least three of the following five criteria: (1) waist cir- cumference as central obesity ≥90 cm in males or ≥85 cm in females; (2) serum triglyceride (TG) concentration ≥150 mg/dL (1.7 mmol/L); (3) serum high density lipoprotein cholesterol (HDL–C) concentration <40 mg/dL (1.03 mmol/
L) in males or <50 mg/dL (1.3 mmol/L) in females; (4) av- erage blood pressure ≥130/85 mmHg; and (5) fasting se- rum glucose ≥100 mg/dL (5.6 mmol/L).
The KNHANES protocols were approved by the Institu- tional Review Board of the Korean Center for Disease Con- trol and Prevention (IRB No. 2010–02CON–21–C, 2011–
02CON–06–C).
2. Statistical analysis
In this study, all probability samples were calculated tak- ing sampling Wts into account with the complex sample design of KNHANES to represent the total population of Korea. Categorical variables were used Pearson's chi-square test in complex sampling and were presented as percent- ages; continuous variables were used as descriptive statis- tics in complex sampling and expressed as mean and stan-
dard error. To work out the association between them and MS in postmenopausal women, we estimated the odds ra- tio (OR) of MS in the postmenopausal group by logistic re- gression analysis in complex sampling after adjusting for confounding factors to determine whether or not sarcope- nia and obesity could be independently associated with MS. Menopausal age, hormonal treatment, drinking status, smoking status, physical activity, chronic disease, and eco- nomic status were designated as confounding factors. All statistical data were analyzed using the IBM SPSS software version 22.0 (IBM Corp., Armonk, NY, USA). A P-value of less than 0.05 was regarded as statistically significant.
RESULTS
Among the 37,790 subjects who underwent the health examination and interview, the number of postmenopaus- al women was 7,431 (53.7%). After excluding 3,248 subjects for missing the adjustment values, the final 4,183 partici- pants were included in the study (Fig. 1). The characteris- tics of the young reference group as healthy women aged 20 to 39 years were presented with mean and SD (Table 1).
It indicated that the cutoff value for sarcopenia was 23.76%
as ASM/Wt (%).
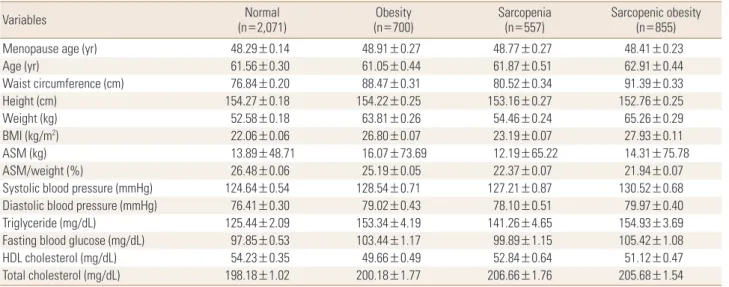
The normal population group was the most common with 2,071 (49.5%). In sequence, the SO group was 855 (20.4%), the obesity group was 700 (16.7%), and finally, the sarco- penia group was the lowest with 557 (13.3%). Mean ASM/
Wt (%) was lower in SO (21.94%) than in sarcopenia (22.37%)
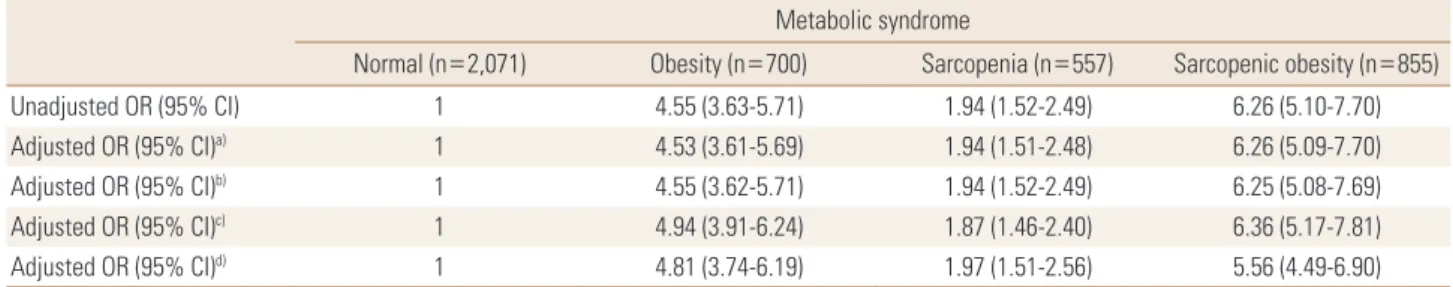
(Table 2). In the chronic disease category, the prevalence of hypertension was the largest overall. The prevalence of MS was 23.47% for the normal group, 33.75% for sarcope- nia, 58.71% for obesity, and 67.84% for SO (Table 3). The logistic regression analyses were used to determine the OR of MS for four groups of postmenopausal women control- ling for menopausal age, hormonal treatment, drinking status, smoking status, physical activity, chronic disease, and economic status (Table 4). In an unadjusted model, the sarcopenia group had an OR of 1.94 (95% confidence interval [CI] 1.52-2.49), and the obesity group had an OR of 4.55 (95% CI 3.63-5.71). Both groups had a higher risk of MS than the normal group. The SO group had an OR of 6.26 (95% CI 5.10-7.70), which was the highest risk category for MS. After adjusting for all variables, including chronic disease and economic status, the SO group had an OR of 5.56 (95%
Fig. 1. Flow chart of subjects selection. KNHNES, Korean National Health and Nutrition Examination Survey.
Subjects from 2008–2011 KNHANES (n=37,790)
n=37,753
Premenopause
n=6,410 Postmenopause
n=7,431
Final total number n=4,183
n=17,195Men Women
n=20,558
Excluded subjects with missing data for sex
(n=37)
Excluded subjects with missing data for menopause status
(n=6,717)
Excluded subjects with missing data for covariates
(n=3,248)
Table 1. Characteristics of the young reference group (healthy wom- en aged 20 to 39 years)
Variables Young reference women group
(n=3,320)
Age (yr) 31.18±5.60
Waist circumference (cm) 56.69±9.54
Height (cm) 160.41±5.47
Weight (kg) 73.62±9.22
BMI (kg/m2) 22.03±3.51
ASM/weight (%) 26.22±2.46
Cutoff value for ASM/weight (%) 23.76 The data is presented as mean±standard deviation.
BMI, body mass index; ASM, appendicular skeletal muscle mass.
Table 3. Prevalence of chronic disease and health-related behavior factors according to four groups in postmenopausal women
Variables Normal
(n=2,071) Obesity
(n=700) Sarcopenia
(n=557) Sarcopenic obesity (n=855) Chronic disease
Hypertension 640 (30.90) 318 (45.43) 219 (39.32) 487 (56.96)
Dyslipidemia 328 (15.84) 154 (22.00) 107 (19.21) 214 (25.03)
CVD 46 (2.22) 28 (4.00) 17 (3.05) 40 (4.68)
MI/angina pectoris 71 (3.43) 32 (4.57) 29 (5.21) 41 (4.80)
Diabetes mellitus 218 (10.53) 105 (15.00) 62 (11.13) 165 (19.30)
Metabolic syndrome 486 (23.47) 411 (58.71) 188 (33.75) 580 (67.84)
Alcohol use
Non drinking 1,556 (75.13) 488 (69.71) 430 (77.20) 657 (76.84)
Normal drinking 412 (19.89) 178 (25.43) 106 (19.03) 154 (18.01)
Problem drinking 77 (3.72) 28 (4.00) 21 (3.77) 24 (2.81)
Alcohol use disorder 10 (0.48) 2 (0.29) 0 (0.00) 8 (0.94)
Alcohol dependence 16 (0.77) 4 (0.57) 0 (0.00) 12 (1.40)
Smoking
Non-smoker 1,891 (91.31) 646 (92.29) 509 (91.38) 792 (92.63)
Past smoker 34 (1.64) 10 (1.43) 8 (1.44) 19 (2.22)
Current smoker 146 (7.05) 44 (6.29) 40 (7.18) 44 (5.15)
Physical activity
Sedentary behavior 1,002 (48.38) 303 (43.29) 288 (51.71) 458 (53.57)
Low intensity 612 (29.55) 194 (27.71) 169 (30.34) 213 (24.91)
Moderate intensity 278 (13.42) 135 (19.29) 62 (11.13) 121 (14.15)
Vigorous intensity 179 (8.64) 68 (9.71) 38 (6.82) 63 (7.37)
Household income
Low 738 (35.63) 261 (37.29) 175 (31.42) 330 (38.60)
Low-middle 505 (24.38) 195 (27.86) 172 (30.88) 206 (24.09)
High-middle 421 (20.33) 132 (18.86) 94 (16.88) 174 (20.35)
High 407 (19.65) 112 (16.00) 116 (20.83) 145 (16.96)
OCs or HRT
No medication 1,399 (67.55) 439 (62.71) 340 (61.04) 571 (66.78)
HRT 227 (10.96) 72 (10.29) 79 (14.18) 82 (9.59)
OCs 445 (21.49) 189 (27.00) 138 (24.78) 202 (23.63)
The data is presented as number (%).
CVD, cerebral vascular disease; MI, myocardial infarction; OCs, oral contraceptive pills; HRT, hormonal replacement therapy.
Table 2. Basic characteristics of normal, sarcopenia, obesity, and sarcopenic obesity group (n=4,183)
Variables Normal
(n=2,071) Obesity
(n=700) Sarcopenia
(n=557) Sarcopenic obesity (n=855)
Menopause age (yr) 48.29±0.14 48.91±0.27 48.77±0.27 48.41±0.23
Age (yr) 61.56±0.30 61.05±0.44 61.87±0.51 62.91±0.44
Waist circumference (cm) 76.84±0.20 88.47±0.31 80.52±0.34 91.39±0.33
Height (cm) 154.27±0.18 154.22±0.25 153.16±0.27 152.76±0.25
Weight (kg) 52.58±0.18 63.81±0.26 54.46±0.24 65.26±0.29
BMI (kg/m2) 22.06±0.06 26.80±0.07 23.19±0.07 27.93±0.11
ASM (kg) 13.89±48.71 16.07±73.69 12.19±65.22 14.31±75.78
ASM/weight (%) 26.48±0.06 25.19±0.05 22.37±0.07 21.94±0.07
Systolic blood pressure (mmHg) 124.64±0.54 128.54±0.71 127.21±0.87 130.52±0.68
Diastolic blood pressure (mmHg) 76.41±0.30 79.02±0.43 78.10±0.51 79.97±0.40
Triglyceride (mg/dL) 125.44±2.09 153.34±4.19 141.26±4.65 154.93±3.69
Fasting blood glucose (mg/dL) 97.85±0.53 103.44±1.17 99.89±1.15 105.42±1.08
HDL cholesterol (mg/dL) 54.23±0.35 49.66±0.49 52.84±0.64 51.12±0.47
Total cholesterol (mg/dL) 198.18±1.02 200.18±1.77 206.66±1.76 205.68±1.54
The data is presented as mean±standard error.
BMI, body mass index; ASM, appendicular skeletal muscle mass; HDL, high-density lipoprotein.
CI 4.49-6.90).
DISCUSSION
The total fat mass tends to increase in women during the menopause period of their lifetime. It is related to hor- monal changes—the decline of estrogen production—as well as normal aging, which contribute to an increase in central fat accumulation and a reduction in lean body mass following the increasing prevalence of MS in postmeno- pausal women.[16,17] In addition, the aging process accel- erates a reduction in muscle mass, which can decrease up to 8% every 10 years in women aged approximately 40 to 80 years, then decreases up to 15% every 10 years from then on.[18-20]
We examined the effect of sarcopenia and obesity on the risk of MS in postmenopausal women with controlling confounding factors. The results showed a definite relation- ship between SO and MS in postmenopausal women based on the 2008 to 2011 KNHANES. The OR for MS was approxi- mately twice as high in the sarcopenia group as in the nor- mal group, and six times higher in the SO group. One study suggested that the prevalence of MS in women aged 60 or older was 32.4% in the normal group and 71.1% in the SO group; therefore, the SO group had MS 2.1 times greater than the normal group.[16] Another study found that the SO group was 3.24 times than normal group according to the skeletal muscle mass index after adjusting for age.[21]
Therefore, this study proposed that the prevalence of MS for the SO group was approximately twice as high when
Table 4. Odds ratios for metabolic syndrome according to normal, obesity, sarcopenia, and sarcopenic obesity for weight adjusted by logistic re- gression in postmenopausal women
Metabolic syndrome
Normal (n=2,071) Obesity (n=700) Sarcopenia (n=557) Sarcopenic obesity (n=855)
Unadjusted OR (95% CI) 1 4.55 (3.63-5.71) 1.94 (1.52-2.49) 6.26 (5.10-7.70)
Adjusted OR (95% CI)a) 1 4.53 (3.61-5.69) 1.94 (1.51-2.48) 6.26 (5.09-7.70)
Adjusted OR (95% CI)b) 1 4.55 (3.62-5.71) 1.94 (1.52-2.49) 6.25 (5.08-7.69)
Adjusted OR (95% CI)c) 1 4.94 (3.91-6.24) 1.87 (1.46-2.40) 6.36 (5.17-7.81)
Adjusted OR (95% CI)d) 1 4.81 (3.74-6.19) 1.97 (1.51-2.56) 5.56 (4.49-6.90)
Tests by logistic regression of complex sampling analysis (95% CI).
a)Logistic regression for metabolic syndrome with four groups after adjustment for menopausal age. b)Logistic regression for metabolic syndrome with four groups after adjustment for menopausal age and any female sex hormonal treatment. c)Logistic regression for metabolic syndrome with four groups after adjustment for menopausal age, any female sex hormonal treatment, drinking status, smoking status, and physical activity. d)Logistic regression for metabolic syndrome with four groups after adjustment for menopausal age, any female sex hormonal treatment, drinking status, smoking status, physical activity, chronic disease, and economic status.
OR, odds ratio; CI, confidence interval.
compared with the previous research when targeting post- menopausal women.
Several limitations should be considered in the interpre- tation of this study. First, with the cross-sectional nature of this study, it is difficult to clarify the causal relationships between each other. Second, unfortunately, due to the ab- sence of questions on the Questionnaire form regarding menopausal duration, an equivocal boundary between the perimenopausal group and the postmenopausal group could facilitate from premenopausal to postmenopausal status. Third, the definition of sarcopenia has not been uni- versally confirmed, neither has its mensuration and indica- tors.[22] Fourth, we did not include participants who took medication for hypertension, diabetes, and hyperlipidemia in the diagnosis of MS, as it would underestimate the prev- alence of MS. Despite these limitations, this study analyzed the relationship between SO and MS with a complex sam- pling analysis on the great number of postmenopausal wom- en in South Korea. Therefore, the results were representative in reflecting their relationship in postmenopausal women including early menopause.
In conclusion, this study suggests that the prevalence of MS has increased in postmenopausal women compared with results of previous research.[16,21,23] This is due to the sudden hormonal changes that influence the redistri- bution of body composition, such as central obesity and the loss of muscle mass as independent risk factors that cause MS. Therefore, we further recommend that the mor- bidity rate of chronic disease be decreased through the pre- vention and management of modifiable detrimental fac-
tors in postmenopausal women.
REFERENCES
1. Lim S, Park KS, Lee HK, et al. Changes in the characteristics of metabolic syndrome in Korea over the period 1998-2001 as determined by Korean National Health and Nutrition Examination Surveys. Diabetes Care 2005;28:1810-2.
2. Park E, Choi SJ, Lee HY. The prevalence of metabolic syn- drome and related risk factors based on the KNHANES V 2010. J Agric Med Community Health 2013;38:1-13.
3. Kim KM, Lim S, Choi SH, et al. Cardiometabolic implication of sarcopenia: the Korea national health and nutrition ex- amination study (KNHANES) 2008-20104. IJC Metab En- docr 2014:63-9.
4. Maltais ML, Desroches J, Dionne IJ. Changes in muscle mass and strength after menopause. J Musculoskelet Neuronal Interact 2009;9:186-97.
5. Kaji H. Interaction between muscle and bone. J Bone Metab 2014;21:29-40.
6. Crawford SL, Casey VA, Avis NE, et al. A longitudinal study of weight and the menopause transition: results from the Massachusetts Women’s Health Study. Menopause 2000;
7:96-104.
7. Stenholm S, Harris TB, Rantanen T, et al. Sarcopenic obesi- ty: definition, cause and consequences. Curr Opin Clin Nutr Metab Care 2008;11:693-700.
8. Lim S, Kim JH, Yoon JW, et al. Sarcopenic obesity: preva- lence and association with metabolic syndrome in the Ko- rean Longitudinal Study on Health and Aging (KLoSHA).
Diabetes Care 2010;33:1652-4.
9. Peppa M, Koliaki C, Boutati E, et al. Association of lean body mass with cardiometabolic risk factors in healthy postmeno- pausal women. Obesity (Silver Spring) 2014;22:828-35.
10. Kwon HJ, Ha YC, Park HM. Prevalence of sarcopenia in the Korean woman based on the Korean national health and nutritional examination surveys. J Bone Metab 2016;23:
23-6.
11. Park HM, Ha YC, Yoo JI, et al. Prevalence of sarcopenia ad- justed body mass index in the Korean woman based on the Korean national health and nutritional examination surveys. J Bone Metab 2016;23:243-7.
12. Janssen I, Heymsfield SB, Ross R. Low relative skeletal mus- cle mass (sarcopenia) in older persons is associated with functional impairment and physical disability. J Am Geri- atr Soc 2002;50:889-96.
13. Baumgartner RN, Koehler KM, Gallagher D, et al. Epidemi- ology of sarcopenia among the elderly in New Mexico. Am J Epidemiol 1998;147:755-63.
14. Grundy SM, Brewer HB, Jr., Cleeman JI, et al. Definition of metabolic syndrome: Report of the National Heart, Lung, and Blood Institute/American Heart Association confer- ence on scientific issues related to definition. Circulation 2004;109:433-8.
15. Alberti KG, Zimmet P, Shaw J. Metabolic syndrome-a new world-wide definition. A Consensus Statement from the International Diabetes Federation. Diabet Med 2006;23:
469-80.
16. Chung JY, Kang HT, Lee DC, et al. Body composition and its association with cardiometabolic risk factors in the el- derly: a focus on sarcopenic obesity. Arch Gerontol Geriatr 2013;56:270-8.
17. Messier V, Rabasa-Lhoret R, Barbat-Artigas S, et al. Meno- pause and sarcopenia: A potential role for sex hormones.
Maturitas 2011;68:331-6.
18. Grimby G, Saltin B. The ageing muscle. Clin Physiol 1983;
3:209-18.
19. Hughes VA, Frontera WR, Wood M, et al. Longitudinal mus- cle strength changes in older adults: influence of muscle mass, physical activity, and health. J Gerontol A Biol Sci Med Sci 2001;56:B209-17.
20. Goodpaster BH, Park SW, Harris TB, et al. The loss of skele- tal muscle strength, mass, and quality in older adults: the health, aging and body composition study. J Gerontol A Biol Sci Med Sci 2006;61:1059-64.
21. Kim TN, Yang SJ, Yoo HJ, et al. Prevalence of sarcopenia and sarcopenic obesity in Korean adults: the Korean sar- copenic obesity study. Int J Obes (Lond) 2009;33:885-92.
22. Choi KM. Sarcopenia and sarcopenic obesity. Endocrinol Metab (Seoul) 2013;28:86-9.
23. Park HJ. Sarcopenic obesity is associated with metabolic syndrome: based on Korea national health and nutrition examination surveys [master's thesis]. Seoul: Korea Uni- versity; 2013.