ISSN 2234-3806 • eISSN 2234-3814
http://dx.doi.org/10.3343/alm.2014.34.6.426
CD34 and p53 Immunohistochemical Stains Differentiate Hypocellular Myelodysplastic Syndrome (hMDS) from
Aplastic Anemia and a CD34 Immunohistochemical Stain Provides Useful Survival Information for hMDS
Choong-Hwan Cha, M.D.1,4, Chan-Jeoung Park, M.D.1, Hyun-Sook Chi, M.D.1, Eul Ju Seo, M.D.1, Seongsoo Jang, M.D.1, Young-Uk Cho, M.D.1, Kyoo-Hyung Lee, M.D.2, Je-Hwan Lee, M.D.2, Jung-Hee Lee, M.D.2, Ho Joon Im, M.D.3,
and Jong-Jin Seo, M.D.3
Departments of Laboratory Medicine1, Internal Medicine2, and Pediatrics3, University of Ulsan College of Medicine and Asan Medical Center, Seoul;
Department of Laboratory Medicine4, University of Ulsan College of Medicine and Gangneung Asan Hospital, Gangneung, Korea
Background: The presence of significant dysplasia in bone marrow (BM) aspirates helps to distinguish between hypocellular myelodysplastic syndrome (hMDS) and aplastic ane- mia (AA). Occasionally, diluted BM aspirates make it difficult to recognize dysplastic changes and can also negatively affect the detection of cytogenetic abnormalities in hMDS. We evaluated the usefulness of CD34 and p53 immunoreactivity for discriminating between hMDS and AA and for estimating survival outcomes in hMDS patients.
Methods: BM clot section (BMC) or BM biopsy (BMB) specimens were obtained from 64 hMDS/AA patients (33 with hMDS and 31 with AA) and seven controls. Immunohisto- chemical (IHC) staining for CD34 and p53 was performed by using the EnVision detection system (Dako, Denmark). We compared the results of IHC staining, BM findings, and chromosomal analyses, and determined overall survival outcomes.
Results: The number of CD34- and p53-positive BM cells was higher among the patients with hMDS than among the patients with AA (P <0.001 and P =0.001, respectively).
hMDS patients with increased CD34-positive cells had significantly poorer survival out- comes compared with those with normal number of CD34-positive cells (P =0.013).
Conclusions: CD34 and p53 IHC stains of BMC or BMB provide useful information for dif- ferentiating between hMDS and AA. CD34 IHC staining of BMC or BMB also provides useful information for estimating survival outcomes in hMDS patients.
Key Words: Hypocellular myelodysplastic syndrome, Aplastic anemia, Immunohistochem- istry, CD34, p53
Received: July 25, 2013
Revision received: November 27, 2013 Accepted: August 18, 2014
Corresponding author: Chan-Jeoung Park Department of Laboratory Medicine, Asan Medical Center, 86 Asanbyeongwon-gil, Songpa-gu, Seoul 138-736, Korea Tel: +82-2-3010-4508
Fax: +82-2-478-0884 E-mail: cjpark@amc.seoul.kr Co-corresponding author:
Choong-Hwan Cha
Department of Laboratory Medicine, Gangneung Asan Hospital, 38 Bangdong-gil, Sacheon-myeon, Gangneung 210-711, Korea Tel: +82-33-610-3447 Fax: +82-33-610-3449 E-mail: cchoongh@gnah.co.kr
© The Korean Society for Laboratory Medicine This is an Open Access article distributed under the terms of the Creative Commons Attribution Non-Commercial License (http://creativecom- mons.org/licenses/by-nc/3.0) which permits unrestricted non-commercial use, distribution, and reproduction in any medium, provided the original work is properly cited.
INTRODUCTION
The myelodysplastic syndromes (MDSs) are a group of hemato- poietic stem cell disorders characterized by bone marrow (BM) dysplasia and various combinations of anemia, leukopenia, and thrombocytopenia [1]. BM cellularity is either normal or higher
than normal in 90% to 95% of MDS patients but is hypocellular in approximately 5% to 10% of MDS patients [2]. Hypocellularity is defined as BM cellularity of less than 30% in patients of 60 years or younger or less than 20% in patients over 60 yr [3].
Hypocellular MDS (hMDS) is morphologically difficult to be distinguished from acquired aplastic anemia (AA). The presence
of significant bilineage or trilineage dysplasia or the presence of karyotypic abnormalities may indicate a MDS diagnosis. The of- ten low cellular yield of BM aspirates (BMA) can negatively af- fect the detection of dysplastic changes and the quality of mar- row cytogenetic analyses. In addition, it takes several days to ob- tain and report the findings of a chromosomal study [1, 2].
A stem-cell CD34 phenotype is presently considered being one of the best markers of progenitor cells, including B- and T- lymphoid progenitor cells, and myeloid precursors [4]. CD34 expression is normally confined to 0.1-0.5% of nucleated cells in the peripheral blood (PB) and to 0.8-5% of mononuclear cells in adult BM [4]. TP53 is a tumorsuppressor gene located on the short arm of chromosome 17 [5]. The products of this gene play two roles in DNA-damaged cells, that is, proliferation arrest and apoptosis induction [5]. In contrast, a mutant TP53 may play a permissive role in the proliferation of cells with dam- aged DNA [5]. The wild-type p53 protein has a short half-life and cannot usually be detected at the protein level. In contrast, the mutant p53 protein typically has a prolonged half-life and is detectable by immunohistochemistry (IHC) on tissue section [6].
In analyses of hematologic neoplasia using PB or BM smears, a very high correlation between the DNA analysis of TP53 muta- tions and immunocytochemistry results has been reported [7].
In this study, we evaluated the usefulness of CD34 and p53 immunoreactivity for differentiating between hMDS and AA and for estimating survival outcomes in hMDS patients.
METHODS
1. PatientsBM biopsies (BMB) or clot (BMC) sections from 64 patients, 33 with hMDS (16 with refractory anemia [RA], 9 with refractory cytopenia with multilineage dysplasia [RCMD], 2 with MDS, un- classifiable, and 6 with refractory cytopenia of childhood [RCC];
27 adults and 6 children) and 31 with AA (23 adults and 8 chil- dren) were retrieved from the tissue archives of the Asan Medi- cal Center in Seoul, Korea. All the cases had been diagnosed between May 1998 and April 2007. The age and sex differ- ences between the hMDS and AA patients were not significant.
Data on white blood cell and differential counts, hemoglobin level, platelet count, mean corpuscular volume, red cell distri- bution width, paroxysmal nocturnal hemoglobinuria (PNH) test results, and chromosomal analysis at diagnosis were collected for each sample. Clinical histories were assessed via retrospec- tive chart review. Conventional BMA smears and hematoxylin and eosin-stained BMB and BMC slides were reviewed for each
case. Diagnoses of MDS were made in accordance with the WHO classification (2008) [8]. A diagnosis of AA was defined as pancytopenia (absolute neutrophil count <1.8×10⁹/L, platelet count <140×109/L, and anemia with hematocrit level <38%) with hypocellular BM. Hypocellularity was defined as BM cellu- larity of lower than 30% in patients of 60 yr or younger, or less than 20% in patients over 60 yr. Three cases initially diagnosed with AA were later diagnosed with MDS according to the chro- mosomal abnormalities and the presence of dyspoiesis. A group of 7 controls was used for comparison (2 patients with iron defi- ciency anemia, 2 with immune thrombocytopenia, and 3 with BM-uninvolved lymphoma).
2. Immunohistochemistry
IHC staining for CD34 and p53 was performed on formalin- fixed, paraffin-embedded BMB or BMC sections. To examine CD34 and p53 expression, sections were treated with a citrate buffer at 100°C in an oven for 60 min to allow antigen retrieval.
Primary antibodies against CD34 (1:100; QBEnd-10, Dako, Glostrup, Denmark) and p53 (1:200; DO-7, Dako) were used.
Immunostaining was performed using the EnVision detection system (K5007, Dako). Immunoreactivity was detected with 3,3'-diaminobenzidine (Dako). Known lymphoma tissue sec- tions were also stained for use as positive controls for p53. The CD34 positivity of endothelial cells was used as an internal con- trol for CD34 staining. Hematopoietic cells with cell surface membranes and cytoplasmic CD34-positive immunostaining and those with positive nuclear staining for p53 were classified as positive (Fig. 1). The number of positively stained BM nucle- ated cells was counted on 10 high-power fields (HPF; ×40, ob- jective ×10), excluding the cortical and trabecular bone, perios- teal connective tissue, hemorrhagic areas, and areas occupied by fat cells. The abnormal localization of immature precursors (ALIP), defined as aggregates of myeloblasts and promyelocytes (5 or more cells), in marrow trephine biopsies and their number were also counted on 10 HPF, as were the number of CD34+
clusters, defined as aggregates of CD34-positive cells (3 or more cells), and the number of endothelial cells. Two hematopatholo- gists counted CD34+ cells, p53+ cells, ALIP, CD34+ cell clus- ters and endothelial cells separately, and the mean value was taken. For discordant results with variability more than 10% be- tween the two hematopathologists, the numerization was per- formed simultaneously by two hematopathologists with a multi- headed microscope.
3. Statistical analysis
We compared the results of complete blood counts, BM analy- ses, IHC staining, PNH testing, chromosomal analyses, and overall survival (OS). Statistical analyses were performed by us- ing the SPSS version 13.0 software (SPSS Inc., Chicago, IL) and MedCalc version 11.5.1.0 (MedCalc, Mariakerke, Belgium). Dif- ferences between clinical and laboratory findings and immuno- phenotypic characteristics between hMDS and AA were evalu- ated by using the chi-square test and Mann-Whitney test. Asso- ciations between the revised international prognostic scoring system (IPSS-R) score for MDS [9], the outcomes of cytogenetic analyses according to the IPSS-R score for MDS, and ALIP, p53+ cell counts, and CD34+ cell counts were evaluated by us- ing the Kruskal-Wallis test. To determine the cutoff values for
ALIP, p53+ cell counts and CD34+ cell counts which were used to differentiate between hMDS and normal control, ROC curve analysis was performed. The sensitivity of ALIP, CD34, and p53 staining was determined by the proportion of hMDS samples that were above the established cutoff values for these stains.
The specificity of staining was calculated as the proportion of control samples that were below the cutoff values for ALIP, CD34, and p53 staining. The OS of the hMDS and AA patients were estimated by using the Kaplan-Meier method and were compared by using the log-rank test. A P <0.05 was considered statistically significant.
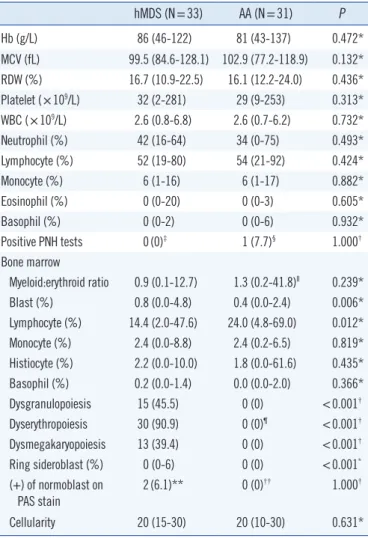
Table 1. Comparison of the laboratory data from hypocellular my- elodysplastic syndrome and aplastic anemia patients
hMDS (N=33) AA (N=31) P
Hb (g/L) 86 (46-122) 81 (43-137) 0.472*
MCV (fL) 99.5 (84.6-128.1) 102.9 (77.2-118.9) 0.132*
RDW (%) 16.7 (10.9-22.5) 16.1 (12.2-24.0) 0.436*
Platelet (×109/L) 32 (2-281) 29 (9-253) 0.313*
WBC (×109/L) 2.6 (0.8-6.8) 2.6 (0.7-6.2) 0.732*
Neutrophil (%) 42 (16-64) 34 (0-75) 0.493*
Lymphocyte (%) 52 (19-80) 54 (21-92) 0.424*
Monocyte (%) 6 (1-16) 6 (1-17) 0.882*
Eosinophil (%) 0 (0-20) 0 (0-3) 0.605*
Basophil (%) 0 (0-2) 0 (0-6) 0.932*
Positive PNH tests 0(0)‡ 1 (7.7)§ 1.000†
Bone marrow
Myeloid:erythroid ratio 0.9 (0.1-12.7) 1.3 (0.2-41.8)II 0.239*
Blast (%) 0.8 (0.0-4.8) 0.4 (0.0-2.4) 0.006*
Lymphocyte (%) 14.4 (2.0-47.6) 24.0 (4.8-69.0) 0.012*
Monocyte (%) 2.4 (0.0-8.8) 2.4 (0.2-6.5) 0.819*
Histiocyte (%) 2.2 (0.0-10.0) 1.8 (0.0-61.6) 0.435*
Basophil (%) 0.2 (0.0-1.4) 0.0 (0.0-2.0) 0.366*
Dysgranulopoiesis 15 (45.5) 0 (0) <0.001† Dyserythropoiesis 30 (90.9) 0 (0)¶ <0.001† Dysmegakaryopoiesis 13 (39.4) 0 (0) <0.001† Ring sideroblast (%) 0 (0-6) 0 (0) <0.001* (+) of normoblast on
PAS stain 2(6.1)** 0 (0)†† 1.000†
Cellularity 20 (15-30) 20 (10-30) 0.631*
All data are presented as median (range) or number (%).
*Mann-Whitney test; †Chi-square test; ‡Twenty-two missing values (N=11);
§Eighteen missing values (N=13); IIOne missing value (N=30); in one case, myeloid and erythroid cells were not found; ¶Seven cases showed minimal dyserythropoiesis (<10%); **Seven missing values (N =26); ††Twenty-two missing values (N=9).
Abbreviations: hMDS, hypocellular myelodysplastic syndrome; AA, aplastic anemia; MCV, mean corpuscular volume; RDW, red cell distribution width;
WBC, white blood cell; PNH, paroxysmal nocturnal hemoglobinuria; PAS, periodic acid-Schiff.
Fig. 1. Example of CD34+ (A) and p53+ (B) immunohistochemical stains in a patient with hypocellular myelodysplastic syndrome (bone marrow biopsy; immunohistochemical stain; original magnifi- cation ×400).
A
B
RESULTS
No significant differences were found in the complete blood counts, myeloid-to-erythroid ratios, or the cellularity or positivity of normoblasts on periodic acid-Schiff staining between the hMDS and AA patients (Table 1). hMDS specimens showed in- creased blasts and decreased lymphocytes compared with the specimens from AA patients (P =0.006 and P =0.012, respec- tively; Table 1). hMDS specimens showed increased levels of erythroid, granulocytic, and megakaryocytic dysplasia compared with the specimens from AA patients (P <0.001, P <0.001, and P <0.001, respectively) and positive ring sideroblasts (P <
0.001).
Chromosomal analyses were performed for 58 specimens
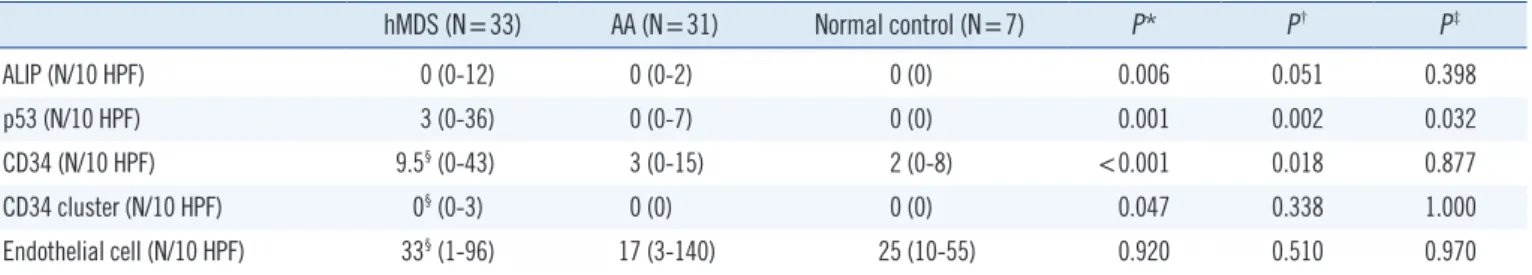
(from 30 hMDS and 28 AA patients). One case of hMDS showed no mitotic cells. Thirteen hMDS cases (13/29, 44.8%) and one AA case (1/28, 3.8%) showed chromosomal abnor- malities (P <0.001; Table 2). Trisomy 8 was the most frequently observed abnormality in hMDS (4/13, 30.8%). In one hMDS specimen, the endothelial cells did not stain for CD34, and this case was excluded from this part of the analysis. hMDS speci- mens also showed increased ALIP (P =0.006; Table 3) com- pared with AA specimens. The number of CD34- and p53-posi- tive BM cells was higher in the specimens from hMDS patients than the specimens from AA patients (P <0.001 and P =0.001, respectively) and controls (P =0.018 and P =0.002, respec- tively). CD34-positive clusters were also found in some hMDS specimens (P =0.047). There was no significant difference in
Table 2. Characteristics of the patients with chromosomal abnormalities
UPN Diagnosis Sex Age (yr) Karyotype
1 RA F 29 46,XX,+1,der(1;14)(q10;q10)[17]/46,XX[3]
2 RA F 33 47,XX,+8[5]/46,XX[15]
3 RA F 50 46,XX,del(5)(q13q33)[5]/47,XX,+8[4]/46,XX[21]
4 RCC M 15 46,XY,del(20)(q11.2)[14]/45,X,-Y,del(20)(q11.2)[6]
5 RA M 30 47,XY,+8[3]/46,XY[27]
6 RA M 50 45,XY,der(7)t(7;18)(p11.2;q11.2),-18[20]
7 RA M 52 46,XY,der(5)t(1;5)(q21;q35)[5]/46,XY[15]
8 RCMD F 37 47,XX,+8[26]/47,XX,+8,-10,+der(1;16)(q10;q10) or 47,XX,+1,der(1;10)(q10;p10),+8[4]
9 RCMD F 57 46,XX,del(9)(q12q22)[20]
10 RCMD M 34 45,XY,-3,der(7;12)(p10;q10),der(11)t(5;11)(q11.2;p11.2),-17,+2mar[cp4]/46,XY[16]
11 RCMD M 52 45,X,-Y[16]/46,XY[9]
12* MDS-U F 60 46,XX,del(20)(q11.2q13.3)[20]
13 MDS-U M 17 46,XY,del(13)(q14q34)[8]/46,XY[17]
14 AA F 11 47,XX,+8[4]/46,XX[16]
*This patient showed dysmegakaryopoiesis.
Abbreviations: UPN, unique patient number; RA, refractory anemia; RCC, refractory cytopenia of childhood; RCMD, refractory cytopenia with multilineage dysplasia; MDS-U, myelodysplastic syndrome, unclassifiable; AA, aplastic anemia.
Table 3. Comparison of the immunohistochemistry results from the hypocellular myelodysplastic syndrome and aplastic anemia samples
hMDS (N=33) AA (N=31) Normal control (N=7) P* P† P‡
ALIP (N/10 HPF) 0 (0-12) 0 (0-2) 0 (0) 0.006 0.051 0.398
p53 (N/10 HPF) 3 (0-36) 0 (0-7) 0 (0) 0.001 0.002 0.032
CD34 (N/10 HPF) 9.5§ (0-43) 3 (0-15) 2 (0-8) <0.001 0.018 0.877
CD34 cluster (N/10 HPF) 0§ (0-3) 0 (0) 0 (0) 0.047 0.338 1.000
Endothelial cell (N/10 HPF) 33§ (1-96) 17 (3-140) 25 (10-55) 0.920 0.510 0.970
All data are presented as median (range).
*Mann-Whitney test between hMDS and AA; †Mann-Whitney test between hMDS and normal control; ‡Mann-Whitney test between AA and normal control;
§1 missing value (N=32).
Abbreviations: hMDS, hypocellular myelodysplastic syndrome; AA, aplastic anemia; ALIP, abnormal localization of immature precursors; HPF, high-power fields.
the number of endothelial cells between the hMDS and AA specimens (P =0.920). There was no association between the IPSS-R score for MDS and the ALIP, p53+ cell counts, and CD34+ cell counts (P =0.885, P =0.469, and P =0.211, re- spectively). There was also no association between the out- comes of cytogenetic analyses which were adjusted according to the relevant IPSS-R score for MDS and the ALIP, p53+ cell counts, and CD34+ cell counts (P =0.372, P =0.436, and P = 0.459, respectively).
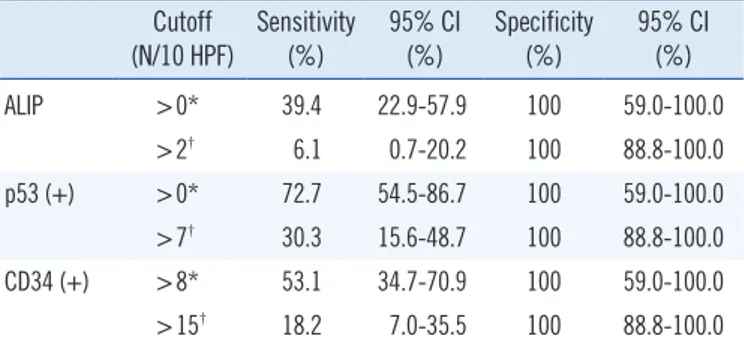
According to the ROC curve analysis, the cutoff values for ALIP, p53, and CD34 positivity for discriminating between hMDS and normal tissue were >0 ALIP/10 HPF, >0 p53+
cells/10 HPF, and >8 CD34+ cells/10 HPF, and those for dis- criminating between hMDS and AA tissue were >2 ALIP/10 HPF, >7 p53+ cells/10 HPF, and >15 CD34+ cells/10 HPF (Table 4). Any specimen with values exceeding these cutoff val- ues was diagnosed as having hMDS. The areas under the
curves (AUCs) for ALIP, p53, and CD34 were 0.697, 0.864, and 0.806, respectively. For AA cases, the AUCs for ALIP, p53, and CD34 were 0.652, 0.735, and 0.769, respectively. The sensitiv- ity of CD34 immunostaining for hMDS was 53.1% (17/32) and 72.7% for p53 (24/33). Twenty-seven (81.8%) of the 33 pa- tients with hMDS were positive for at least one of these proteins.
However, only one (3.2%) of the 31 AA specimens showed CD34 positivity (15/10 HPF), whereas 14 (45.2%) were found to be p53-positive (1/10 HPF, 6 cases; 2/10 HPF, 4 cases; 3/10 HPF, 5/10 HPF, 6/10 HPF, and 7/10 HPF, 1 case each).
No significant differences were found in the evolution rates of AML between the hMDS and AA patients (0/33 vs. 0/31, P = 1.0) and in the death rate between the hMDS and AA patients (3/33 vs. 3/31, P =1.0). No significant differences were ob- served in survival outcomes between the hMDS and AA patients (mean survival [months]: hMDS patients, 89.9; AA patients, 88.8; P =0.930; Fig. 2). However, the hMDS patients with in- creased CD34-positive cell counts ( >8 cells/10 HPF, N =17) showed significantly poorer survival than the patients with nor- mal CD34-positive cell counts (≤8 cells/10 HPF, N =15; P = 0.013; Fig. 3).
DISCUSSION
The differentiation between hMDS and AA is principally based on the histological and immunohistological features of BM.
When diagnosing these two disorders, the most important fea- ture is the presence or absence of blast clusters, which are in- dicative of hMDS. IHC staining for CD34 is helpful in highlight- ing blasts [10]. Other features that have been found, to some
100 80 60 40 20
0
0 20 40 60 80 100 120 Overall survival (mo)
P =0.013
>8≤8 CD34 positive/10HPF
Cumulative survival (%)
Fig. 3. Kaplan-Meier analysis for the overall survival of the patients with hypocellular myelodysplastic syndrome. The patients were di- vided into groups based on the CD34 immunohistochemistry status.
100 80 60 40 20
0
0 20 40 60 80 100 120 Overall survival (mo)
P =0.930
hMDS AA
Cumulative survival (%)
Fig. 2. Kaplan-Meier analysis comparing overall survival between the patients with hypocellular myelodysplastic syndrome (hMDS; N=
33) and those with aplastic anemia (AA; N=31).
Table 4. Receiver operating characteristic curve analysis for the di- agnosis of hypocellular myelodysplastic syndrome
Cutoff
(N/10 HPF) Sensitivity (%) 95% CI
(%) Specificity
(%) 95% CI (%)
ALIP >0* 39.4 22.9-57.9 100 59.0-100.0
>2† 6.1 0.7-20.2 100 88.8-100.0
p53 (+) >0* 72.7 54.5-86.7 100 59.0-100.0
>7† 30.3 15.6-48.7 100 88.8-100.0
CD34 (+) >8* 53.1 34.7-70.9 100 59.0-100.0
>15† 18.2 7.0-35.5 100 88.8-100.0
*Normal controls as disease-negative; †Aplastic anemia as disease-negative.
Abbreviations: ALIP, abnormal localization of immature precursors; HPF, high-power fields; CI, confidence interval.
creased compared with normal controls [17]; however, AA is associated with reduced angiogenesis [18]. Defective angiogen- esis may result in, or aggravate, BM aplasia in AA patients [18].
In the present study, however, no significant differences were found in the number of endothelial cells between hMDS and AA patients.
In the present study, we found that hMDS patients with in- creased CD34-positive cell counts (>8 cells/10 HPF) had a sig- nificantly shorter survival time than those with normal CD34- positive cell counts (≤8 cells/10 HPF). In MDS patients, in- creased CD34-expressing cells in the PB and BM has been shown to be associated with poor survival and higher risk of progression to acute leukemia [19]. An increased number of CD34+ cells in the BMB or BMC sections of hMDS patients may therefore be associated with short survival times.
This study has limitations. First, three patients initially classi- fied as having AA were later diagnosed with hMDS according to the chromosomal abnormalities and the presence of dyspoiesis, in accordance with the WHO (2008) classification of hMDS.
These three patients were treated for the initial diagnosis of AA.
Second, other prognostic factors such as the IPSS-R for MDS were not controlled for in the survival analysis.
In conclusion, CD34 and p53 IHC staining of BMB or BMC sections provides useful information for discriminating between hMDS and AA. A CD34 IHC stain of a BMB or BMC section may also provide useful information for estimating survival rates in hMDS patients.
Authors’ Disclosure of Potential Conflicts of Interest
No potential conflicts of interest relevant to this article were re- ported.
Acknowledgments
This study was supported by a grant from the Asan Institute for Life Sciences (grant No. 2010-179).
REFERENCES
1. Orazi A, Albitar M, Heerema NA, Haskins S, Neiman RS. Hypoplastic myelodysplastic syndromes can be distinguished from acquired aplastic anemia by CD34 and PCNA immunostaining of bone marrow biopsy specimens. Am J Clin Pathol 1997;107:268-74.
2. Orazi A and Czader MB. Myelodysplastic syndromes. Am J Clin Pathol 2009;132:290-305.
extent, to be predictive of progression to AML and can therefore favor a diagnosis of hMDS are trilineage atypia (particularly megakaryocyte atypia), increased numbers or clustering of megakaryocytes, and reticulin fibrosis [10].
According to the WHO classification, the presence of speci- fied clonal chromosomal abnormalities can provide the basis for a diagnosis of MDS when cytological abnormalities are not suffi- cient for diagnosis [8, 11]. In the setting of persistent cytopenias of undetermined origin, cytogenetic abnormalities are consid- ered presumptive evidence of MDS in the absence of definitive morphological features [8]. In the present study, trisomy 8 was the most frequently observed chromosomal abnormality in the samples from the patients with hMDS (unique patient numbers [UPN] 2, 3, 5, and 8) and was evident in one patient with AA (UPN 14; Table 2). According to the IPSS-R for MDS, the pa- tient of UPN 2 was assigned to the intermediate risk and sur- vived for 8.4 months. Patients of UPN 3 and UPN 5 were clas- sified as being at the low risk and survived for 54.0 and 33.2 months, respectively. The patient of UPN 8 was assigned to the high-risk group and survived for 63.4 months. The AA patient with trisomy 8 (UPN 14) survived for 38.1 months.
CD34 is expressed in hematopoietic progenitor cells and is fundamental to the pathophysiological mechanisms of both hMDS and AA. MDS clonal expansion emanates from a CD34+
stem cell, and in AA the CD34+ stem cells are the target of an autoimmune attack [12]. Accordingly, the percentage of CD34+
cells is usually <0.3% in AA but is either normal (0.5% to 1.0%) or elevated in hMDS [13]. Our current findings of the lev- els of CD34-positive BM cells are concordant with previous re- ports that CD34-positive cell count is significantly higher in pa- tients with hMDS than in those with AA [1]. The case of AA with increased CD34-positive cells had normal karyotype and no p53 expression.
In the present study, the number of p53-positive BM cells was significantly higher in the hMDS specimens than in the AA spec- imens. This finding is consistent with previous findings that have shown a higher level of p53 expression in BMB or BMC sections in patients with hMDS RA than in those with AA [5, 14]. In the present study, 14 (45.2%) of the 31 specimens from AA patients were positive for p53. In a previous report, 6.4% (2/31) of AA patients showed p53 overexpression [14]; however, in other studies, AA patients showed no p53 overexpression [5, 15].
When anti-CD34 is used as a progenitor-related marker for MDS, the additional labeling of endothelial cells in the blood vessels and sinuses enables the detection of signs of angiogen- esis [16]. In patients with MDS, angiogenesis is significantly in-
3. Tuzuner N, Cox C, Rowe JM, Watrous D, Bennett JM. Hypocellular my- elodysplastic syndromes (MDS): new proposals. Br J Haematol 1995;
91:612-7.
4. Baur AS, Meugé-Moraw C, Schmidt PM, Parlier V, Jotterand M, Delacrétaz F. CD34/QBEND10 immunostaining in bone marrow biop- sies: an additional parameter for the diagnosis and classification of my- elodysplastic syndromes. Eur J Haematol 2000;64:71-9.
5. Elghetany MT, Vyas S, Yuoh G. Significance of p53 overexpression in bone marrow biopsies from patients with bone marrow failure: aplastic anemia, hypocellular refractory anemia, and hypercellular refractory anemia. Ann Hematol 1998;77:261-4.
6. Totzke G, Brüning T, Vetter H, Schulze-Osthoff K, Ko Y. P53 downregu- lation in myelodysplastic syndrome - a quantitative analysis by competi- tive RT-PCR. Leukemia 2001;15:1663-4.
7. Lepelley P, Preudhomme C, Vanrumbeke M, Quesnel B, Cosson A, Fe- naux P. Detection of p53 mutations in hematological malignancies: com- parison between immunocytochemistry and DNA analysis. Leukemia 1994;8:1342-9.
8. Brunning RD, Orazi A, Germing U, Le Beau MM, Porwit A, Baumann I, et al. Myelodysplastic syndromes/neoplasms, overview. In: Swerdlow SH, Campo E, et al., eds. WHO classification of tumours of haematopoi- etic and lymphoid tissues. 4th ed. Lyon: IARC, 2008:88-93.
9. Greenberg PL, Tuechler H, Schanz J, Sanz G, Garcia-Manero G, Solé F, et al. Revised international prognostic scoring system for myelodysplas- tic syndromes. Blood 2012;120:2454-65.
10. Bain BJ, Clark DM, Wilkins BS. Acute myeloid leukemia, mixed pheno- type acute leukemia, the myelodysplastic syndromes and histiocytic neoplasms. In: Bain BJ, Clark DM, et al., eds. Bone marrow pathology.
4th ed. Oxford: Wiley-Blackwell, 2010:166-238.
11. Bain BJ. The myelodysplastic syndromes. In: Bain BJ, ed. Leukaemia diagnosis. 4th ed. Oxford: Wiley-Blackwell, 2010:219-60.
12. Brodsky RA. Acquired aplastic anemia. In: Greer JP, Foerster J, et al.
eds. Wintrobe’s clinical hematology. 12th ed. Philadelphia: Lippincott Williams & Wilkins, 2009:1185-95.
13. Matsui WH, Brodsky RA, Smith BD, Borowitz MJ, Jones RJ. Quantita- tive analysis of bone marrow CD34 cells in aplastic anemia and hypo- plastic myelodysplastic syndromes. Leukemia 2006;20:458-62.
14. Choi JW, Fujino M, Ito M. F-blast is a useful marker for differentiating hy- pocellular refractory anemia from aplastic anemia. Int J Hematol 2002;
75:257-60.
15. Elghetany MT. p53 overexpression in bone marrow biopsies in refracto- ry anemia and aplastic anemia: impact of antibody selection. Leuk Res 2000;24:975-7.
16. Horny HP, Sotlar K, Valent P. Diagnostic value of histology and immuno- histochemistry in myelodysplastic syndromes. Leuk Res 2007;31:1609- 16.
17. De Raeve H, Van Marck E, Van Camp B, Vanderkerken K. Angiogenesis and the role of bone marrow endothelial cells in haematological malig- nancies. Histol Histopathol 2004;19:935-50.
18. Gupta P, Khurana N, Singh T, Gupta D, Dhingra KK. Bone marrow an- giogenesis in aplastic anemia - a study of CD 34 and VEGF expression in bone marrow biopsies. Hematology 2009;14:16-21.
19. Soligo DA, Oriani A, Annaloro C, Cortelezzi A, Calori R, Pozzoli E, et al.
CD34 immunohistochemistry of bone marrow biopsies: prognostic sig- nificance in primary myelodysplastic syndromes. Am J Hematol 1994;
46:9-17.