455 https://doi.org/10.9713/kcer.2021.59.3.455
PISSN 0304-128X, EISSN 2233-9558
Experimental Investigation on Finasteride Microparticles Formation via Gas Antisolvent Process
Mohammad Najafi, Nadia Esfandiari†, Bizhan Honarvar and Zahra Arab Aboosadi Department of Chemical Engineering, Marvdasht Branch, Islamic Azad University, Marvdasht, Iran.
(Received 28 February 2021; Received in revised 8 April 2021; Accepted 12 May 2021)
Abstract − Micro and nanoparticles of Finasteride were prepared by gas-antisolvent method. The influence of process parameters such as pressure (100, 130 and 160 bar), temperature (308, 318 and 328 K) and solute concentrations (10, 25 and 40 mg/ml) on mean particle size was studied by Box-Behnken design. As ANOVA results indicated, the highest influence in production of smaller particles was attributed to the pressure. Optimum condition leading to the smallest particle size was as follows: initial solute concentration, 10 mg/ml; temperature, 308 K and pressure, 160 bar. The particles were evaluated with FTIR, SEM, DLS, XRD as well as DSC. The analyses revealed a size decrease in the precipitated Finasteride particles (232.4 nm, on mean) via gas-antisolvent method, as compared to the original particles (55.6 µm).
Key words: Response surface methodology, Supercritical fluid technology, Dimethyl sulfoxide, Finasteride, Nanoparticle
1. Introduction
Low water-solubility of drugs is one of the key problems of the pharmaceutical industry, since weak dissolution properties of the drugs will result in their poor bioavailability and hence reduced therapeutic efficacy [1]. Consequently, it is now a major issue to find a way to increase drug solubility through different methods to achieve acceptable bioavailability. Water is the major constituent of humans so the drugs’ maximum efficacy with minimum dosage requires their high water solubility [2]. For this purpose, numerous studies have been devoted to improving the water solubility of low-soluble drugs to increase their bioavailability [3]. Inadequate bioavailability of drugs in the water-based gastrointestinal fluids stems from their low solubility and dissolution rates. Particularly for class II (low solubility as well as great permeability) drugs, consistent with biopharmaceutics classification system (BCS), increase of solubility and dissolution rate of substances in the gastrointestinal liquids will lead to bioavailability improvement [4-6]. The negative effect of low-soluble compounds is as follows: low absorption and bioavailability, inadequate solubility for intravenous dosing, and developmental issues, resulting in the increase in costs and time, which will shift the burden to the patients.
Nowadays, the reduction of particle size and its consequent increase in the specific surface area can enhance bioavailability, giving rise to augmented dissolution. Distribution of small particles is critical for designing regular drug delivery systems. Various methods are proposed to improve the drug dissolution rate with low water solubility along
with particle size reduction to increase surface and hence elevate the drug dissolution rate, solubilization in surfactant systems, the formation of water-soluble complexes, salt formation [7,8] producing liquid- solid formulations [9], solid dispersion [8], pH adjustment and lipid formulation [10] can be mentioned. Conventional methods for decreasing particle sizes are as follows: mechanical methods (like crushing, grinding as well as milling), spray-drying, freeze-drying, and recrystallization of the solute particles in the solution by a liquid anti-solvent [11-13]. In the case of mechanical methods, elevated temperature and toxic solvents can degrade the products. However, conventional methods cause difficulty in obtaining suitable size and uniform distribution of particles [14].
The application of supercritical fluid (SCF) in processes can prevent the problems that occur in regular procedures. In the past few years, the supercritical fluid method has been developed as a new method to produce nanoparticles. In this regard, several supercritical fluid-based methods are introduced among which the rapid expansion of supercritical solutions (RESS), gas antisolvent recrystallization (GAS), solution enhanced dispersion by SCF (SEDS), supercritical antisolvent methods (SAS), and aerosol supercritical extraction system (ASES) can be mentioned [15-18].
Complex procedures are required for producing particles with special physical and chemical characteristics. The gas anti-solvent procedure is one of these processes where supercritical fluids play a role as antisolvent. This technique is particularly applicable in cases of drugs with low solubility in supercritical CO2 where the RESS method is not feasible. Several researchers have addressed the utilization of this process in production of various nano and microparticles [19-24].
Wichianphong et al. [23] studied the influence of parameters and determined the optimum GAS process conditions for producing
†To whom correspondence should be addressed.
E-mail: [email protected]
This is an Open-Access article distributed under the terms of the Creative Com- mons Attribution Non-Commercial License (http://creativecommons.org/licenses/by- nc/3.0) which permits unrestricted non-commercial use, distribution, and reproduc- tion in any medium, provided the original work is properly cited.
mefenamic acid-nicotinamide (MEF-NIC) co-crystal by the GAS procedure in order to advance the MEF dissolution rate. It was shown that the fastest dissolution time is achievable by the GAS process under the following conditions. The temperature was set at 34.9 °C, the ratio of paracetamol to mefenamic acid was 4.3:1 and drug saturation was equal to 86.8%. Ulker et al. [25] also used GAS for drug precipitation in the pores of an aerogel. This method was further employed for loading paracetamol in the silica aerogel. They found that the drug is more homogeneously distributed if the initial concentration is high.
Dittanet et al. [26] synthesized mefenamic acid as well as polyvinylpyrrolidone (PVP) composites using the GAS technique.
The influence of a different drug to polymer ratio, temperature, solution concentration, and different type of solvents on the amount of drug and size and morphology of particle was investigated. They concluded that there is a greater amount of the drug if the ratio of drug to polymer increases. Nevertheless, for lower or equal amounts of polymer compared to the drug, the drug content was not affected by temperature and solution concentration. Elevated drug-to-polymer ratio or temperature are found to cause the development of larger particles.
Furthermore, Lőrincz et al. [27] studied the ibuprofen resolution and crystallization with (R)-phenyl ethylamine to prepare a salt mixture by the GAS method. They examined the influence of the different operative parameters (i.e., different pressures, temperatures, and the CO2-organic solvent ratios) on the produced particles (with the size of 3 microns). In this research, the optimal conditions were determined. Moreover, several researchers have focused on the use of GAS process for production of micro and nanoparticles [28-31].
Finasteride (FNS) (N-(1,1-dimethyl ethyl)-3-oxo-4-aza-5-androst- 1ene-17-carboxamide) is a synthetic 4- azasteroid compound. This drug is a competitive and specific inhibitor of type II 5-alpha-reductase that can be inhibited in the prostate gland, liver as well as skin because the competitive and specific inhibiting role of the drug interferes with the enzymatic conversion of testosterone to 5α-dihydrotestosterone (DHT), leading to lower serum DHT levels. This drug is applied for treating benign prostatic hyperplasia (BPH) symptoms in males with prostate enlargement to recover their symptoms. This drug was used to stimulate hair growth in males having mild to moderate androgenic alopecia (male pattern alopecia, hereditary alopecia, common male baldness) [32,33]. In accordance with biopharmaceutical classification, FNS is categorized as class 2 (poor solubility and great permeability drugs), where the dissolution of the drug is the primary limiting factor of the drug absorption rate. Its water solubility was reported to be 0.05 mg/ml at the pH range of 1~13 indicating its poor solubility.
So, the drug is a weak acid with a pKa of 15.9 [32]. Also, the solubility of FNS in supercritical CO2 (molar fraction solubility from 10-5 to 10-4 at temperature range of 308-348 K and pressure range of 121-355bar) is poor [34]. So far, the preparation of FNS micro and nanoparticles by the GAS method has not been studied in the literature.
In this paper, the GAS method was used for production of FNS
nanoparticles to increase their dissolution rate. In GAS method, C2H6OS is applied as solvent and CO2 is utilized as anti-solvent. The effect of operation parameters such as temperature, pressure, and initial solute concentration was investigated by Box-Behnken design.
Solid-state characterization techniques including differential scanning calorimetry (DSC), Fourier transform infrared (FTIR) spectroscopy, scanning electron microscopy (SEM), X-ray diffraction (XRD) as well as dynamic light scattering (DLS) were applied to confirm nanoparticle formation.
2. Materials and Methods
2-1. Materials
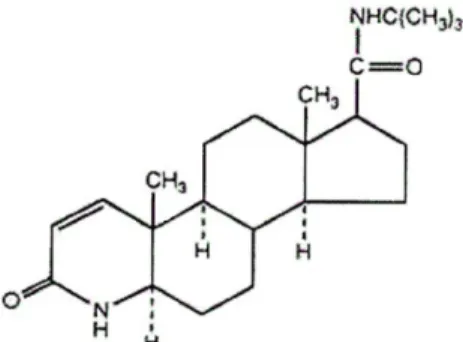
Finasteride (CAS Number 98319-26-7, 99.7% purity) was obtained from Zhejiang Xianju Junye Pharmaceutical Co, Ltd, China. The applied solvent was dimethyl sulfoxide (DMSO, CAS 67-68-5, purity: 99.9%), which was ordered from Sigma-Aldrich Chemicals and used without any further purification. Fig. 1 shows the FNS molecular structure. Carbon dioxide (CO2) with 99.99% purity and CAS Number of 124-38-9 was purchased from Abughaddareh Company (Shiraz, Iran).
2-2. Methods
2-2-1. Experimental procedure
We employed the GAS method to produce fine FNS particles. For this purpose, the drug was dissolved in a polar solvent while supercritical CO2 served as anti-solvent. Alternatively, the solubility power decreased with addition of SC-CO2. Crystallization occurs upon the solution saturation with carbon dioxide under supercritical conditions.
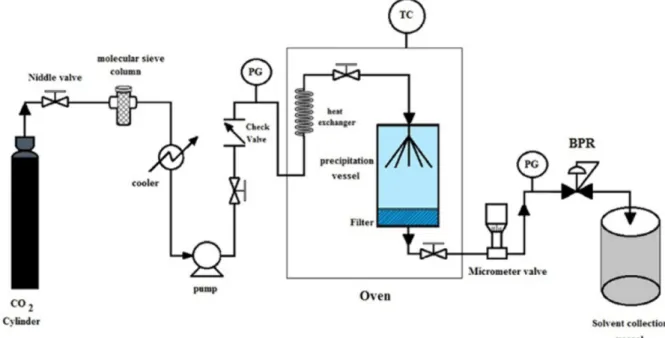
A schematic flow diagram of GAS precipitation is shown in Fig. 2.
At each experiment, the prepared solutions of FNS and dimethyl sulfoxide were loaded into the precipitation chamber. The required gas was supplied by a CO2 tank at a pressure of about 60 bar. First, CO2 was guided through a filter (pore size: 1 μm), then entered to the refrigeration system to compress and convert to liquefied gas by temperature reduction. The pressures of liquefied gas and the CO2 cylinder (60 bar) were equivalent at the refrigeration outlet. Then, the gas was entered into a reciprocating pump for increasing the pressure to the desired value. The pressure transmitter and gauge have an accuracy of ±1 bar. For reaching the desired temperature (308, 318,
Fig. 1. Molecular structure of FNS.
and 328 K), the cell (300 ml) was placed into an oven. The cell was filled with a 3 ml solution for each experimental test. By stabilization of the operation conditions at their set points for the cell, SC-CO2 was pressurized. After reaching the experimental temperature and pressure, the pump was turned off and the solution was preserved in the precipitator up to the saturation of supercritical CO2 with FNS solution for 30 min. When the liquid was pressurized, its volume expanded, which reduced the solvating power of DMSO giving rise to the dissolved solute precipitation. A sinter metal filter placed at the chamber bottom trapped the precipitated materials. Afterward, the passage of 3 g/min CO2 from the chamber top at the constant pressure and flush of the solvent through the filter for 60 min, led to removal of the solvent from the chamber. Finally, the depressurized products were preserved for further analysis. The process parameters and levels are listed in Table 1. In our previous work, the temperature and pressure range of the work was determined based on thermodynamic relations [35].
2-2-2. Particle characterization
We characterized the FNS by FTIR, SEM, DLS, DSC and XRD techniques. To ensure that the drug molecular structure did not change in the procedure, FTIR (Perkin Elmer, RX1, Germany) was employed.
For this purpose, a potassium bromide pellet was created at room temperature and the sample was studied in the wave number range of
400-4000 cm-1 and the resolution of 2 cm-1. SEM (Tescan, Vega 3, Czech Republic) was also done for unprocessed as well as processed FNS particles to examine the shape and morphology of the particles as well as their sizes and size distributions. Before SEM imaging, a gold-palladium alloy was coated on the particles.
A differential scanning calorimeter (DSC, 404 F3 Pegasus from Netzsch; Germany) was applied to characterize the melting points of the unprocessed and the processed FNS powders. DSC graphs were recorded as the specimens were heated from ambient temperature to 400 ºC with a heating rate of 10 ºC/min under nitrogen atmosphere and a flow rate of 10 ml/min.
The size distribution of particles was measured using DLS (Nanophox; Sympatec GmbH System-Partikel-Technik) and compared with the particle size calculated from the SEM images. Before analyzing, FNS (~0.01 g) particles were dissolved in deionized water (10 ml).
The crystallinity of the unprocessed and processed FNS particles was also assessed by XRD (XRD; Philips X’pert Pro MPD) at 2θ range from 5° to 45° and a scan rate of 1.2 deg/min in which a copper anode was used as the radiation source.
2-2-3. Experimental design (BBD) for nanoparticle production via GAS
The systematic methodology for determining the significance of input variables, their interaction and looking for an optimal response is Box-Behnken design (BBD) with response surface procedure [36]. Current work employed a 3 factor-3 level Box–Behnken design for investigating the effect of process factors on the sizes and morphologies of the precipitated FNS particles under various processing situations. The independent variables were x1, x2 and x3 representing pressure, initial solute concentration and temperature, Fig. 2. Process flow diagram of experimental apparatus.
Table 1. Variables and their levels used for Box-Behnken experimental design
Parameters Level 1 Level 2 Level 3
Pressure (bar); x1 100 130 160
Solute concentration (mg/ml); x2 10 25 40
Temperature (K); x3 308 318 328
respectively. Table 1 shows the range and level of differences.
Seventeen runs were implemented with different parameter settings made by the Design-Expert software (version 7.0.0, Stat-Ease Inc., Minneapolis, USA). Regression and graphical analyses were also performed on the obtained data using Design-Expert software. To elucidate the association of independent variables as well as their corresponding dependent variables, experimental data were adapted to the mathematical model. The model goodness of fit was estimated using the coefficient of determination (R2), adjusted R2, predicted R2, F-values as well as analysis of variance (ANOVA). The fitted quadratic model was used to obtain a 3D-plot. Mean particle size (x50) was also determined by DLS. The generalized second-order quadratic polynomial equation, which is usually employed for obtaining the response surfaces, can be expressed as:
y = β0 + Σβixi + Σβiixi2 + Σβijxij (1) where Y shows the process response or output (particle size); xi and xj indicate the uncoded independent variables; β0 denotes a constant named intercept term; and βi, βii and βij represent the coefficients of the linear, quadratic as well as interaction terms, respectively.
3. Results and discussion
In this study, the effect of GAS method parameters including temperature, pressure, and initial solute concentration on the FNS particle size and morphology was investigated by carrying out different experiments. Seventeen experiments were performed to study the effects of these parameters on the FNS particle size through application of the Box-Behnken design with the response surface approach. The response surface method was utilized for describing the effect of independent variables as well as determining the optimal conditions
for achieving the desired responses [37]. The average particle size for unprocessed particles was 55.6 µm. The results are shown in Table 2. All the experiments were done at a constant CO2 flow rate (3 g/min) for 60 min.
3-1. Box-Behnken experimental design and evaluation of the fitted model
A 3-factor 3-level Box-Behnken design including 17 experimental runs was employed to investigate optimal conditions and select the most influential parameters affecting the size and morphology of the FNS particles during the GAS process. Table 2 presents the complete matrix of experimental design using three factors as independent variables as well as responses obtained from experimental runs.
Three variables of pressure (x1), initial solute concentration (x2) and temperature (x3) as well as the experimental results were analyzed by means of response surface methodology to achieve an empirical model resulting in the best response. In this procedure, the association of response and the three independent variables as well as their interactions with regard to coded factors can be represented by:
Y = 780.54−240.15 x1+ 134.24 x2+ 267.61 x3− 9.33 x12−22.17x22
+ 74.59 x32+ 40.76 x1x2 – 59.60 x1x3 + 25.66 x2x3 (2) where Y shows the response (particle size of FNS) and x1, x2 and x3 indicate the coded expression of pressure, initial solute con- centration and temperature, respectively. The optimal values of the selected variables of tests were obtained from Eq. (2) as well as the analysis of response surface plots.
The model qualities were statistically assessed by the findings of the coefficient of determination (R2) and the analysis of variance as can be seen in Table 3. F-value and P-value were used to determine the significance of different coefficients. The statistical significance of a model is associated with a p-value smaller than 0.05 [38-40].
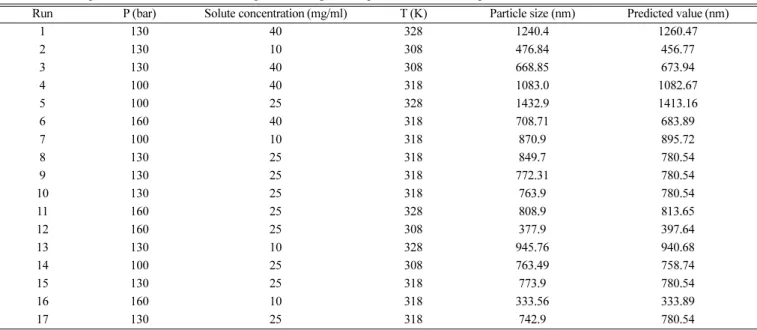
Table 2. The independent variables for the GAS process along with experimental data and predicted BBD
Run P (bar) Solute concentration (mg/ml) T (K) Particle size (nm) Predicted value (nm)
1 130 40 328 1240.4 1260.47
2 130 10 308 476.84 456.77
3 130 40 308 668.85 673.94
4 100 40 318 1083.0 1082.67
5 100 25 328 1432.9 1413.16
6 160 40 318 708.71 683.89
7 100 10 318 870.9 895.72
8 130 25 318 849.7 780.54
9 130 25 318 772.31 780.54
10 130 25 318 763.9 780.54
11 160 25 328 808.9 813.65
12 160 25 308 377.9 397.64
13 130 10 328 945.76 940.68
14 100 25 308 763.49 758.74
15 130 25 318 773.9 780.54
16 160 10 318 333.56 333.89
17 130 25 318 742.9 780.54
Temperature and Pressure uncertainties were 0.1 K and 1 bar.
The large F-values and the small p-values are attributed to the high significance of the corresponding expression [41].
The determination coefficient (R2) was also used to check the model goodness of fit. The higher the values of R-squared (R2) and adjusted R-squared (Adj-R2), the better the association of input parameters and response [39,42]. Joglekar and May[43] suggested that R2 needs to be a minimum of 80% in order to suitably fit the model. Therefore, the proposed model is expected to have high goodness of fit and can well predict the experimental results. P-value
>F-value of the model is 0.0001 (<0.05), indicating the significance of the model. This is profitable because it shows the significant effect of the model terms on the response. The R2 and Adj-R2 are 0.9923 and 0.9824, respectively, reflecting fitting of the experimental data to
the model. Three-dimensional (3D) response surface plots as functions of two factors (other factors remained constant) can be more useful to understand the main effect and interaction influences of them.
Hence, plots of 3D response surfaces for the measured responses were produced using the model equation (Eq. (2)) for gaining an improved understanding of the independent variable influences and the effect of variable interaction on the dependent variables.
Fig. 3 shows the influence of the three independent parameters on the particle size. The temperature and pressure effects on the response at the constant initial solute concentration of 25 mg/ml are represented by Fig. 3a. Elevated temperatures from 308 to 328 K resulted in the increased particle size. Fig. 3b demonstrates the temperature and initial solute concentration effects on the response at the constant pressure of 130 bar. This figure suggests a decline in particle size by a decrease of the primary solute concentration from 10 mg/ml to 40 mg/ml. Fig. 3c indicates the influence of different pressure and initial solute concentration at the constant temperature of 318 K on particle size, which clearly indicates a reduction in particle size by pressure enhancement from 100 to 160 bar. Design-Expert software as 308 K, 160 bar, and 10 mg/ml was used to calculate the optimal amount of independent variables. The resulting particle sizes at the optimal settings (226.5 nm) were close to those of the experimental data (232.4 nm). The original size and morphology of FNS are shown in Fig. 4.
3-2. Effect of operating conditions on particle size 3-2-1. Effect of pressure
As illustrated in Fig. 3a and Table 2 obtained from Box-Behnken experimental design, the experiments were carried out at various pressures (100, 130 and 160 bar), temperatures (308, 318 and 328 K) as well as primary FNS concentrations (10, 25 and 40 mg/ml).
According to Fig. 3a, the average particle size decreased when pressure was increased from 10 to 160 bar. This can be explained by the fact that, the increased pressure will enhance the CO2 density and hence
Fig. 3. The 3D-plots (a) the influence of temperature and pressure at the fixed concentration 25 mg/ml (b) the influence of sol- ute concentration and temperature at the fixed pressure 130 bar (c) the influence of solute concentration and pressure at
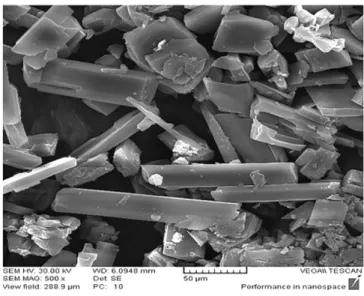
the fixed temperature of 318 K on particle size. Fig. 4. SEM images for the original FNS.
the solubility of FNS in SC-CO2 will be augmented. As a result of this pressure increase, the FNS concentration will be improved, leading to greater super saturation and nucleation rate and creation of reduced-size particles. SEM and DLS result also confirmed this observation (as shown in Fig. 5a, b and Fig. 9a, b respectively). Jafari et al. [44] and Esfandiari et al. [45,46] reported comparable results for the micronization of aspirin, ampicillin and 5-Fluorouracil, respectively.
3-2-2. Effect of temperature
Many studies have addressed the effect of temperature in the GAS process, Esfandiari et al. [45-47] and Kim et al. [21], to name a few.
Elevated temperatures result in enhancements in solute vapor pressures, giving rise to improved solubility. On the other hand, when temperature increases, the CO2 density reduces and lowers the CO2 strength, which in turn can decrease the solubility and supersaturation. As it can be understood from classical nucleation theory, the critical size of nuclei decreases by supersaturation increase, and therefore particle size will be reduced. As shown in Fig. 3b, with increase of temperature from 308 to 328 K, the average size of particles also increased, implying a reduction in the CO2 density and hence the solubility of FNS particles. In fact, by decline of solubility, supersaturation will be decreased, leading to the production of bigger particles (Fig. 5c, d &
Fig. 9c, d).
3-2-3. Effect of initial FNS concentration
In order to study the effect of primary concentration of FNS on the particle size of FNS, experiments were performed at three different concentrations (10, 25 and 40 mg solute /ml solution). As shown in Table 2 and Fig. 3c, by elevation of FNS concentration in the solution, particles with larger mean size were obtained. The effect of concentration on the size of particles can be described by nucleation
and growth process. In fact, at a higher initial FNS concentration, precipitation will occur in less expanded volumes. Thus, the nuclei are allowed to form growing crystals, which will cause larger particles over a long period time. On the other hand, by decreasing the FNS concentration, solute precipitation will take place in more expanded volumes, resulting in the reduced-size particles (Fig. 5c, e and Fig. 9 c, e). Comparable findings are also reported by Jafari et al. [44], Esfandiari et al. [45], Chen et al. [48] and Bakhbakhi et al. [49]
which show the influence of FNS concentration on the mean size as well as size distribution of particles during GAS procedure. Their reports showed the increase of mean particle diameter with an increase in the concentration.
3-3. Optimum conditions
The optimum condition for obtaining the smallest size of particles was found by BBD method utilized in Design Expert 7.0.0 software.
The optimal condition involved: initial FNS concentration, 10 mg/ml;
temperature, 308 K, and pressure, 160 bar. These values were predicted to result in particle size of 226.5 nm. Using BBD method, the accuracy and validity of the optimization technique were evaluated through investigations. Consequently, the average size of particles was obtained as 232.4 nm, which is comparable to the expected amount.
3-4. Solid state characterization
FTIR spectra were obtained for the wavenumber range of 400- 4000 cm-1 for investigating the surface composition and chemical bonds of the processed and unprocessed FNS particles. Figs. 6a and b show the FTIR spectra of the unprocessed as well as processed FNS specimens, respectively. Comparison of the FTIR spectra of original (unprocessed) and GAS processed samples indicated no wavenumber shift or variation in the absorption peaks of the functional groups. Characteristic peaks of possessed FNS in 1682 Table 3 Analysis of variance (ANOVA) for quadratic model.
Source Sum of squares Mean square F-value P-value
Intercept
x1 4.614E+005 4.614E+005 339.88 <0.0001
x2 1.442E+005 1.442E+005 106.20 <0.0001
x3 5.729E+005 5.729E+005 422.05 0.0001
x1x2 6646.81 6646.81 4.90 0.0625
x1x3 14209.99 14209.99 10.47 0.0143
x2x3 2632.83 2632.83 1.94 0.2064
x12 366.74 366.74 0.27 0.6192
x22 2068.86 2068.86 1.52 0.2568
x32 23424.28 23424.28 17.26 0.0043
Model 1.227E+006 1.363E+005 100.43 <0.0001
Residual 9502.38 1357.48
Lack of fit 2913.85 971.28 0.59 0.653
Pure error 6588.53 1647.13
Total 1.236E+006
Quadratic PRESS Adj R-Squared Pred R-Squared Adeq Precision Std. Dev.
56916.49 0.9824 0.9540 3.194 3.684
cm-1, 2376 cm-1, 2866–2968 cm-1, and 3238 cm-1 are attributed to the stretching vibrations in C=O, C=C, asymmetric and symmetric C-H and N-H bonds, respectively. Other researchers have reported the
same results as well [50,51].
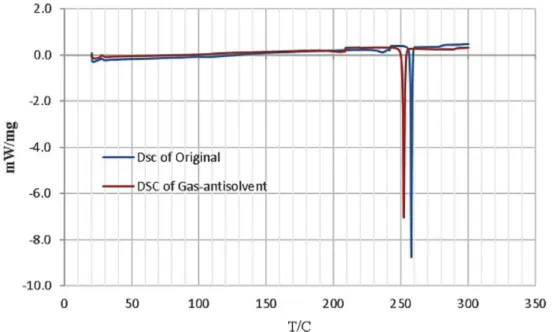
Thermal studies of the processed and original particles were carried out by DSC analysis. According to Fig. 7, the melting point Fig. 5. SEM images for various cases (based on Table 2): (a) Run 4, (b) Run 6, (c), Run 2, (d) Run 13, (e) Run 3 and (f) R-Optimum.
of unprocessed FNS was found to be 257.7oC, while the GAS- processed FNS exhibited a melting point of 252.1oC. Other scholars observed comparable behavior for samples processed by dense CO2 [52-54]. This difference in melting point can be related to the increased accessible surface for heat transmission and variation of crystalline
structures or in the decreased average size of the processed particles.
Additionally, Fig. 8a and b show the patterns of the unprocessed and the GAS-processed particles that also confirm the DSC and XRD results.
XRD is one of the powerful analyses to study sample crystallinity.
Fig. 6. Comparison of the FTIR spectrum of a) original (Black) and b) GAS processed FNS (Blue).
Fig. 7. DSC analysis results of FNS before and after the processes: a) original FNS and b) GAS processed FNS.
As shown in Fig. 8a and b, XRD patterns of GAS-processed FNS are comparable to those of the original FNS particles, demonstrating their similar crystal structure. In Fig. 8b, a reduction can be seen in degree of crystallinity, for identical wavelengths and diffraction angles.
Such a small reduction in the processed FNS particle XRD peaks intensity can be due to the particle size reduction after the GAS process.
As other researchers have also presented, one reason for the declining intensity of peaks in XRD pattern is the reduced particle size or transition of crystals to amorphous state [55,56]. Comparable results have been reported by other researchers [57-61].
SEM is a popular technique for characterizing the size and morphology of particles. As shown in Fig. 4, the un-processed particles had an irregular shape. However, the GAS process resulted in formation of the quasi-spherical particles (Fig. 5). The unprocessed and processed particles were also evaluated using DLS analysis. As DLS analysis shows (Fig. 9), the size distribution of nanoparticles was 234.2 nm, which is narrower compared to that of the original FNS which is in the range of 124.5~35.6 μm with the mean of 55.6 μm.
4. Conclusion
FNS nanoparticles were prepared by the GAS process for the first time. The effects of GAS parameters like temperature, pressure as well as initial FNS concentration on the size of particles were studied. The effect of each variable was determined at three levels. It was found from the results that the average size and size distribution of particles can be effectively controlled by the variables of the GAS procedure. Box-Behnken experimental design was also employed to optimize the particle size. As temperature increased from 308 to 328 K, the particles got larger;
while the pressure increase from 100 to 160 bar resulted in a slight reduction of the particle size. Initial FNS concentration enhancement from 10 to 40 mg/ml led to larger particles. The average size of particles at the highest pressure (160 bar) was 232.4 nm. The increase in the pressure resulted in the smaller average size of particles. Small particles were also attributed to the low temperature (308 K) as well as low primary solute concentration (10 mg/ml). FTIR and XRD analyses do not revealed any significant Fig. 8. XRD patterns of FNS before and after the processes: a) original, b) GAS processed.
change in the chemical structure of FNS and its initial chemical structure remained intact. This study recommends the GAS process as a promising method to significantly reduce the size of pharmaceutical particles, to improve their dissolution rate as well as bioavailability.
References
1. Nguyen, T. T. L., Anton, N. and Vandamme, T. F., “Oral Pellets Loaded with Nanoemulsions,” Nanostructures for Oral Medi- cine, 203-230(2017).
2. Ku, M. S. and Dulin, W., “A Biopharmaceutical Classification- Fig. 9. DLS graphs for various conditions for GAS process (based on Table 2): (a) Run 4, (b) Run 6, (c), Run 2, (d) Run 13, (e) Run 3 and (f)
R-Optimum.
based Right-First-Time Formulation Approach to Reduce Human Pharmacokinetic Variability and Project Cycle Time from First- In-Human to Clinical Proof-of-Concept,” Pharm.Dev. Tech., 17(3), 285-302(2012).
3. Khadka, P., Ro, J., Kim, H., Kim, I., Kim, J. T., Kim, H., Cho, J.
M., Yun, G. and Lee, J., “Pharmaceutical Particle Technologies:
An Approach to Improve Drug Solubility, Dissolution and Bio- availability,” Asian J. Pharm. Sci., 9(6), 304-316(2014).
4. Krishnaiah, Y. S., “Pharmaceutical Technologies for Enhancing Oral Bioavailability of Poorly Soluble Drugs,” J. Bioequiv. Availab., 2(2), 28-36(2010).
5. Sharma, D., Soni, M., Kumar, S. and Gupta, G., “Solubility Enhancement-eminent Role in Poorly Soluble Drugs,” Res. J.
Pharm. and Technol., 2(2), 220-224(2009).
6. Kumar, A., Sahoo, S. K., Padhee, K., Kochar, P., Sathapathy, A.
and Pathak, N., “Review on Solubility Enhancement Techniques for Hydrophobic Drugs,” Pharmacie Globale, 3(3), 1-7(2011).
7. Ridhurkar, D. N., Ansari, K. A., Kumar, D., Kaul, N. S., Krish- namurthy, T., Dhawan, S. and Pillai, R., “Inclusion Complex of Aprepitant with Cyclodextrin: Evaluation of Physico-chemical and Pharmacokinetic Properties,” Drug Dev. Ind. Pharm., 39(11), 1783-1792(2013).
8. Liu, J., Zou, M., Piao, H., Liu, Y., Tang, B., Gao, Y., Ma, N. and Cheng, G., “Characterization and Pharmacokinetic Study of Aprepitant Solid Dispersions with Soluplus®,” Molecules, 20(6), 11345-11356(2015).
9. Nokhodchi, A., Javadzadeh, Y., Siahi-Shadbad, M. R. and Barzegar-Jalali, M., “The Effect of Type and Concentration of Vehicles on the Dissolution Rate of a Poorly Soluble Drug (indomethacin) from Liquisolid Compacts,” J. Pharm. Sci., 8(1), 18-25(2005).
10. Humberstone, A. J. and Charman, W. N., “Lipid-based Vehicles for the Oral Delivery of Poorly Water Soluble Drugs,” Adv. Drug Delivery Reviews, 25(1), 103-128(1997).
11. Bolten, D. and Türk, M., “Micronisation of Carbamazepine Through Rapid Expansion of Supercritical Solution (RESS),” J.
Supercri. Fluids, 62, 32-40(2012).
12. Cheng, S. H., Yang, F. C., Yang, Y. H., Hu, C. C. and Chang, W.
T., “Measurements and Modeling of the Solubility of Ergosterol in Supercritical Carbon Dioxide,” J. Taiwan Ins. Chem. Eng., 44(1), 19-26(2013).
13. Knez, Z. and Weidner, E., “Particles Formation and Particle Design Using Supercritical Fluids,” Curr. Opin. Solid State Mater. Sci., 7(4-5), 353-361(2003).
14. Hiendrawan, S., Veriansyah, B. and Tjandrawinata, R. R., “Micron- ization of Fenofibrate by Rapid Expansion of Supercritical Solu- tion,” J. Ind. Eng. Chem., 20(1), 54-60(2014).
15. Fahim, T., Zaidul, I., Bakar, M.A., Salim, U., Awang, M., Sahena, F., Jalal, K., Sharif, K. and Sohrab, M., “Particle Formation and Micronization Using Non-conventional Techniques-review,” Chem.
Eng. Process. Process Intensification, 86, 47-52(2014).
16. Sodeifian, G. and Sajadian, S. A., “Utilization of Ultrasonic- assisted RESOLV (US-RESOLV) with Polymeric Stabilizers for Production of Amiodarone Hydrochloride Nanoparticles: Opti- mization of the Process Parameters,” Chem. Eng. Res. Des., 142, 268-284(2019).
17. Sodeifian, G., Sajadian, S. A., Ardestani, N. S. and Razmimanesh,
F., “Production of Loratadine Drug Nanoparticles Using Ultra- sonic-assisted Rapid Expansion of Supercritical Solution Into Aqueous Solution (US-RESSAS),” J. Supercri. Fluids, 147, 241- 253(2019).
18. Esfandiari, N., “Production of Micro and Nano Particles of Phar- maceutical by Supercritical Carbon Dioxide,” J. Supercri. Fluids, 100, 129-141(2015).
19. Jafari, D., Nowee, S. and Noie, S., “A Kinetic Modeling of Par- ticle Formation by Gas Antisolvent Process: Precipitation of Aspirin,” J. Dispersion Sci. Technol., 38(5), 677-685(2017).
20. Foster, N. R., Kurniawansyah, F., Tandya, A., Delgado, C. and Mammucari, R., “Particle Processing by Dense Gas Antisolvent Precipitation: ARISE Scale-up,” Chem. Eng. J., 308, 535-543(2017).
21. Kim, S.-J., Lee, B.-M., Lee, B.-C., Kim, H.-S., Kim, H. and Lee, Y.-W., “Recrystallization of Cyclotetramethylenetetranitramine (HMX) Using Gas Anti-solvent (GAS) Process,” J. Supercri.
Fluids, 59, 108-116(2011).
22. Park, S.-J. and Yeo, S.-D., “Recrystallization of Caffeine Using Gas Antisolvent Process,” J. Supercri. Fluids, 47(1), 85-92(2008).
23. Wichianphong, N. and Charoenchaitrakool, M., “Application of Box-Behnken Design for Processing of Mefenamic Acid-parac- etamol Cocrystals Using Gas Anti-solvent (GAS) Process,” J.
CO2 Uti., 26, 212-220(2018).
24. Kim, S., Lee, S.J., Seo, B., Lee, Y.-W. and Lee, J. M., “Optimal Design of a Gas Antisolvent Recrystallization Process of Cyclo- tetramethylenetetranitramine (HMX) with Particle Size Distribu- tion Model,” Ind. Eng. Chem. Res., 54(44), 11087-11096(2015).
25. Ulker, Z. and Erkey, C., “An Advantageous Technique to Load Drugs Into Aerogels: Gas Antisolvent Crystallization Inside the Pores,” J. Supercri. Fluids, 120, 310-319(2017).
26. Dittanet, P., Phothipanyakun, S. and Charoenchaitrakool, M.,
“Co-precipitation of Mefenamic Acid-polyvinylpyrrolidone K30 Composites Using Gas Anti-Solvent,” J. Taiwan Ins. Chem. Eng., 63, 17-24(2016).
27. Lőrincz, L., Bánsághi, G., Zsemberi, M., de Simón Brezmes, S., Szilágyi, I. M., Madarász, J., Sohajda, T. and Székely, E., “Dias- tereomeric Salt Precipitation Based Resolution of Ibuprofen by Gas Antisolvent Method,” J. Supercri. Fluids, 118, 48-53(2016).
28. Zodge, A., Kőrösi, M., Madarász, J., Szilágyi, I. M., Varga, E.
and Székely, E., “Gas Antisolvent Fractionation: A New Approach for the Optical Resolution of 4-chloromandelic Acid,” Period.
Polytech. Chem. Eng., 63(2), 303-311(2019).
29. Mihalovits, M., Horváth, A., Lőrincz, L., Székely, E. and Kemény, S., “Model Building on Selectivity of Gas Antisolvent Fraction- ation Method Using the Solubility Parameter,” Period. Polytech.
Chem. Eng., 63(2), 294-302(2019).
30. Pessoa, A. S., Aguiar, G. P. S., Oliveira, J. V., Bortoluzzi, A. J., Paulino, A. and Lanza, M., “Precipitation of Resveratrol-isoniazid and Resveratrol-nicotinamide Cocrystals by Gas Antisolvent,” J.
Supercri. Fluids, 145, 93-102(2019).
31. Gil-Ramírez, A. and Rodriguez-Meizoso, I., “Purification of Natural Products by Selective Precipitation Using Supercritical/
Gas Antisolvent Techniques (SAS/GAS),” Sep. Purif. Rev., 1-21(2019).
32. Almeida, H. M. and Marques, H. M. C., “Physicochemical Charac- terization of Finasteride: PEG 6000 and Finasteride: Kollidon K25 Solid Dispersions, and Finasteride: β-cyclodextrin Inclusion Complexes,” J. Inclusion Phenom. Macrocyclic Chem., 70(3-4),
397-406(2011).
33. Ahmed, T. A. and Al-Abd, A. M., “Effect of Finasteride Parti- cle Size Reduction on Its Pharmacokinetic, Tissue Distribution and Cellular Permeation,” Drug Del., 25(1), 555-563(2018).
34. Yamini, Y., Kalantarian, P., Hojjati, M., Esrafily, A., Moradi, M., Vatanara, A. and Harrian, I., “Solubilities of Flutamide, Dutasteride, and Finasteride as Antiandrogenic Agents, in Supercritical Carbon Dioxide: Measurement and Correlation,” J. Chem. Eng. Data, 55(2), 1056-1059(2009).
35. Najafi, M., Esfandiari, N., Honarvar, B. and Arab Aboosadi, Z.,
“Thermodynamic Modeling of the Gas-Antisolvent (GAS) Pro- cess for Precipitation of Finasteride,” J. Chem. Pet. Eng., 54, 297-309(2020).
36. Tafreshi, N., Sharifnia, S. and Dehaghi, S. M., “Box-Behnken Experimental Design for Optimization of Ammonia Photocatalytic Degradation by ZnO/Oak Charcoal Composite,” Process Saf.
Environ. Prot., 106, 203-210(2017).
37. Granato, D. and de Araújo Calado, V. M., “The Use and Impor- tance of Design of Experiments (DOE) in Process Modelling in Food Science and Technology,” Math. Statistical Methods Food Sci. Technol., 1, 1-18(2014).
38. Cui, F., Li, Y., Xu, Z., Xu, H., Sun, K. and Tao, W., “Optimization of the Medium Composition for Production of Mycelial Biomass and Exo-polymer by Grifola Frondosa GF9801 Using Response Surface Methodology,” Bioresour. Technol., 97(10), 1209-1216 (2006).
39. Kim, H., Kim, J., Cho, J. and Hong, J., “Optimization and Char- acterization of UV-curable Adhesives for Optical Communications by Response Surface Methodology,” Polym. Test., 22(8), 899-906 (2003).
40. Mondal, M., Ghosh, A., Gayen, K., Halder, G. and Tiwari, O.,
“Carbon Dioxide Bio-fixation by Chlorella sp. BTA 9031 Towards Biomass and Lipid Production: Optimization Using Central Composite Design Approach,” J. CO2 Utilization, 22, 317-329(2017).
41. Anuar, N., Mohd Adnan, A. F., Saat, N., Aziz, N. and Mat Taha, R., “Optimization of Extraction Parameters by Using Response Surface Methodology, Purification, and Identification of Antho- cyanin Pigments in Melastoma Malabathricum Fruit,” Sc. World J., 2013, 1-10(2013).
42. Nam, S.-N., Cho, H., Han, J., Her, N. and Yoon, J., “Photocata- lytic Degradation of Acesulfame K: Optimization Using the Box-Behnken Design (BBD),” Proc. Saf. Environ. Prot., 113, 10- 21(2018).
43. Joglekar, A. and May, A., “Product Excellence Through Design of Experiments,” Cereal Foods World, 32(12), 857(1987).
44. Jafari, D., Yarnezhad, I., Nowee, S. M. and Baghban, S. H. N.,
“Gas-antisolvent (GAS) Crystallization of Aspirin Using Super- critical Carbon Dioxide: Experimental Study and Characteriza- tion,” Ind. Eng. Chem. Res., 54(14), 3685-3696(2015).
45. Esfandiari, N. and Ghoreishi, S. M., “Ampicillin Nanoparticles Production via Supercritical CO2 Gas Antisolvent Process,” AAPS Pharm. Sci. Tech., 16(6), 1263-1269(2015).
46. Esfandiari, N. and Ghoreishi, S. M., “Synthesis of 5-fluorouracil Nanoparticles via Supercritical Gas Antisolvent Process,” J.
Supercri. Fluids, 84, 205-210(2013).
47. Esfandiari, N. and Ghoreishi, S. M., “Kinetics Modeling of Ampicillin Nanoparticles Synthesis via Supercritical Gas Anti-
solvent Process,” J. Supercri. Fluids, 81, 119-127(2013).
48. Chen, K., Zhang, X., Pan, J., Zhang, W. and Yin, W., “Gas Anti- solvent Precipitation of Ginkgo Ginkgolides with Supercritical CO2,” Powder Technol., 152(1-3), 127-132(2005).
49. Bakhbakhi, Y., Charpentier, P. A. and Rohani, S., “Experimental study of the GAS Process for Producing Microparticles of Beclo- methasone-17, 21-dipropionate Suitable for Pulmonary Deliv- ery,” Int. J. Pharm., 309(1-2), 71-80(2006).
50. Fagir, W., Hathout, R. M., Sammour, O. A. and ElShafeey, A. H.,
“Self-microemulsifying Systems of Finasteride with Enhanced Oral Bioavailability: Multivariate Statistical Evaluation, Charac- terization, Spray-drying and in vivo Studies in Human Volun- teers,” Nanomedicine, 10(22), 3373-3389(2015).
51. Ahmed, T. A., “Preparation of Finasteride Capsules-loaded Drug Nanoparticles: Formulation, Optimization, in vitro, and Pharma- cokinetic Evaluation,” Int. J. Nanomedicine, 11, 515(2016).
52. Sodeifian, G. and Sajadian, S. A., “Solubility Measurement and Preparation of Nanoparticles of an Anticancer Drug (Letrozole) Using Rapid Expansion of Supercritical Solutions with Solid Cosolvent (RESS-SC),” J. Supercri. Fluids, 133, 239-252(2018).
53. Paisana, M. C., Müllers, K. C., Wahl, M. A. and Pinto, J. F., “Pro- duction and Stabilization of Olanzapine Nanoparticles by Rapid Expansion of Supercritical Solutions (RESS),” J. Supercri. Flu- ids, 109, 124-133(2016).
54. Ciou, J. L. and Su, C. S., “Measurement of Solid Solubilities of Diuron in Supercritical Carbon Dioxide and Analysis of Recrys- tallization by Using the Rapid Expansion of Supercritical Solu- tions Process,” J. Supercri. Fluids, 107, 753-759(2016).
55. Thakur, R. and Gupta, R. B., “Rapid Expansion of Supercritical Solution with Solid Cosolvent (RESS-SC) Process: Formation of Griseofulvin Nanoparticles,” Ind. Eng. Chem. Research, 44(19), 7380-7387(2005).
56. Sodeifian, G., Ardestani, N. S., Sajadian, S. A. and Panah, H. S.,
“Experimental Measurements and Thermodynamic Modeling of Coumarin-7 Solid Solubility in Supercritical Carbon Dioxide:
Production of Nanoparticles via RESS Method,” Fluid Phase Equilib., 483, 122-143(2019).
57. Sodeifian, G., Sajadian, S. A. and Daneshyan, S., “Preparation of Aprepitant Nanoparticles (efficient drug for coping with the effects of cancer treatment) by Rapid Expansion of Supercritical Solu- tion with Solid Cosolvent (RESS-SC),” J. Supercri. Fluids, 140, 72-84(2018).
58. Keshavarz, A., Karimi-Sabet, J., Fattahi, A., Golzary, A., Rafiee- Tehrani, M. and Dorkoosh, F. A., “Preparation and Characteriza- tion of Raloxifene Nanoparticles Using Rapid Expansion of Super- critical Solution (RESS),” J. Supercri. Fluids, 63, 169-179(2012).
59. Yildiz, N., Tuna, Ş., Döker, O. and Çalimli, A., “Micronization of Salicylic Acid and Taxol (paclitaxel) by Rapid Expansion of Supercritical Fluids (RESS),” J. Supercri. Fluids, 41(3), 440-451 (2007).
60. Ameri, A., Sodeifian, G. and Sajadian, S. A., “Lansoprazole Load- ing of Polymers by Supercritical Carbon Dioxide Impregnation:
Impacts of Process Parameters,” J. Supercri. Fluids, 104892(2020).
61. Ardestani, N. S., Sodeifian, G. and Sajadian, S. A., “Preparation of Phthalocyanine Green Nano Pigment Using Supercritical CO2 Gas Antisolvent (GAS): Experimental and Modeling,” Heliyon, 6(9), e04947(2020).