A Study on the Visualization of Temperature Field Using Neural Network
신경회로망을 이용한 온도장 가시화에 관한 연구
C. J. Lee
*, D. S. Bae
**†이철재
*․배대석
**†(received 26 August 2011, revised 02 April 2012, accepted 10 April 2012)
Key Words:신경회로망(Neural Network), 감온액정(Thermo-sensitive Liquid Crystal), 온도장(Temperature Field)
Abstract:감온액정을 추적입자로 사용한 PIV(Particle Image Velocimetry)법이 온도장을 정량적으로 가시화하 기 위하여 사용되었다. 이 방법은 전체 유동장과 온도장을 동시에 계측할 수 있는 방법이지만, 온도장의 온 도는 온도에 따라 변화되는 액정의 색을 정량적 온도 값으로 변환시켜야한다. 따라서 본 연구에서는 감온액 정에 의한 온도장의 광학적 정보를 정량적 온도로 변환시키는 신경회로망 보정기법을 개발하여 그 타당성 을 검토한 후, 수직온도구배를 가진 액체의 기포에 의한 대류유동에 적용하여 기포에 의한 온도혼합과정을 정량적으로 가시화하고자 한다.
**배대석(교신저자) : 부경대학교 기계공학과 E-mail : [email protected], Tel : 051-629-6138
*이철재 : 동명대학교, 자동차공학과
**D. S. Bae(corresponding author) : Department of Refrigeration and Air-Conditioning Engineering, Pukyong National University.
E-mail : [email protected], Tel : 051-629-6138
*C. J. Lee : Department of Automotive Engineering, TongMyong University
1. Introduction
The efforts for the quantitative evaluation of the temperature field have been conducted by many researchers.1∼4) The thermo-sensitive liquid crystals have been successfully used for visualizing temperature field. The color of the liquid crystals changes quickly, when they are lightened by white light, from red to blue through green as the temperature increases. In order to quantify the visualized color image of liquid crystals, it is needed the color-to-temperature transformation. However, its strong nonlinear characteristic between the color and temperature makes it difficult to obtain an exact equation for the color-to-temperature transformation. Recently the neural network calibration technique was proposed to overcome the non-linearity of the optical characteristics of liquid crystal in RGB color space.5) We applied this technique to the
bubbly flow in a stratified temperature environment. While the presented technique is not entirely new, we have tried to present a clear concept of the technique and offer some novel ideas in solving various technical problems in measuring color through image processing techniques.
There are many papers on bubbly flow.6∼8) These works are mainly concentrated on plume itself and isothermal environment. When a bubbly flow is used in the lake or metallurgical furnaces, which is affected by the stratified temperature.
Recently, only a few authors analyzed the interaction of the bubble plume with a stratified environment.9∼10) However, The transient flow and the thermal stratification effect of bubbly flow were not accomplished experimentally in these works. Therefore, it appears quite useful to perform supplementary experiments to investigate these details and understand the transient behavior
of bubbly flow in a stratified temperature environment.
The purposes of the present study is to evaluate the performance of the calibration technique with neural network based on the experimental optical date of liquid crystals, to visualize the complex structures of the temperature field of bubbly flow in a viscous fluid quantitatively, and to analyze the transient temperature patterns of bubbly flow.
2. Experimental setup and method
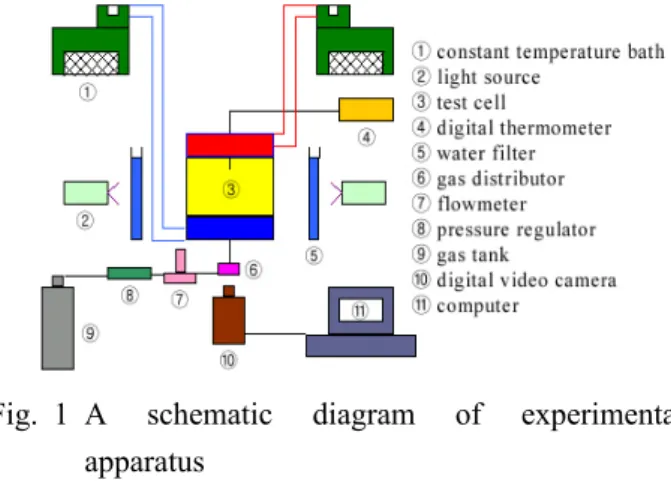
The experimental apparatus of the present study is shown schematically in Fig. 1. It comprises a test cell, two constant temperature baths, two light sources, two water filters, a gas distributor, a flowmeter, a gas tank, a digital thermometer with thermocouple, a digital video camera, and a computer. The test cell is composed of two horizontal isothermal 23mm thick copper plates placed at the top and bottom side of the cell and four vertical 10mm thick acrylic resin plates for flow visualization purpose. The inside dimensions of the test cell are 200 mm☓100mm☓12mm(width
☓height☓depth).
To investigate bubbly flow in a vertical temperature gradient, a fluid temperature is stratified by two horizontal copper plates. The upper(hot) and the lower(cold) copper plates are maintained at constant temperature with a water flow which passes between over copper plate and bellow one. The water temperatures are controlled by two constant temperature baths (Taitec EL-15F).
Fig. 1 A schematic diagram of experimental apparatus
The temperatures of the copper surface are measured using k-type thermocouples connected to a digital thermometer (TR2114).
The upper copper plate has one 2mm diameter hole at the center to measure the fluid temperature. The lower copper plate that has three holes at the center is used for bubble injection.
The injector has a 0.2mm in diameter and 80mm long brass needle, and is connected via acrylic tube to the gas distributor. Silicon oil is used as a working fluid because a combination of silicon oil and the cholesteric liquid crystals gives a very vivid color. The flow field is illuminated with a white light sheet having 3mm in thickness from two metal halide lamps that are located at the both sides of the test cell. A water filter is placed in front of each lamp to prevent excessive radiant heat transfer from the lamp to the working fluid.
The reflected light is observed by a 3-CCD digital color video camera(SONY). The recorded images are stored on the hard disk of a computer for evaluation. The observation axis of a camera was normal to the light sheet plane. The temperature and velocity fields were measured from the liquid crystals suspended as tracer particles in the fluid.
The liquid crystal used in this experiment is cholesteric type RM2830(Japan Capsular Products Inc). The concentration of liquid crystals within the working fluid is about 0.1 percent weight.
The illumination and image capture systems including the test cell were fixed to avoid uncertainties due to variations of the viewing angle during the experiment and calibration procedure. Detailed information concerning the characteristics of liquid crystals can be found in Dabiri, D. and Gharib, M.11) The experimental procedure is as follows. At the beginning of each experiment, the old liquid inside a cell is drained, and the cell is cleaned and rinsed thoroughly with a soap and water. The cell is then assembled and filled with silicon oils carefully. The constant temperature baths are turned on to heat the lower copper plate and to cool the upper one. When the natural convection is fully developed in the cell,
the liquid crystal tracers mixed with silicon oils are slowly inserted into the fluid zone in the test cell. After the liquid crystal tracers are well mixed in the whole region of the test cell, the constant temperature baths are readjusted to fit the upper and lower plates of the cell to the desired temperature. After several hours, when the vertical temperature gradient field is established, the bubble is injected into the cell, then the temperature and velocity patterns are recorded by 3-CCD digital video camera.
3. Transformation of color to temperature
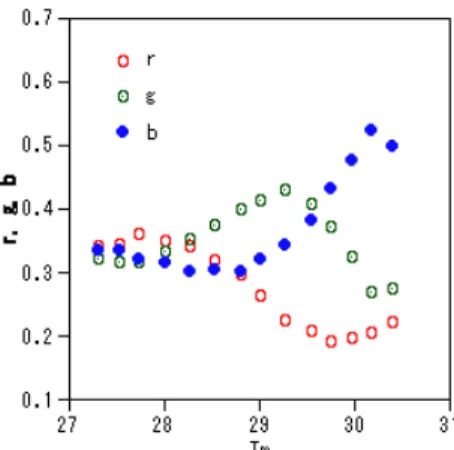
In order to obtain quantitative thermal flow visualization, liquid crystal tracers are used. The relationship between color and temperature of liquid crystal is obtained by the calibration. The calibration is performed in the stratified temperature field. The results of the calibration experiment are shown in Fig. 2, which are the relationship of the r(red), g(green), and b(blue) versus the measured temperature Tm. These values are obtained as follows; at first, the colors of liquid crystal tracers are visualized by using two metal halide lamps. Then the visualized color image is taken by 3-CCD digital color video camera, and the values of R, G, and B are obtained from the color image. The obtained values of R, G, and B are normalized as r, g, and b in Eq. (1). At the same time, the temperature Tm
is measured by a k-type thermocouple.
r=R/(R+G+B)
g=G/(R+G+B b=B/(R+G+B) (1) In Fig. 2, the relationship between r, g, b, and the temperature Tm shows a strong nonlinear characteristic. This makes it difficult to obtain an exact equation for color-to-temperature transformation. In this study, a neural network is employed to formularize the color-to-temperature relationship, which was proposed by Kimura et al.4)
Fig. 2 Relation between r, g, b and temperature Tm
Fig. 3 shows the structure of multi-layer feed forward neural network. The inputs of the network are r, g, and b values. The output is the temperature Tc. The network consists of multi layers, namely, an input, multi hidden, and an output layer. The three units in the input layer are linear devices and the multi units in the multi-hidden layer and one unit in the output layer are neurons. A simple neuron model is shown in Fig. 4. This is the basic unit of neural network, which performs a nonlinear transformation of the sum of weighted inputs to produce the output of the neuron. The sum of weighted inputs
u
isgiven by
Fig. 3 Neural network structure
θ w
ix
iy
Fig. 4 Neuron
∑
=+
= n
i i ix w u
1
θ
(2)where xi is an input to the neuron, wi is the connected weight, and θ is the bias. The output y is expressed as
) exp(
1 ) 1
( u u
f
y = = + −
(3)
••
••
••
••
••
••
••
••
••
••
••
••
•
27 28 29 30 31
27 28 29 30 31
Tm
(a) ni=1000
••
••
••
••
••
••
••
••
••
••
••
••
•
27 28 29 30 31
27 28 29 30 31
Tm
(b) ni=10000
••
••
••
•
••
••
••
••
••
••
••
••
••
27 28 29 30 31
27 28 29 30 31
Tm
(c) ni=300000
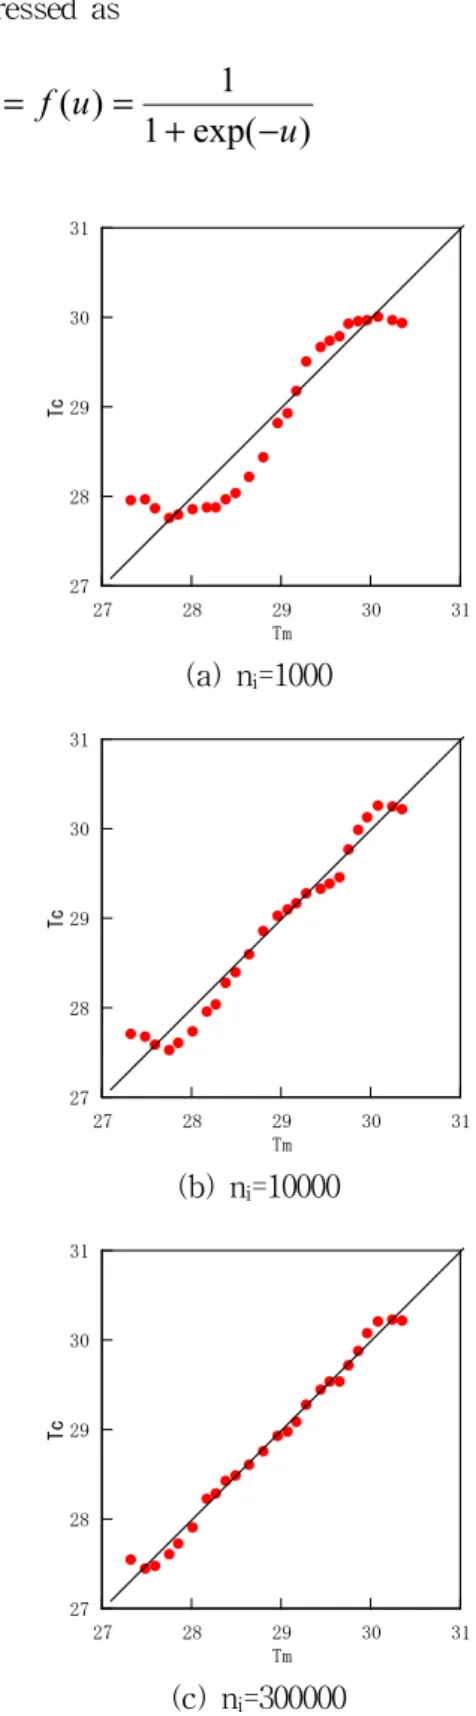
Fig. 5 The effect of iteration number on results of neural network calibration
And this is termed a sigmoidal function.
Learning for the neural network is carried out in order to agree the output Tc corresponding to the inputs of r, g, and b patterns with the measured temperature Tm. Therefore, it can be said that learning is to seek for the values of the connected weight wi and the bias θ to minimize the following error function E .
)2
2 ( 1
m
c T
T
E =
∑
− (4)The back-propagation algorithm is used for learning of the neural network.
4. Results and discussion
Fig. 5 shows the effect of iteration on the relationship between the measured temperature Tm
and neural network output Tc. The value Tc
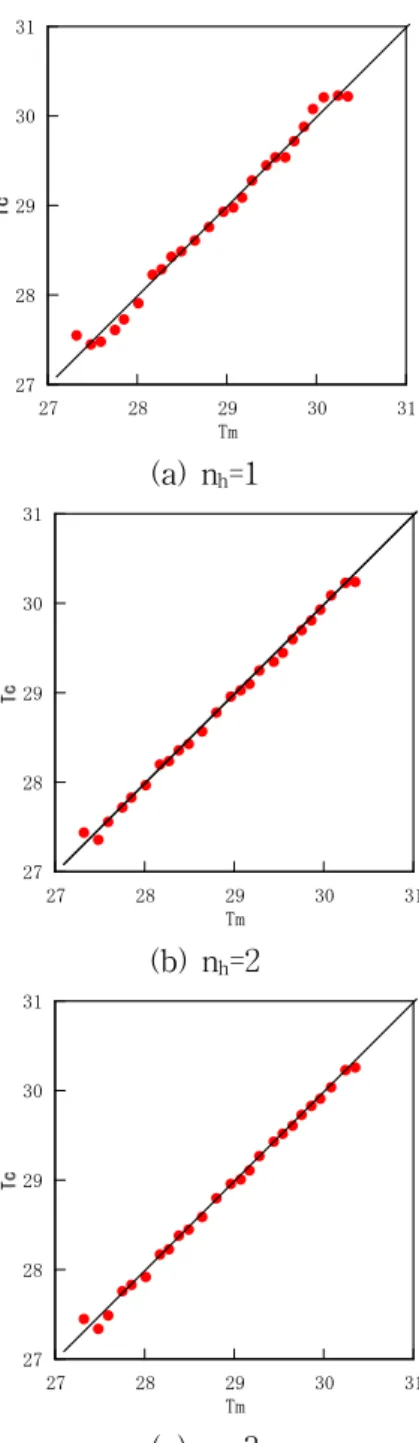
agrees well with Tm almost over the entire range after iterating 300000 of neural network. Fig. 6 shows the effect of unit on the relationship between the measured temperature Tm and neural network output Tc. As the numbers of unit increase, the value Tc agrees well with Tm, but the effect is not significant after nu=5. The effect of hidden layer numbers is shown in Fig. 7. As the numbers of hidden layer increase, the value Tc
agrees well with Tm. However, the effect is not significant after nh=2. From this result, It is known that neural network is very useful method that can be applied to the color-to-temperature transformation.
Therefore, we used the structure of neural network that has two hidden layers and five units, respectively in this study.
The bubbly flow in a stratified temperature environment is investigated through the visualization using liquid crystals. The temperature difference between top and bottom surfaces is 3.
0℃(30.4-27.4℃). Fig. 8(a) shows the original image that the vertical temperature gradient is established in the fluid, which corresponds to the
•
••
••
••
••
••
••
••
••
••
••
••
••
27 28 29 30 31
27 28 29 30 31
Tm
(a) nu=3
••
••
••
••
••
••
••
••
••
••
••
••
•
27 28 29 30 31
27 28 29 30 31
Tm
(b) nu=5
•
••
••
••
••
••
••
••
••
••
••
••
••
27 28 29 30 31
27 28 29 30 31
Tm
(c) nu=9
Fig. 6 The effect of unit number on results of neural network calibration
state of heat conduction; there is no fluid motion, and the thermal boundary layer grows by pure conduction. After applying the color-to- temperature transformation to the original image, temperature distribution is painted by 24-bit full color as shown in Fig. 8(b). The color of the original image changes from brown to blue as the temperature raises, namely, the brown indicates the low temperature, and the blue indicates the high temperature.
•
••
••
••
••
••
••
••
••
••
••
••
••
27 28 29 30 31
27 28 29 30 31
Tm
(a) nh=1
••
••
••
••
••
••
••
••
••
••
••
••
•
27 28 29 30 31
27 28 29 30 31
Tm
(b) nh=2
••
••
••
••
••
••
••
••
••
••
••
••
•
27 28 29 30 31
27 28 29 30 31
Tm
(c) nh=3
Fig. 7 The effect of hidden layer number on results of neural network calibration
However, the order of colors is reversed in the image painted by full color as usual. The left one is the original image of liquid crystals and the right one is the evaluated temperature pattern by using neural network calibration.
The experiment on bubbly flow starts when a sudden gas bubble is injected into the test cell from the bottom injector. The temperature patterns at four different instants are shown in Fig. 9. The left one is the original image of liquid crystals,
27.4
and the right one is the evaluated temperature pattern by using neural network calibration. These show how bubbly flow destroys the stratified temperature field and the temperature of the fluid becomes a bulk temperature.
5. Conclusions
The measurement method of the temperature fields using liquid crystals particles has been applied to visualize bubbly flow in a stratified temperature environment. Unlike the traditional point measurement methods, it can measure the whole flow field instantaneously at a given time.
In this experiment, the present method gives good representations of the transient temperature fields of bubbly flow. It was shown that the results of
a) Visualized image b) Evaluated temperature Fig. 8 Visualized image of liquid crystal tracers
and evaluated temperature distribution
(a)
(b)
(c)
(d)
a) Visualized image b) Evaluated temperature Fig. 9 The temperature patterns at four different
instants: t=(a)0.5 s, (b)10.0, (c)30.0, (d)60.0
color-to-temperature transformation using neural network are very good. As a result, the measurement system is very useful for analyzing unsteady thermal flow phenomena, and it is expected that the quantitative data obtained by applying color-image processing can be directly used to verify the computational results.
References
1. N. A. Wilcox, A. T. Watson, and G. B.
Tatterson, 1985, “Color/temperature calibrations for temperature sensitive tracer particles”, Proc.
ASME Int. Symp. on Physical and Numerical Flow Visualization, FED-Vol.22, pp. 65-74.
2. T.A. Kowalewski and M. Cybulski, M. Rebow, 1998, “Particle Image Velocimetry and Thermometry in Freezing Water” 8th International Symposium on Visualization, pp.241-248.
3. C. Camci, K. Kim, and S. A. Hippensteele, 1992, “A new hue capturing technique for the quantitative interpretation of liquid crystal image used in convective heat transfer studies”, J. Turbomachinery, Vol.114, pp.765-775.
4. R. L. Paio, D. S. Bae and O. B. Kwon, 2005,
“Mixed Convection between Inclined Parallel Plates with different Temperatures”, Journal of Korea society for Power System Engineering, Vol. 9, No. 2, pp. 33-39.
5. I. Kimura, Y. Kuroe, and M. Ozawa, 1993
“Application of neural networks to quantitative flow visualization”, J. Flow Visualization and Image Processing, Vol. 1, pp.
261-269.
6. W. T. Jones, 1972, “Air barriers as oil-spill containment devices”, J. Soc. Pet. Eng., pp.126-142.
7. J. H. Milgram, 1983, “Mean flow in round bubble plumes”, J. Fluid Mech., vol. 133, pp.
345-376.
8. T. K. Fannelp, S. Hirschberg, and J. Kuffer, 1991, “Surface current and recirculating cells
30.4
generated by bubble curtains and jets”, J. Fluid Mech., vol. 229, pp. 629-657.
9. N. A. Hussain, and B. S. Narang, 1984,
“Simplified analysis of air-bubble plumes in moderately stratified environments”, Trans.
ASME J. Heat Transfer, vol. 106, pp. 543 -551.
10. T. Asaeda, and J. Imberger, 1993, “Structure of bubble plumes in linearly stratified environments”, J. Fluid Mech., vol. 249, pp.
35-57.
11. D. Dabiri, and M. Gharib, 1991, “Digital particle image thermometry: The method and implementation”, Experiments in Fluids, vol.11, pp.77-86.