Photochemical Response Analysis on Drought Stress for Red Pepper (Capsiumannuum L.)
Sung-Yung Yoo
1, Yong-Ho Lee
1, So-Hyun Park
1, Kyong-mi Choi
2, June-Young Park
1, A-Ram Kim
1,3, Su-Min Hwang
1,3, Min-Ju Lee
1,3, Tae-Seok Ko
1, and Tae-Wan Kim
1,3*
1Institute of Ecological Phytochemistry, Department of Phytomedicine, Hankyong National University, Ansung, 456-749, Korea
2National Academy of Agricultural Science, Rural Development Administration, Suwon, 441-707, Korea
3Department of Plant Life and Environmental Science, Hankyong National University, Ansung, 456-749, Korea
(Received: November 5 2013, Accepted: December 13 2013)
The aim of this study is to determine the drought stress index through photochemical analysis in red pepper (Capsiumannuum L.). The photochemical interpretation was performed in the basis of the relation between Kautsky effect and Photosystem II (PSII) following the measurement of chlorophyll, pheophytin contents, and CO
2assimilation in drought stressed 5-week-old red pepper plants. The CO
2assimilation rate was severely lowered with almost 77% reduction of chlorophyll and pheophytin contents at four days after non-irrigation.
It was clearly observed that the chlorophyll fluorescence intensity rose from a minimum level (the O level), in less than one second, to a maximum level (the P-level) via two intermediate steps labeled J and I (OJIP process). Drought factor index (DFI) was also calculated using measured OJIP parameters. The DFI was -0.22, meaning not only the initial inhibition of PSII but also sequential inhibition of PSI . In real, most of all photochemical parameters such as quantum yield of the electron transport flux from Quinone A (Q
A) to Quinone B (Q
B), quantum yield of the electron transport flux until the PSI electron acceptors, quantum yield of the electron transport flux until the PSI electron acceptors, average absorbed photon flux per PSII reaction center, and electron transport flux until PSI acceptors per cross section were profoundly reduced except number of Q
Areducing reaction centers (RCs) per PSII antenna chlorophyll (RC/ABS). It was illuminated that at least 6 parameters related with quantum yield/efficiency and specific energy fluxes (per active PSII RC) could be applied to be used as the drought stress index. Furthermore, in the combination of parameters, driving forces (DF) for photochemical activity could be deduced from the performance index (PI) for energy conservation from photons absorbed by PSII antenna until the reduction of PSI acceptors. In conclusion, photochemical responses and their related parameters can be used as physiological DFI.
Key words: Chlorophyll fluorescence, Pheophytin, Photosynthetic rate, Transpiration rate, Drought factor index
Polar plot analysis of changes in chlorophyll a fluorescence parameter during different days of drought stress.
1)
*Corresponding author : Phone: +82316784750, E-mail: [email protected]
§Acknowledgement: This study was carried out with the support of “Cooperative Research Program for Agricultural Science &
Technology Development (Project No. PJ907245)”, Rural Development Administration, Republic of Korea.
Introduction
고추는 국내에 17세기초 전래되어 재배하고 있으며 전국 에서 연간 1조 1,096억원 가량 생산되는 작물로 채소작물 중 1위를 차지하고 있는 주요 작물이다 (Yoo et al, 2012).
그러나, 최근 전세계적으로 온난화의 영향으로 국지성 호우 및 가뭄으로 인해 고추 생산성 및 품질 저하가 우려되고 있 는 실정이다. 따라서 가뭄에 의한 물 부족에 따른 상황에서 작물의 생육에 미치는 영향 구명을 통한 초기진단 방법 연 구와 같은 과학적인 접근이 필요하다. 최근 식물체의 엽록 소형광반응의 여러 가지 변수들을 측정하는 기술의 발달로 수분부족의 조기측정 가능성에 대한 많은 연구가 진행되어 왔다 (Oukarroum et al., 2007; Caclatayud et al., 2006).
식물체의 형광유발현상을 응용한 Kautsky effect를 측정하 는 방식에서 발전되어 온 엽록소 형광현상의 측정은 빛에 노출된 엽록소가 15분에서 1시간의 암기간을 거치게 되면 다시 원상태의 형광현상이 나타날 수 있는 상태로 복귀하는 것으로 알려져 왔다 (Starsser, 1985; Srivastava et al., 1995).
암 기간을 거치며 엽록소가 원상태로 복귀하는 형광유발 시점 을 Origin (O)으로 표현하고, 이후 첫 번째 최소형광변동 지점 까지를 Jump (J)로, 중간수준의 형광수준을 Intermediate (I) 로 최대 형광점에서의 형광유도량을 Peak (P)로 표현하는 소 위 OJIP 방식으로 표현하는 것이 보편화되었다 (Govindjee, 1995). 대부분의 연구에서 OJIP 가설에서의 잠정적인 전환 (transient phase)은 엽록소a의 변동형광량은 Photosystem
Ⅱ(PSⅡ)가 직접적인 관여를 하며, Photosystem Ⅱ(PSⅡ) 의 광화학적 변환율은 전자전달수용체 (electron acceptor) 에 의해 지배된다는 가정 하에 성립한다고 보고되어 있다 (Duysens and Sweers, 1963). 지금까지 국내에 영상화 장치 를 이용한 엽록소 형광반응 분석을 통해 식물의 광화학적 특성 해석 관련 연구가 시도되어 왔다 (Yoo, 2007; Park et al., 2010; Yoo et al., 2012). 이 방법은 과일 및 채소 등의 거대 시료가 분석이 가능하며, 측정한 시료의 각 부위별 비 교가 가능 (Calatayud et al., 2006)한 장점이 있으나 대량 분석이 거의 불가능하다. 그러나 OJIP 방식을 이용한 엽록 소 형광 분석은 짧은 시간에 대량분석이 가능하여 식물의 건전생장 및 스트레스 지표 등의 분석에 활용가치가 매우 크다. 보편적으로 엽록소 형광현상을 이용한 식물의 스트레 스 지표는 변동형광값/최대형광값 비 (FV/FM)가 주로 사용되 어 있으며 (Genty et al, 1989), OJIP 방식을 이용한 Drought factor index (DFI)라는 한발스트레스 지표가 최근 도입되 어 사용되고 있다 (Oukarroum et al., 2007).
따라서 본 연구는 5월 정식하는 노지재배 고추 (
Capsicum annuum
L.)를 대상으로 하여 OJIP방법을 이용해 초기 생육 시기의 한발스트레스에 따른 광화학적 반응 및 광이용 효율 을 측정하고, 한발스트레스 지표를 선발하여 초기진단을 할수 있도록 하기 위해 수행하였다.
Materials and Methods
본 연구는 한경대학교 온실에서 발아 후 5주 동안 재배한 고추(농그린) 유묘를 한발스트레스 처리 전 3일 동안 1일 간 격으로 고추 한 주당 10 mL씩 관수하여 동일한 수분 조건을 유지하였고, 관수 3일 후부터 대조구와 무관수구로 구분하 여 재배했다. 이때, 대조구는 고추 유묘를 1일간격으로 고 추 한 주당 10 mL씩 관수하여 재배하였고, 무관수구는 관수 를 하지 않고 실험에 사용하였다.
광화학반응 (OJIP) 분석
엽록소 형광반응 측정은 무 관수 시점으로부터 4일 (96시간) 동안 24시간 간격으로 고 추의 엽록소 형광반응 변화를 Fluorpen FP-100 (PSI, Czech) 을 이용하여 잎을 30분 암처리 후 OJIP를 각각 3반복으로 측정하였다. 측정된 데이터는 Stirbet과 Govindjee (2011)의 방법에 의해 JIP-Test를 하였다 (Table 1).식물의 한발스트레스 정도를 평가할 수 있는 한발지수 (DFI: Drought factor index) 평가는 식물의 광화학반응 성 능지수 (PI: Perfomance index)를 이용해 아래와 같이 산정 하였다 (Oukarroum et al, 2007).
DFI = log(PI day1/PI control)+2log(PI day4/PI control)
이때, Drought factor index(DFI) 의 day 1은 한발스트레 스 처리 1일 후의 Performance index (PI)이며, day 4는 한 발스트레스 처리 4일 후의 Performance index (PI)를 각각 적용하였다.
엽록소 및 페오피틴 함량 분석
엽록소 (Chlorophyll) 및 페오피틴 (Pheophytin) 함량 측정은 대조구와 무관수구 의 고추 잎을 1일 간격으로 4회 채취한 후 1 g의 잎 시료를 10 mL의 95%에탄올에 균질화하여 3,000 rpm에서 10분간 원심분리 (4℃)하여 엽록소 함량을 측정하였다. 페오피틴 함량은 엽록소 함량을 측정하기 위해 추출한 용액 5 mL에 0.06 M HCl을 0.5 mL첨가하여 맑은색의 용액으로 만든 다 음 Wintermans와 De Mots (1965)의 방법에 따라 함량을 계 산하였다.광합성량분석
이산화탄소 동화량, 기공전도도 및 증산 량은 LC pro (ADC, UK)를 이용하여 잎을 10분간 엽 챔버에 물려서 챔버 내부 환경을 안정화 시킨 후 측정 (LED light 2,000 μmol m-2 s-1, 25℃)하였다.Table 1. Equations and definitions of OJIP parameters (modified from Stirbet and Govindjee, 2011).
Information selected from the fast OJIP fluorescence induction (data necessary for the calculation of the so-called JIP parameters) OJIP parameters
F0 F50μs; fluorescence intensity at 50 μs
FJ Fluorescence intensity at J-step (at 2 ms)
Fi Fluorescence intensity at I-step (at 60 ms)
FM Maximal fluorescence intensity
FV/ FM - F0 Maximal variable fluorescence
VJ = (FJ - F0) / (FM - F0) Relative variable Chl fluorescence (at 2 ms) Vi = (Fi - F0) / (FM - F0) Relative variable Chl fluorescence (at 30 ms) Specific energy fluxes (per active PSII reaction center)
ABS/RC = (MO/VJ)∙(1/φPo) Average absorbed photon flux per PSII reaction center (or also, apparent antenna size of an active PSII)
RC/ABS = φPo∙VJ/MO = γRC2 /(1 - γRC2) Number of QA reducing RCs per PSII antenna Chl
TRo/RC=MO/ VJ Maximum trapped exciton flux per PSII
DIo/RC =ABS/RC-TRo/RC Heat dissipation at time zero, per RC
ET2o/RC =(MO/VJ)∙(1 -VJ) Electron transport flux from QA to QB per PSII RE1o/RC =(MO/VJ)∙(1 -VI) Electron transport flux until PSI acceptors per PSII
“Performance”indexes (combination of parameters) PIABS = [γRC2 /(1 - γRC2)]∙[φPo/(1-φPo)] ∙ [ ψET2o/(1- ψET2o)]
Performance index for energy conservation from photons absorbed by PSII antenna, to the reduction of QB
PI = PIABS∙ [δRE1o /(1- δRE1o)] Performance index for energy conservation from photons absorbed by PSII antenna, until the reduction of PSI acceptors
Driving forces (total driving forces for photochemical activity)
DF = log(PI) Driving force on absorption basis
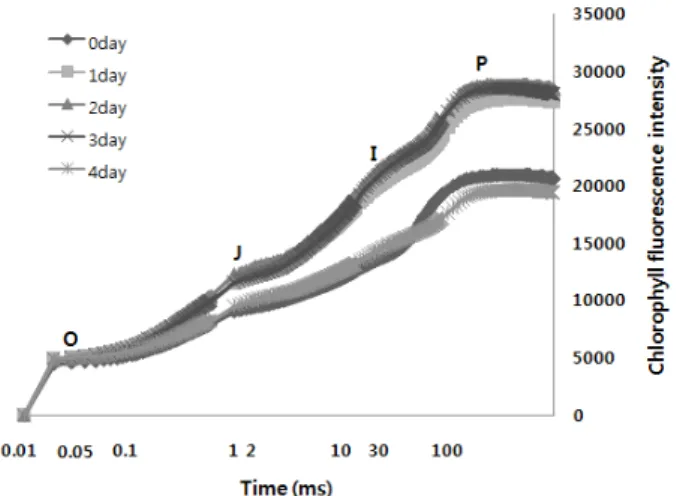
Fig. 1. The Chlorophyll a fluorescence transient (OJIP) of red pepper under control and 4 days after Drought stress.
통계분석 방법
통계분석은 SAS 9.2. 버전을 이용해 ANOVA 분석 및 t-test를 실시하였다.Results and Discussion
한발스트레스 처리 후4일이 경과한 고추 잎에서의 OJIP 전이과정에 따른 형광수준은 Fig. 1과 같다. O-J-I-P전이 과정의 엽록소 형광현상은 2 ms 이내에 일어나는 아주 빠 른 반응인 O-J, 그리고 열 의존적인 J-I 및 I-P전이를 수치 로 계량화하여 한발스트레스에 따른 각각의 phase를 정량화 한 것이다. 한발 스트레스 처리 후 3일 동안의 O-J-I-P전 이는 증가했고, 4일 후 급격하게 감소했다. J-I 및 I-P는 특히 열 의존적인 전이로서 연속적인 전자의 여기 현상에 의한 전자전달 체인의 포화현상 및 비광화학적인 소광 등 여러 반응과 맞물려 복잡한 과정을 거치게 된다고 알려져 있다 (Paqageorgiou and Govindjee, 2004). 따라서 본 연구 의 결과와 같이 정류상태에서의 전자전달 지체 및 비광화학 적 소광 등에 의해 한발스트레스 처리 4일 후의 엽록소 형 광과정 중 각 전이단계의 급격한 감소로 이어졌다고 판단되 었다.
한발스트레스를 받은 고추 잎에서의 OJIP산정 변수들은 활성화된 반응중심 비 (RC/ABS)와 열로 인한 에너지 소실 (DIo/RC)가 증가하였으며, Quinone A (QA)를 Quinone A (QA-)로 환원시킬 수 있는Photosystem Ⅱ (PSⅡ) 의전자전 달 효율 (ETo/RC) 및 Photosystem Ⅰ (PSⅠ) 전자수용체까 지의 전자전달 효율 (RE1o/RC) 등은 감소했다 (Fig. 2). 또
Fig. 2. Polar plot analysis of changes in chlorophyll a fluorescence parameter during different days of drought stress. The valuesof control parameter were radially fixed on 1.0 comparing toothers under drought stress. For the distributional analysis ofchlorophyll a fluorescence parameters the measurements were performed in 4 days after drought stress.
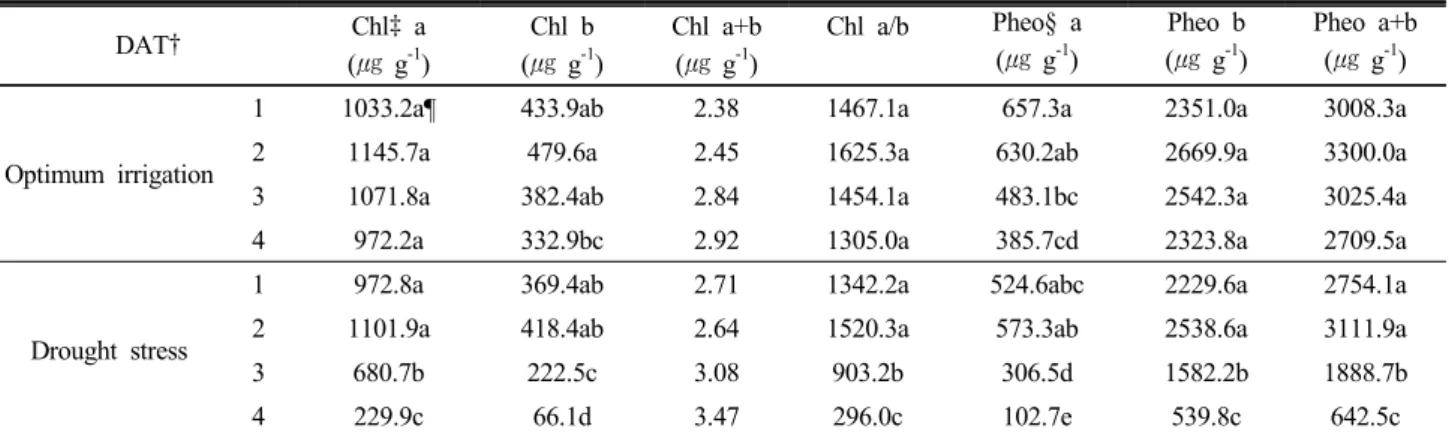
Table 2. Difference of Chlorophyll and Pheophytin after drought stress.
DAT† Chl‡ a
(㎍ g-1)
Chl b (㎍ g-1)
Chl a+b (㎍ g-1)
Chl a/b Pheo§ a (㎍ g-1)
Pheo b (㎍ g-1)
Pheo a+b (㎍ g-1)
Optimum irrigation
1 1033.2a¶ 433.9ab 2.38 1467.1a 657.3a 2351.0a 3008.3a
2 1145.7a 479.6a 2.45 1625.3a 630.2ab 2669.9a 3300.0a
3 1071.8a 382.4ab 2.84 1454.1a 483.1bc 2542.3a 3025.4a
4 972.2a 332.9bc 2.92 1305.0a 385.7cd 2323.8a 2709.5a
Drought stress
1 972.8a 369.4ab 2.71 1342.2a 524.6abc 2229.6a 2754.1a
2 1101.9a 418.4ab 2.64 1520.3a 573.3ab 2538.6a 3111.9a
3 680.7b 222.5c 3.08 903.2b 306.5d 1582.2b 1888.7b
4 229.9c 66.1d 3.47 296.0c 102.7e 539.8c 642.5c
† Days After Treatment, ‡ Chlorophyll, §Pheophytin, ¶Means with the same letter are not significantly different (LSD, P<0.05).
Fig. 3. Changes in photosynthesis rate, transpiration rate and stomatal conductance after irrigation and drought stress (A:
Photosynthesis rate, B: Transpiration rate, C: Stomatal conductance).
한 PIABS 및 DFI를 산정한 결과, 한발스트레스를 받은 고추 잎에서의PIABS는 4일 후약 30% 감소한 것으로 나타났으며, DFI는 –0.22이었다. 이는 Oukarroum 등 (2007)의 보리를 대상으로 한발스트레스 평가한 DFI결과 (–0.29에서0.19)와 유 사하였으며, 고추에서도 DFI의 산출을 통한 한발스트레스 지 표로 사용이 가능한 것으로 사료되었다. PIABS는 Photosystem
Ⅱ (PSⅡ)에 의해 흡수된 광자와 광합성계 내부의 전자수용 체 환원 정도를 나타내고 Photosystem Ⅰ (PSⅠ)의 최종 전 자수용체 환원 정도를 나타내는 지표임을 의미한다 (Stirbet and Govindjee, 2011). 따라서 한발스트레스 처리에 따른 광합성계의 전자전달 감소는 결국 순환적 광인산화 반응에 의한 NADPH 생성 및 ATP합성 능력이 저하로 이어진다고 생각되었다.
한발스트레스를 처리1일 후 대조구와 처리구의 엽록소 및 페오피틴의 함량이 크게 차이가 없었으나 시간이 경과함 에 따라 처리구의 엽록소 및 페오피틴 함량이 급격히 감소
하였으며, 대조구에서는 큰 변화는 없었다. 특히, 4일 후 엽 록소와 페오피틴의 함량이 각각 78%와 77% 감소하였고, 대 조구와 한발스트레스 처리구의 엽록소 및 페오피틴 함량의 유의적 차이성을 보였다 (Table 2). 과도한 빛 에너지에 의 해 식물체내 엽록소 분자는 고준위의 에너지 상태로 여기 (Kautsky et al., 1960; Maxwell and Johnson, 2000)되며, 이때 에너지 소산과 관련한 PSⅡ의 전자전달 과정에서 PS
Ⅰ에 이르는 전자의 흐름은 1차 전자 공여체와 1차 퀴논 (Quinone)간의 전달체인 페오피틴 (Shuvalov and Heber, 2003)에 의해 빠르게 전달되어야 하지만 한발스트레스 처 리시 Fig. 2 및Table 2와 같이 페오피틴 함량의 급격한 감소 로 인한 전자전달 감소가 연쇄적으로 일어나는 것으로 판단 되었다.
광합성률은 엽록체에서의 이산화탄소 동화량을 측정하는 것으로써 한발스트레스 처리 3일 후부터 급격히 감소하였 다 (Fig. 2). 광합성률의 감소는 엽록소와 페오피틴의 감소 이후에 이루어짐을 확인하였으며, 이는 PSⅡ에서 전자전달 에 직접 기여하는 엽록소와 페오피틴의 감소가 광합성률에 직접적인 영향을 끼친 것으로 사료되었다. 증산율은 한발스 트레스 처리 3일 후 까지는 2.25-2.95 mmol m-2 s-1 로 대 조구와 비슷하였으나 4일후에 0.03~0.08 mmol·m-2·s-1 수 준으로 급격히 감소했다. 그리고 기공 전도도 역시 증산율 과 동일한 패턴을 보였으며, 무관수 시점으로부터 3일까지 는 기공 저항성에 큰 영향을 끼치지 않은 것으로 나타났다.
따라서 무관수 3일이 경과한 시점부터 한발 스트레스를 받 았음을 알 수 있었다.
지금까지 한발스트레스 지표로 엽록소 형광 감소율 (Rfd:
Chlorophyll fluorescence decrease ratio)이 주로 사용 (Lich- tenthaler and Rinderle, 1988; Schneckenhurger and Bader, 1988; Lindgren and Hallgren, 1993)되어 왔으나 본 연구의 JIP-Test결과 총 6개의 광화학 매개변수가 한발스트레스 지표로 활용할 수 있다고 판단되었다.
Conclusions
본 연구는 한발스트레스에 대한 고추 (
Capsicum annuum
L.)의 광화학적 반응을 분석하여 한발스트레스 지표 선발 가능성을 알아보고자 하였다. 발아 후 5주 동안 재배한 고 추를 대상으로 한발스트레스 처리 후 카우츠키 효과와 광합 성계 Ⅱ (PSⅡ)의 관계에 기초하여 엽록소, 페오피틴함량 및 이산화탄소 동화량을 분석하여 광화학적 해석을 하였다.무관수 4일 후 이산화탄소 동화량이 급격히 감소했으며, 엽 록소와 페오피틴의 함량 또한 약77% 감소했다. 이와 함께 엽록소의 형광 강도는 최소 수준 (O)으로부터 중간 단계인 J와 I를 거쳐 최대 수준 (P)에 이르기까지 1초 이내에 일어 나는OJIP과정에서의 증가가 명확하게 관찰되었다. 한발계
수지수 (Drought factor index, DFI) 또한 OJIP 매개변수를 이용하여 산정되었다. DFI는 –0.128이었으며, 이는 초기 광 합성계 Ⅱ 뿐만 아니라 광합성계Ⅰ에 이르기까지 순차적으 로 억제되었음을 알 수 있었다. 실질적으로, 광합성계Ⅰ 전 자수용체에 이르기 전까지의 전자전달 흐름은 광합성계 Ⅱ 안테나 엽록소당 완전히 활성화된 (OA환원) 반응센터의 엽 록소 수를 의미하는 RC/ABS를 제외한대부분의 광화학매개 변수인 QA에서 QB까지 전자전달의 양자수율, 광합성계Ⅰ전 자수용체 전까지 전자전달의 양자수율, QB에서 광합성계Ⅰ 수용체전까지의 전자전달 효율, 그리고 광합성계 Ⅱ 반응중 심당 평균 흡수된 광자플럭스 등이 모두 감소했다. 이를 통 해 양자 수율/효율성 및 특정 에너지 플럭스 (활성화된 광 합성계Ⅱ 반응중심당)과 관련된 최소 6개의 매개변수가 한 발스트레스 지표로 적용 가능함을 확인하였다. 결론적으로 광화학반응과 관련 매개변수는 생리적 한발계수지수(DFI) 로 사용 할 수 있었다.
References
Calatayud, A., D. Roca, and P.F. Martinez. 2006. “Spatial- temporal variations in rose leaves under water stress conditions studied by chlorophyll fluorescence imaging.” Plant Physiology and Biochemistry. 44(10):564-573.
Duysens, L.M.N. and H.E. Sweers. 1963. Mechanism of the two photochemical reactions in algae as studied by means of fluorescence. in: Japanese Society of Plant Physiologists (Ed.).
Studies on Microalgae and Photosynthetic Bacteria. University of Tokyo Press. Tokyo. p. 353-372.
Genty, B., J.M. Briantais, and N.R. Baker. 1989. “The relationship between the quenching of chlorophyll fluorescence.” Biochimica et Biophysica Acta. 990:87-92.
Govindjee. 1995. Sixty-three years since Kautsky: chlorophyll a fluorescence. J. Aust. Plant Physiol. 22:131-160.
Kautsky, A. and H. Amann. 1960. Chlorophyll fluoreszenz und Kohlensäureassinmilation. Ⅷ. Die Fluoreszenkurve und die Photochemie der Pflanze. Biochemische Zeitschrift. 332:227-229.
Lichtenthaler, H.K. and U. Rinderle. 1988. Chlorophyll fluorescence signatures as vitality indicator in forest decline research. In Lichtenthaler, H.K.(ed.). Applications of chlorophyll fluorescence.
Kluwer Acaemic. Dordrecht. 143-149.
Lindgren, K. and J.E. Hallgren. 1993. Cola acclimation of Pinuscontorta and Pinussylvestris assessed by chlorophyll fluorescence. Tree Physiol. 13:97-106.
Maxwell, K. and G.N. Johnson. 2000. Chlorophyll fluorescence - a practical guide. J. Exp. Bot. 51:659-668.
Oukarroum, A., S.E. Madidi, G. Schansker, and R.J. Strasser.
2007. Probing the responses of barley cultivars (Hordeum vulgare L.) by chlorophyll a fluorescence OLKJIP under drought stress and re-watering. Envi & Exp. Bot. 60:438-446.
Papageorgiou, G.C. and Govindjee. 2004. “Chlorophyll a
Fluorescence A Signature of Photosynthesis.” (Eds.) Advances in Photosynthesis and Respiration, Springer, Dordrecht, The Netherlands. 19:818.
Park, S.J., D.Y. Kim, S.Y. Yoo, H.H. Kim, T.S. Ko, M.Y. Shim, S.H. Park, J.A. Yang, K.C. Eom, S.H. Hong, and T.W. Kim.
2010. Response of Leaf Pigment and Chlorophyll Fluorescence to Light Quality in Soybean (Glycine max Merr. var Seoritae).
J. Kor. Soil. Sci. Fert. 43(3):400-406.
Schnekenburger, H. and J. Bader. 1988. Fiber-optic detection of chlorophyll fluorescence. In Lichtenthaler, H.K. (ed.).
Applications of chlorophyll fluorescence. Kluwer Academic.
Dordrecht. 255-258.
Srivastava, A., H. Greppin, and R.J. Strasser. 1995. Acclimation of land plants to diurnal changes in temperature and light. in: P.
Mathis (Ed.), Photosynthesis: From Light to Biosphere, Kluwer Academic Publishers. The Netherlands. 4:909-912.
Strasser, R.J. 1985. Dissipative Strukturen als thermodynamischer
Regelkreis des Photosyntheseapparates. Ber. Deutsche Bot.
Ges. Bd. 98:53-72.
Stribet, A. and Govindjee. 2011. On the relation between the Kautsky effect (chlorophyll a fluorescence induction) and Photosystem II: Basics and applications of the OJIP fluorescence transient. J. Photochem. Phobiol. B. 104:236-257.
Yoo, S.Y. 2007. Study on the biophysical and biochemical bio-assay method for the identification of plant stress. Master's thesis.
Hankyong National University.
Yoo, S.Y., K.C. Eom, S.H. Park, and T.W. Kim. 2012. Possibility of Drought stress Indexing by Chlorophyll Fluorescence Imaging Technique in Red Pepper (Capsicum annuum L.). J.
Kor. Soil. Sci. Fert. 45(2):676-682.
Wintermans, J.F. and A. de Mots. 1965. Spectrophotometric characteristics of chlorophylls a and b and their pheophytins in ethanol. Biochimicaet. Biophysica. Acta. 169:448-453.