Fertilization Efficiency of Livestock Manure Composts as Compared to Chemical Fertilizers for Paddy Rice Cultivation
Chang-Sung Kang* and An-Sung Roh
Gyeonggido Agricultural Research & Extension Services Gyeonggi-do Hwaseong-si Gisan-ro 31-22, 445-784
To promote the practical use of livestock manure compost (LC) for paddy rice cultivation, the fertilization efficiency of nutrients in LCs was investigated compared to that of chemical fertilizer. This experiment was conducted at rice field in Hwaseong, Korea, with 6 treatments by each of 3 kinds of tested LCs, cattle manure compost (CaC), swine manure compost (SwC) and chicken manure compost (ChC). The treatments consisted of 3 application levels of LCs and 3 chemical fertilizer treatments having the same application levels with LCs.
NH4-N content in soil became higher according to the increase in the urea application rate, while it became lower in LC plots than in urea plots, and statistically had no significant difference among LC plots. There was a close relationship between phosphate fertilization rate and the increment of soil available phosphate content after experiment resulting y = 0.1788x - 6.169 (R2= 0.9425) when applied fused superphosphate fertilizer, and y = 0.0662x - 2.689 (R2= 0.9315) when applied LC at the equivalent rates to phosphate input (x:
phosphate application rate, kg ha-1, y: increment in soil available phosphate content, mg kg-1). And from these two equations, the correlation on the phosphate application rate between fused superphosphate fertilizer and LC could be obtained as y = 2.7056x - 52.492 (x: P2O5 application rate of fused superphosphate, kg ha-1, y:
P2O5 application rate of LC, kg ha-1). Plant height, number of tillers, nutrients uptake by rice, and rice yield showed higher levels in N 100% and N 150% application plots of chemical fertilizers, while every LC plots exhibited lower values and no significant difference among them. Relative nitrogen fertilization efficiencies of LCs compared to urea was 12.3% for CaC, 8.8 for SwC and 24.6 for ChC, respectively.
Key words: Livestock feces, Compost, Livestock manure, Rice
Received : January 16. 2012 Accepted : February 6. 2012
*Corresponding author : Phone: +82312295761 E-mail: [email protected]
Introduction
According to Korean statistical information service, the head number of livestock in Korea in 2011 was 2,949,664 beef cattles, 403,689 dairy cattles, 8,170,979 swines, and 149,511,309 chickens, respectively, corres- ponding to the amount of livestock feces of about 41Tg which contains 332 Gg N and 153 Gg P2O5. Referring to the selling amount of chemical fertilizers to farmers of 262 Gg N and 102 Gg P2O5 in 2009 (KFIA, 2010), the nutrients contained in livestock feces could be a good substitute for chemical fertilizer. Being noticed by Park (1999), however, because the excessive application of nutrients even in organic materials gives an adverse effect on soil and plant growth, appropriate
fertilization must be practiced regardless of the nutrient sources. In this respect, Lim et al. (2010) suggested that the appropriate fertilization strategy should be the use of LCs as a phosphate fertilizer followed by the supplementary N input with chemical fertilizer by the lack amount from the LCs. And Kang et al.
(2011) reported the proper supplementary N rate with urea after LCs application by the amount of phosphate recommended by soil test for lettuce cultivation in platic film house.
In Korea, there has been an application standard of LCs for crop cultivation since 2000. It recommends that the relative application rates of LCs compared to that of conventional manure should be CaC 100%, SwC 22% and ChC 17%, respectively (NIAST, 2006). Song et al. (2001) also reported that the proper application rate of SwC was 4.0 Mg ha-1 in sandy loam soil and 7.0 Mg ha-1 in both loam and clayey loam soils when
Table 1. Chemical properties of livestock manure composts used in the experiment.
Livestock manures OM T-N P2O5 K2O CaO MgO Water
--- fresh weight % ---
Cattle manure compost 40.9 0.97 1.33 1.66 1.57 0.62 46.7
Swine manure compost 38.6 1.26 3.99 2.76 4.36 1.52 41.3
Chicken manure compost 45.8 2.11 2.96 2.49 6.03 1.19 31.7
Table 2. Chemical properties of the soil used in the experiment.
pH OM Avail. P2O5 Avail. SiO2
Inorganic nitrogen
Exch. Cation
K Ca Mg CEC
(1:5) g kg-1 --- mg kg-1 --- --- cmolc kg-1 ---
6.4 20.0 25 320 22.9 0.25 9.2 1.7 11.5
chemical fertilizers are normally applied by recom- mended amount by soil test. These recommendation considers LCs as a substitute for conventional manure.
LCs, however, generally contains a high content of P2O5, and therefore they could be a substitute for phosphate fertilizers as described by Jakob et al.
(2002), Magid and Jensen (2002), and Kim et al.
(2000). Especially considering the problems of worldwide apatite exhaustion as reported by Kim et al. (2011), it is very important to use the LCs as a substitute for phosphate resources. But it is well-known fact that nitrogen use efficiency of LC is much less than that of chemical fertilizer N (Hadas and Portnoy, 1994; Paul and Beauchamp, 1993). So in this paddy rice cultivation experiment, the fertilization efficiencies of N and K in LCs as compared to chemical fertilizers were investigated to find out the proper application rate of them when LCs were supposed to be applied as a phosphate fertilizer.
Materials and Methods
Three application levels of LCs were applied by the equivalent amounts of 50 (Com. N 50%), 100 (Com.
N 100%) and 150% (Com. N 150%) of recommended N application rate by soil test, and also treated the same amounts of N, P, and K with those of applied by LCs using urea, fused superphosphate and potassium chloride (Fer. N 50%, Fer. N 100%, Fer. N 150%).
Three kinds of LCs, CaC, SwC and ChC, were made
by mixing the sawdust and LCs in the same proportion, and fermented thoroughly. The chemical properties such as the content of N, P2O5, K2O etc. in LCs were in the range of those ones surveyed at 70 LCs by Kang and Roh (2011) as shown in Table 1. Applied amounts of LCs in 100% N treatment were 13.8 Mg ha-1 for CaC, 10.3 Mg ha-1 for SwC and 6.3 Mg ha-1 for ChC and they were applied 7 days before transplanting date of rice seedlings.
Twenty-five day old rice seedlings (cv. Chucheongbyeo, Japonica type) were transplanted in a space of 0.3 by 0.14 m at 0.90 by 0.98 m confined plots with Seogcheon silty loam (coarse loamy, mixed, non-acid, mesic Fluventic Haplaquepts) on May 20 and harvested on Oct. 10, 2009.
Selected chemical properties of the soil in the site are shown in Table 2. The recommended fertilization rates based on soil test were 134 N, 75 P2O5 and 47 K2O kg ha-1. All of the composts and fertilizers were applied as a basal fertilization without top dressing to compare their nutrient efficiency in the same fertilization condition. Plant height and number of tillers were measured at main growth stages of rice such as tillering, active tillering, maximum tillering, panicle formation, heading and harvesting stage. And the experimental plots were placed according to the randomized block design with 3 replications.
The surface soils collected at 15 cm depth from each plot were air dried, except for NH4+ ion analysis which was analyzed directly with wet samples, passed through a 2 mm sieve and used to determine soil
Fig. 1. Changes of soil organic matter (OM) content at main rice growth stages by the application of livestock composts and chemical fertilizers.
†Rice growth stages : Bef. Ex.; before experiment, Tiller.; tillering, Act. T.; active tillering, Max. T.; maximum tillering, Pan. F.; panicle formation, Head.; heading, Harv.; harvesting
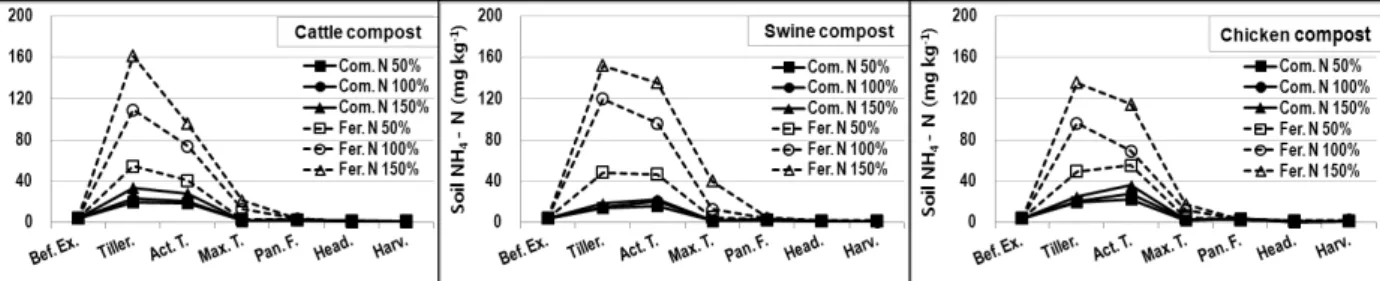
Fig. 2. Changes of soil NH4+-N content at main rice growth stages by the application of livestock composts and chemical fertilizers.
†Rice growth stages : Bef. Ex.; before experiment, Tiller.; tillering, Act. T.; active tillering, Max. T.; maximum tillering, Pan. F.; panicle formation, Head.; heading, Harv.; harvesting
properties by soil analysis method recommended by National Institute of Agricultural Science and Technology in Korea (NIAST, 2000). Briefly, soil pH and EC were measured after mixing soil with H2O at a ratio of 1:5. Soil organic matter and available phosphate were determined by Tyurin and Lancaster method, respectively. Exchangeable cations such as potassium, calcium and magnesium were analyzed by extracting them with 1N ammonium acetate (pH 7) and determined by inductively coupled plasma spectrophotometer (ICP, GBC Integra XMP, Australia). Soil exchangeable ammonia level was obtained by Kjeldahl distillation from 2M KCl extracts. Soils were collected and analyzed before the experiment and at main growth stages of rice as mentioned above. Plant samples were analyzed after decomposing them with strong acid (perchloric acid 9 + sulphuric acid 1) and determined by Kjeldahl method for nitrogen, by colorimetry method using ammonium meta vanadate for phosphate, and by inductively coupled plasma spectrophotometer (ICP, GBC Integra XMP, Australia) for potassium, calcium and magnesium as recommended by NIAST.
Results
LC treatments increased the content of soil organic matter in proportion to their applied amount, especially in the CaC which was applied more than other composts because of its low nitrogen content (Fig. 1). Soil NH4-N content became gradually higher according to the increase of chemical fertilizer N (urea) application rates, while it became low in every LC plots (Fig. 2).
Applying the superphosphate fertilizer raised the content of soil available P2O5 more than LCs when the same amount of P2O5 was applied (Fig. 3). LCs application was less effective to increase soil exchangeable K than potassium chloride until the maximum tillering stage but this trend changed in the opposite direction after panicle formation stage or at harvesting stage showing higher concentration of soil Ex. K in LC plots (Fig. 4).
The difference in soil Av.P2O5 and Ex.K content among LC kinds seemed to be derived from the different input amount of P2O5 and K by LCs’ application.
There were very close relationships between appli- cation rate of LCs and soil organic matter increments
Fig. 3. Changes of soil available P2O5 content at main rice growth stages by the application of livestock composts and chemical fertilizers.
†Rice growth stages : Bef. Ex.; before experiment, Tiller.; tillering, Act. T.; active tillering, Max. T.; maximum tillering, Pan. F.; panicle formation, Head.; heading, Harv.; harvesting
Fig. 4. Changes of soil exchangeable K content at main rice growth stages by the application of livestock composts and chemical fertilizers.
†Rice growth stages : Bef. Ex.; before experiment, Tiller.; tillering, Act. T.; active tillering, Max. T.; maximum tillering, Pan. F.; panicle formation, Head.; heading, Harv.; harvesting
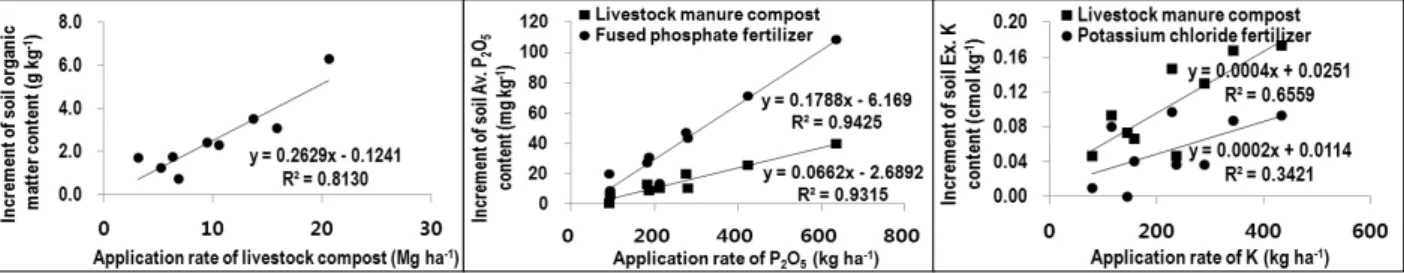
Fig. 5. Correlation between fertilization rates and the incremental organic matter of soil contents or available P2O5
or exchangeable K after paddy rice cultivation.
Fig. 6. Changes of plant height (stem height at harvesting stage) at main rice growth stages by the application of livestock composts and chemical fertilizers.
†Rice growth stages : Tiller.; tillering, Act. T.; active tillering, Max. T.; maximum tillering, Pan. F.; panicle formation, Head.; heading, Harv.; harvesting
after experiment and between phosphate fertilization rate and soil available phosphate increments after experiment. As for phosphate, the correlation was y = 0.1788x - 6.169 (R2 = 0.9425) when applied fused
superphosphate fertilizer, and y = 0.0662x - 2.689 (R2
= 0.9315) when applied LCs by the same amounts of phosphate with those in chemical fertilizer plots (x:
phosphate application, kg ha-1, y: increment in soil
Fig. 7. Changes of tiller number at main rice growth stages by the application of livestock composts and chemical fertilizers.
†Rice growth stages : Tiller.; tillering, Act. T.; active tillering, Max. T.; maximum tillering, Pan. F.; panicle formation, Head.; heading, Harv.; harvesting
Fig. 8. Nutrients absorption amount by rice plant at harvesting stage by the application of livestock composts and chemical fertilizers.
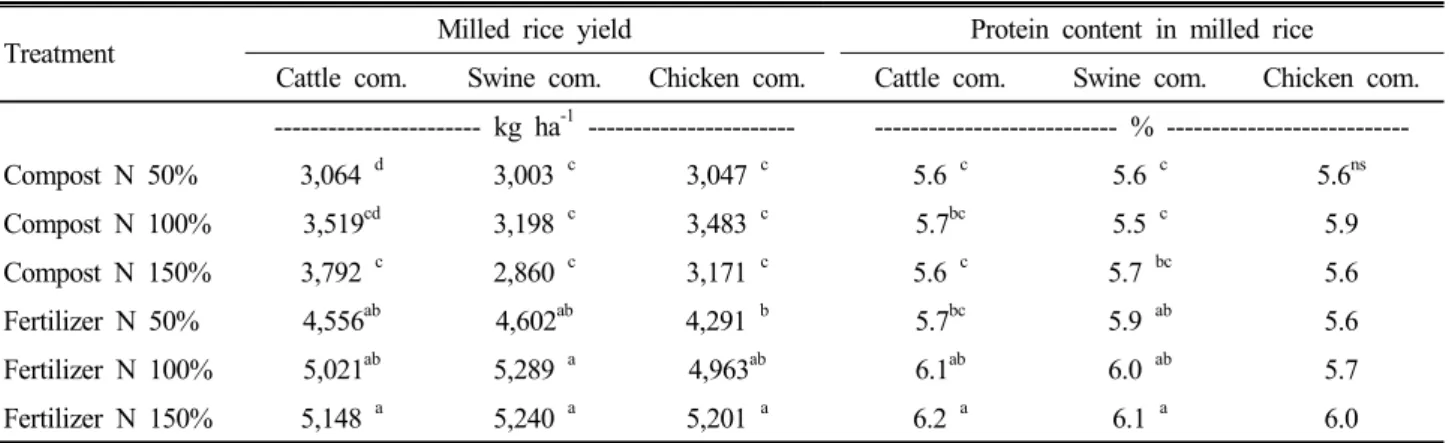
Table 3. Milled rice yield and protein content in milled rice by treatments.
Treatment Milled rice yield Protein content in milled rice
Cattle com. Swine com. Chicken com. Cattle com. Swine com. Chicken com.
--- kg ha-1 --- --- % ---
Compost N 50% 3,064 d 3,003 c 3,047 c 5.6 c 5.6 c 5.6ns
Compost N 100% 3,519cd 3,198 c 3,483 c 5.7bc 5.5 c 5.9
Compost N 150% 3,792 c 2,860 c 3,171 c 5.6 c 5.7 bc 5.6
Fertilizer N 50% 4,556ab 4,602ab 4,291 b 5.7bc 5.9 ab 5.6
Fertilizer N 100% 5,021ab 5,289 a 4,963ab 6.1ab 6.0 ab 5.7
Fertilizer N 150% 5,148 a 5,240 a 5,201 a 6.2 a 6.1 a 6.0
*Values within a column followed by the same letter are not significant at 5% level by DMRT test.
available phosphate content, mg kg-1). From these two equations, the correlation on the phosphate application rate between fused superphosphate fertilizer and LC could be obtained as y = 2.7056x - 52.492 (x: P2O5
application rate of fused superphosphate, kg ha-1, y:
P2O5 application rate of LC, kg ha-1). But the relation between LC application rates and the increments of soil exchangeable potassium content showed a low coefficient of determination (Fig. 5). Plant height (Fig.
6), number of tillers (Fig. 7), amount of nutrient
absorption by rice plant (Fig. 8) were high in Fer. N 100% and Fer. N 150% plots, while every LC plots exhibited lower values and no significant difference among them.
Milled rice yield was greater in urea applied plots than in LC plots showing significant difference. Protein content in milled rice, which is one of the important rice quality indicators, exhibited the same tendency with rice yield, particularly in CaC and SwC experiments (Table 3).
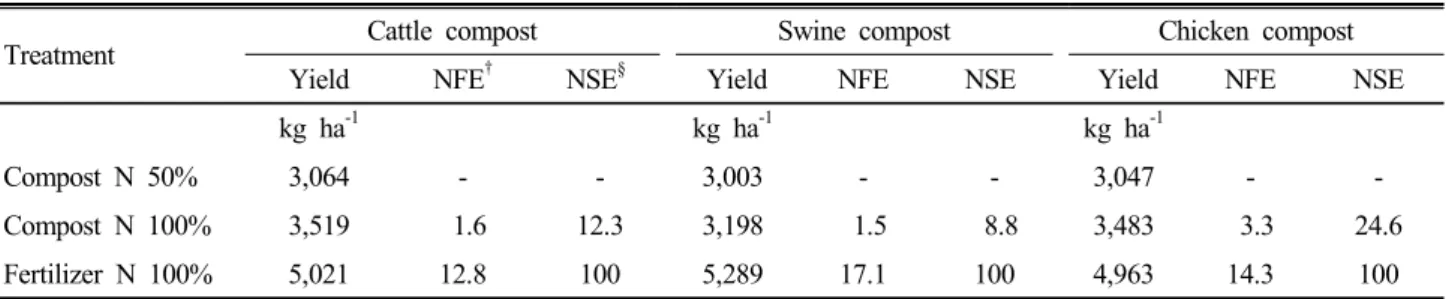
Table 4. Nitrogen fertilization efficiency of livestock manure composts N and urea N.
Treatment Cattle compost Swine compost Chicken compost
Yield NFE† NSE§ Yield NFE NSE Yield NFE NSE
kg ha-1 kg ha-1 kg ha-1
Compost N 50% 3,064 - - 3,003 - - 3,047 - -
Compost N 100% 3,519 1.6 12.3 3,198 1.5 8.8 3,483 3.3 24.6
Fertilizer N 100% 5,021 12.8 100 5,289 17.1 100 4,963 14.3 100
†NFE; nitrogen fertilization efficiency
-NFE = (yield of treated plot – yield of untreated plot) ÷ N application rate
§NSE; nitrogen specific fertilization efficiency of compost N as compared with fertilizer (urea) N -NSE = (NFE of compost N 100% plot ÷ NFE of fertilizer N 100%) × 100
Relative nitrogen specific fertilization efficiency of compost N as compared with urea N was 12.3% for CaC, 8.8% for SwC and 24.6% for ChC, respectively (Table 4).
Discussion
The high correlation between P2O5 application rate and increment of soil available P2O5 after paddy rice cultivation could be a clue to determine the proper phosphate fertilization rate of LCs, inferring that more amount of LCs’ P2O5 is required to meet the need for paddy rice growth than chemical P2O5, as obtained equation in this experiment of y = 2.7056x - 52.492 (x:
P2O5 application rate of fused superphosphate, kg ha-1, y: P2O5 application rate of LC, kg ha-1). Of course this equation might be revised by further tests because of its confined conditions in soil type and physico- chemical properties etc. as reported on the different phosphate accumulation property by soil P2O5 contents (Yoon, 1990) and on the different nitrogen and phosphate use efficiency by soil types (Kim and Jung, 2000).
Milled rice yield appeared to have large difference between LC and urea plots. It seemed to be the result of different N fertilization efficiency of both N sources as described by So et al. (2007). Their report suggested that the rice yield diminished in the pig manure compost plot by 26% at clayey soil and 33% at sandy loam soil as compared to that in the chemical fertilizer plot attributing the cause to the delayed mineralization of compost N. The N specific fertilization efficiencies
of LCs N to urea N ranged from 8.8 to 24.6%, therefore only a small portion of N input by LCs application could be a substitute for fertilizer N and the rest has to be supplemented with proper N sources. This appears to be similar to the result of Sørensen et al. (1994).
Average of soil exchangeable K concentration during the main rice growth stage was not statistically different between LC plots and chemical ones (data was not shown here) implying that LCs’ K has an almost equivalent effect to fertilizer K.
Conclusions
There was a close relationship between phosphate fertilization rate and the increment of soil available phosphate content after the experiment, and from the relationship, the correlation on the phosphate application rate between fused superphosphate fertilizer and LC could be obtained as y = 2.7056x - 52.492 (x: P2O5
application rate of fused superphosphate, kg ha-1, y:
P2O5 application rate of LC, kg ha-1), which could be used as a tip to determine the proper application rate of LCs as a phosphate fertilizer. Plant height, number of tillers, nutrients uptake by rice and rice yield showed higher levels in Fer. N 100% and Fer. N 150% plots, while every LC plots exhibited lower values and no significant difference among them, and it was concluded that the nitrogen specific fertilization efficiencies of LCs would be very low compared to chemical fertilizer urea, which was 12.3% for CaC, 8.8 for SwC and 24.6 for ChC, respectively. This result means that great
portion of nitrogen fertilization rate recommended by soil test still might be needed to supplement with chemical N fertilizer even though the N input was practiced by LC application.
This research needs supplementary experiments because the fertilization method without topdressing in this experiment was different from normal practice which includes the topdressing of N and K. Nevertheless, these results could offer a useful piece of information on developing the practical fertilization method using LCs combined with chemical fertilizer for the cultivation of paddy rice.
References
Hadas, A. and R. Portnoy. 1994. Nitrogen and carbon mine- ralization rates of composted manures incubated in soil. J.
Environ. Qual. 23:1184-1189.
Jakob, M. and S.J. Lars. 2002. The production and use of animal manures. In Lars, S. J. et al. (eds.): Plant Nutrition Soil Fertility Fertilizers and Fertilization, 4th Edition, The Royal Veterinary & Agricultural University, Copenhagen, p. 16-36.
Kang, C.S. and A.S. Roh. 2011. Quality characteristics of livestock manure composts commercially produced in Gyeonggi province in 2008. Korean J. Soil Sci. Fert.
44(2):293-296.
Kang, C.S., A.S. Roh, S.K. Kim, and K.Y. Park. 2011. Effects of the application of livestock manure compost on reducing the chemical fertilizer use for the lettuce cultivation in green house. Korean J. Soil Sci. Fert. 44(3):457-464.
KFIA (Korean Fertilizer Industry Association). 2010. A fertilizer yearbook. p. 13.
Kim, H.J., J.H. Ryu, M.S. Park, and D.Y. Chung. 2011.
Underappreciated resources phosphate: Implication in agronomy. Korean J. Soil Sci. Fert. 44(1):78-83.
Kim, J.G. and K.Y. Jung. 2000. Amount of maximum compost application on the long-term application with different organic material sources in upland soil. Korean J. Soil Sci. Fert.
33(3):182-192.
Lim, S.S., S.M. Lee, S.H. Lee, and W.J. Choi. 2010. Dry matter yield and nutrients uptake of SorghumxSudangass hybrid grown with different rates of livestock manure compost.
Korean J. Soil Sci. Fert. 43(4):458-465.
Magid, J. and L.S. Jensen. 2002. The production and use of animal manures. p. 16-36. In L.S. Jensen (ed.). Plant Nutrition, Soil Fertility Fertilizers and Fertilization (4th ed.) The Royal Veterinary & Agricultural University, Copenhagen.
NIAST. 2000. Methods of soil and plant analysis. National Institute of Agricultural Science and Technology, RDA, Suwon, Korea.
NIAST. 2006. Fertilizer recommendation for crops. National Institute of Agricultural Science and Technology, RDA, Suwon, Korea.
Park, C.S. 1999. The compost believed as the tonic medicine of the agricultural soil may also the hemlock if used excessively.
Korean J. Soil Sci. Fert. 32(1):90-94
Paul, J.W. and E.G. Beauchamp. 1993. Nitrogen availability for corn in soils amended with urea, cattle slurry, and solid and composted manures. Can. J. Soil Sci. 73:253-266.
So, K.H., K.S. Seong, M.C. Seo, and S.G. Hong. 2007.
Environmental impacts of food waste compost application on paddy soil. Korean J. Soil Sci. Fert. 40(1):85-94.
Sørensen, P., E.S. Jensen, and N.E. Nielsen. 1994. The fate of
15N labelled organic nitrogen in sheep manure applied to soils of different texture under field conditions. Plant and Soil 162:39-47.
Song, Y.S., H.K. Kwak, B.K. Hyun, and P.J. Kim. 2001. Effects of composted pig manure on rice cultivation in paddy soils of different texture. Korean J. Soil Sci. Fert. 34:265-272.
Yoon, J.H., B.G. Jung, B.G. Park, and C.W. Shin. 1990. Proposal of prediction model for accumulation and decline of available phosphorus soil with long-term application of fertilizer phosphorus. RDA Research Report(S & F) 32(3):46-51.