기업의 시장성과는 신용위험에 영향을 미치는가?
Does Market Performance Influence Credit Risk?
임형주
*
, 다피드 말리**
극동대학교 글로벌경영학과
*
, 경성대학교 회계학과**
Hyoung-Joo Lim([email protected])
*
, Dafydd Mali([email protected])**
요약
본 연구는 당기 주가수익률과 차기 신용등급 및 신용등급 변화와의 관련성을 검증하는 것을 목적으로 한 다. 신용등급평가사들은 개별 기업의 채무불이행위험(default risk)을 측정하여 최종 신용등급을 결정하는 데 기업의 높은 주가수익률은 낮은 위험(default risk)으로 인지될 가능성이 있다. 반면 시장참여자들은 효 율적으로 높은 수익을 달성하기 위하여 규모가 크고 안정적인 기업보다 고수익을 달성할 수 있는 신용위험 (risk)이 높은 기업들의 주식을 선호할 가능성 역시 배제할 수 없다. 이는 실증적으로 해결되어야 할 문제이 며 현재까지 이러한 관련성을 고찰한 연구는 부재하다. 본 연구는 2002년부터 2013년까지 회사채를 발행한 유가증권 상장기업을 대상으로 당기 주가수익률과 차기 신용등급 및 신용등급의 관련성을 검증하였고, 그 결과를 요약하면 다음과 같다. 먼저 당기 주가수익률은 차기 신용등급과 유의한 음(-)의 관련성이 있는 것 으로 나타났다. 이는 신용평가사들이 주가수익률을 채무불이행 위험의 대리변수로 고려하지 않음을 예측케 하는 결과이고, 오히려 투자자들은 신용등급이 낮은 기업의 주식을 선호한다고 해석할 수 있다. 본 연구는 직관과는 달리 주가수익률과 신용등급의 음(-)의 관련성을 찾은 최초의 연구로써 신용평가사 및 시장참여 자들에게 의미 있는 통찰력을 제공할 것으로 기대한다.
■ 중심어 :∣주가수익률∣시장성과∣신용등급∣신용등급 변화∣
Abstract
This study aims to investigate the association between stock performance and credit ratings, and credit rating changes using a sample of 1,691 KRX firm-years that acquire equity in the form of long-term bonds from 2002 to 2013. Previous U.S. literature is mixed with regard to the relation between credit ratings and stock price. On one hand, there is evidence of a positive relation between credit ratings and stock prices, an anomaly established in U.S. studies. On the other hand, the CAPM model suggests a negative relation between stock prices and credit ratings, implying that investors expect financial rewards for bearing additional risk. To our knowledge, we are the first to examine the relationship between stock price and default risk proxied by credit ratings in period t+1. We find a negative (positive) relation between credit ratings (risk) in period t+1 and stock returns in period t, suggesting that credit rating agencies do not consider stock returns as a metric with the potential to influence default risk. Our results suggest that market participants may prefer firms with higher credit risk because of expected higher returns.
■ keyword :∣Stock Return∣Market Performance∣Credit Ratings∣Credit Rating Changes∣
접수일자 : 2015년 09월 02일 수정일자 : 2015년 10월 08일
심사완료일 : 2015년 10월 08일
교신저자 : 다피드 말리, e-mail : [email protected]
stock return, examining the relationship between risk and reward within a calender year. However, few studies examine whether market performance is significantly related to credit ratings and changes in period t+1.
Credit rating agencies calculate credit ratings based on default risk. A firm's credit ratings are assessed during a credit watch period, hence default risk should be related to credit ratings at period +1, not at period t. If credit ratings (default risk) in period are negatively (positively) related with stock return, we may expect the basic economic concept which establishes an association between risk and reward;
as risk increases, financial compensation should increase. This relation is established in the Capital Asset Pricing Model (CAPM).
On the other hand, there is evidence of an anomaly in financial markets, a positive (negative) relation between credit ratings (risk) and stock. The purpose of this paper is to establish if a relation exists between stock return in period t and credit ratings in period t+1. Whether or not credit rating agencies consider stock return as a metric with the potential to influence credit ratings in a Korean context is an empirical question left unanswered. To our knowledge, we are the first to examine this relationship.
Using ordered probit regression, we find that there is a negative (positive) relation between credit rating (risk) and stock return in period t+1. The results suggest that credit ratings agencies do not consider stock returns as a metric to influence credit ratings.
suggesting that there is a higher probability for firms with high stock return to keep their credit ratings stable. In our additional analysis, we partition our sample into 1) positive change, 2) no change, and 3) negative change and compare each sample. We find a significant negative relation between stock return and credit rating changes for negative vs no change, suggesting that firms with high market performance have a higher probability of keeping their credit ratings stable, consistent with our main results. Our findings may be of interest to credit rating agencies, regulatory authorities and market participants who believe the relation between stock return and credit rating is important for legislative and investment reasons.
The remained of this paper proceeds as follows. In the next section, we provide a review of relevant literature and develop hypotheses; in Section III, we explain the research design and model specification;
Section IV presents our results. Section V concludes.
II. Previous literatures and hypothesis development
A fundamental principle of economics is that high risk assets should provide higher expected returns.
The relationship between credit risk and stock returns have important implications for investors because investors predominantly base portfolio decisions on the concept of an efficient market
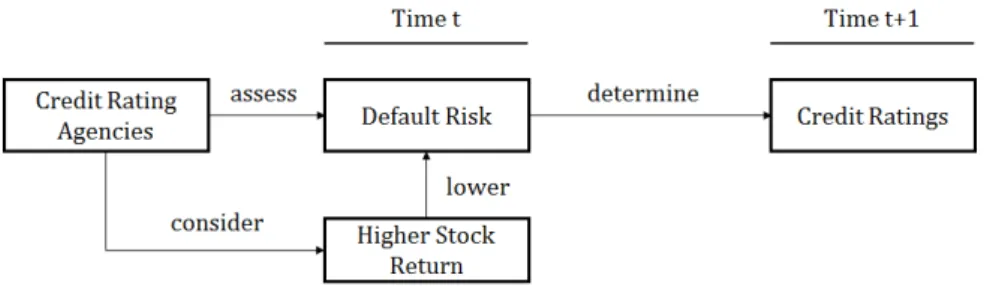
Fig. 1. Stock return and Credit ratings at time
hypothesis. If default risk and reward are systematic within the market, investors can expect a positive trade-off between risk and reward; therefore, investors demand a positive risk premium for bearing additional risk
1)
.The CAPM is designed to capture the risk-reward relationship in general terms. However, the CAPM model may fail to include all default risk associated with financial default[1]. The CAPM model excludes risk variables not attainable from financial statements such as human capital[2]. In the U.S., there is evidence that contradicts the evidence put forward by the CAPM model. Evidence exists of a negative (positive) relation between credit risk (credit rating) and returns[3][4].
In the U.S., negative credit-risk return in the bond market has been described as an anomalous pattern in the cross-section of stock returns because it suggests that investors do not pay an additional premium for bearing additional credit risk[5]. [6] suggest that the negative relation between default risk and stock return can be explained by bias due to growth firms.
[7] suggest that the negative relation between risk and return can be explained by the inclusion of positive leverage as well as stock return. Moreover, [8] argue that the risk-reward anomaly is not a anomaly perse, but a noisy ex-post realized return.
1) Previous studies have developed models to estimate default risk[9].
Therefore, to a large extent, the relation between stock return and risk is a growing field of literature that requires further study. Thus, the evidence on the relation between credit using various risk proxies and stock return is mixed. However, the relation between stock return in period t and credit rating in period t+1 is an empirical question left unanswered.
A credit rating is the current opinion of a credit rating agency about a firm's default risk. As a rule, there are ten credit ratings categories. The highest categories in descending order are AAA, AA, A, BBB, BB, B, CCC, CC, C, D; each category from AA to CCC is divided into subcategories with +/-. [10]
argue that credit ratings provide an ‘economically meaningful role’ by facilitating equilibrium in bond investment. Firms with a similar credit rating are grouped together as firms of similar quality[11].
Credit ratings are calculated using numerous financial and non-financial metrics[12][13]. Therefore, credit ratings can be considered as the most robust metric to calculate risk. Thus, we expect a relation between credit rating and stock returns.
In this study, we examine the relation between credit risk and credit ratings changes. [14] suggest that the negative relation between return and risk is higher for stocks around ratings downgrades.
We hypothesize a similar relation. [Figure 1] shows that credit ratings agencies asses the default risk of firms in period t, the credit watch period. In this
CR scores CR Obs CR sores CR Obs
17 AAA 85 8 BBB- 165
16 AA+ 67 7 BB+ 72
15 AA 78 6 BB 72
14 AA- 155 5 BB- 72
13 A+ 153 4 B+ 44
12 A 171 3 B 32
11 A- 187 2 B- 17
10 BBB+ 154 1 Below B- 32
9 BBB 135 Total 1,691
period, credit ratings agencies may decide to change credit ratings based on a firm’s default risk. We examine whether credit rating agencies consider a firm‘s stock return as a metric with the potential to influence credit rating changes. In the credit watch period, credit ratings agency analysts may consider stock return as a signal with the potential to influence credit ratings changes
2)
. Therefore, we develop the following hypothesis:H1: A firm’s market performance influences credit rating in the subsequent period.
III. Research Design
1. Sample Selection
All credit rating and financial data is collected from TS2000 and Data guide with a sample period from 2002 to 2013. [Table 1] illustrates our sample selection
2) Firms may engage in earnings management to influence credit ratings. Discretionary accruals may be one choice[15].
process. Credit rating scores are coded based on[16].
Our initial sample was 2,480, 739 post period firms were excluded, and an additional 50 firms with no financial data were excluded, leaving a total of 1,691 observations.
CR, our variable of interest represent the credit rating levels of all the firms that borrow equity through public debt in South Korea over our sample period 2002-2013. Credit ratings are collected from KIS, KR, NICE and SCI on a calendar year basis. All four credit ratings agencies have different methods of calculating credit ratings. Therefore, we run numerous mean-difference comparing all of the credit ratings issued by different credit ratings agencies.
The results suggest that there is a statistically insignificant mean difference for all four credit rating agencies. Therefore the combination of all the credit ratings for all four credit ratings agencies is a homogenous group. We exclude the results for brevity. Thus, CR is a combination of the highest credit rating level for all four of the largest credit ratings firms in South Korea KIS, KR, NICE and SCI.
The credit ratings take an ordinal score from 1 to 17.
The value of 17 represents the highest credit ratings levels of KIS, KR, NICE and SCI in a single calendar year, AAA. Firms with a credit rating of AA+ are coded with an ordinal score of 16, …B- firms receive an ordinal score coding of 2. All firms below CCC+
are given an ordinal score of 1.
2. Research Model
In equation 1, we examine the relationship between stock return, RET (12 months cumulative stock returns) in period t and credit ratings in period t+1. A statistically insignificant
coefficient would suggest no relation between stock return and credit ratings. A negative coefficient would suggest that as risk increase (credit rating decrease), stock returns increase, consistent with the CAPM model. A positive
coefficient suggest that as risk decreases (credit ratings increase), stock returns increase; an anomaly consistent with the findings of [3] and [4].
(1)
In equation 2, we examine the relationship between stock return in period t and credit rating increases in period t+1. D_Changes is a dummy variable that takes the value of 1 if credit ratings increase from period t to period t+1, 0 otherwise. A positive
coefficient suggests that firms with lower risk (higher credit ratings) experience a credit rating increase.
Therefore, a statistically significant RET coefficient suggests that credit ratings analysts may consider stock price as a metric with the potential to influence credit ratings.
(2)
Where,
Dependent Variables
: Credit ratings at time t+1
: Dummy variable that takes 1 if credit rating increased from t to t+1 period, 0 otherwiseVariables of Our Interest
RET : 12 months cumulative stock returns Control Variables
Control Variables
: Natural logarithm of total assets at time t-1
: Debt ratio
: Sales growth ratio
: Return on assets
: Cashflow from operation scaled by total outstanding shares
: Dummy variable that takes 1 if a firm experienced loss at time t-1, 0 otherwise ID : Industry fixed effectYD : Year fixed effect
Control variables are taken from previous studies.
Size, the natural logarithm of total assets at period t-1 is expected to be positive because larger firms tend to be more mature. Lev is a proxy for risk, firms with higher leverage tend to be riskier because any shock to the organization can have a dramatic effect on a firms future profitability, or even existence.
Therefore lower leverage is expected to have a positive relation with credit rating. Grw, growth is calculated as the growth ratio. Growth is expected to be positive. ROA, return on assets and CPS, cash flow from operations per share are proxies for performance, both are expected to be positive. Loss, is a dummy variable designed to capture financial loss.
ID, industry effect and YD, year effect are included.
Panel B: Pearson Correlation
1. 2. 3. 4. 5. 6. 7. 8.
CR_t+1 1
2. RET -0.07*** 1
3. Size 0.52*** 0.00 1
4. Lev -0.43*** 0.03 0.02 1
5. Grw 0.03 0.08*** 0.06** 0.04 1
6. ROA 0.38*** 0.13*** 0.19*** -0.39*** 0.23*** 1
7. CPS 0.31*** 0.03 0.29*** -0.22*** 0.04* 0.19*** 1
8. Loss -0.32*** -0.13*** -0.11*** 0.32*** -0.20*** -0.65*** -0.16*** 1
Note 1: Variable Definitions
: Credit ratings at time t+1 RET : 12 months cumulative stock returns
: Natural logarithm of total assets at time t-1
: Debt ratio
: Sales growth ratio+
: Return on assets
: Cashflow from operation scaled by total outstanding shares
: Dummy variable that takes 1 if a firm experienced loss at time t-1, 0 otherwise ID : Industry fixed effect
YD : Year fixed effect
Note 2: ***, **, * indicate significance level at 1%, 5%, 10%
respectively.
IV. Empirical Results
1. Descriptive Statistics
[Table 2] Panel A illustrates our descriptive statistics. The average credit ratings of our sample straddles the investment grade cut-off between BBB+
and A-. On average, stock return is positive, however, there is variation in the levels of stock return, 3.69 maximum, and –0.88 minimum. According to pearson correlations in Panel B of [Table 2], our
control variables show the expected sign; size, growth and our proxies for performance, ROA and CPS have a positive correlation with credit ratings;
leverage and loss are negatively related to credit ratings. Our dependent variable is negatively related with credit rating change in period t+1 for our entire sample. The results suggest that firms with lower credit risk are considered to have lower market performance compared to firms with higher credit risk.
2. Multivariate Analysis Results
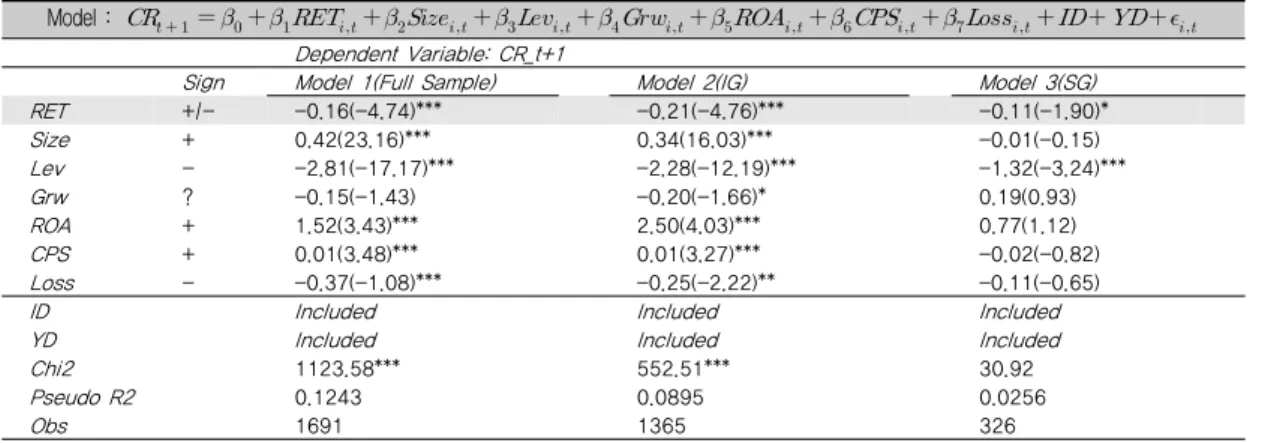
In [Table 3], we perform ordered probit regressions to establish the relation between credit rating/default risk in period t and stock return in period t+1. Model 1 shows the results for our entire sample. We find a statistically significant negative relation between our dependent variable risk, (proxied as credit ratings) in period t+1 and stock return in period t at 1% level.
Thus, our results suggest that as risk increase (credit ratings are lower), stock returns increase, consistent with the CAPM model. Thus. we do not find evidence consistent with hypothesis 1. Our results suggest that credit rating agencies do not consider high market
Table 3. Ordered Probit Regression Analysis (DV: Credit Ratings in t+1 period)
Model :
Dependent Variable: CR_t+1
Sign Model 1(Full Sample) Model 2(IG) Model 3(SG)
RET +/- -0.16(-4.74)*** -0.21(-4.76)*** -0.11(-1.90)*
Size + 0.42(23.16)*** 0.34(16.03)*** -0.01(-0.15)
Lev - -2.81(-17.17)*** -2.28(-12.19)*** -1.32(-3.24)***
Grw ? -0.15(-1.43) -0.20(-1.66)* 0.19(0.93)
ROA + 1.52(3.43)*** 2.50(4.03)*** 0.77(1.12)
CPS + 0.01(3.48)*** 0.01(3.27)*** -0.02(-0.82)
Loss - -0.37(-1.08)*** -0.25(-2.22)** -0.11(-0.65)
ID Included Included Included
YD Included Included Included
Chi2 1123.58*** 552.51*** 30.92
Pseudo R2 0.1243 0.0895 0.0256
Obs 1691 1365 326
Table 4. Logistic Regression Analysis (DV: Credit Rating Changes )
Model :
Dependent Variable: D_Change_t+1
Sign Model 1(Full Sample) Model 2(IG) Model 3(SG)
RET +/- -0.18(-2.22)** -0.09(-1.53) -0.19(-2.18)**
Size + 0.14(3.65)*** 0.06(2.36)** 0.15(2.57)**
Lev - 0.78(2.18)** 0.71(2.86)*** -0.36(-0.63)
Grw ? -0.34(-1.41) -0.27(-1.63) -0.09(-0.32)
ROA + 0.82(0.82) 1.57(1.90)* -1.13(-1.22)
CPS + -0.01(-1.11) -0.00(-1.04) 0.02(0.80)
Loss - 0.02(0.09) 0.08(0.56) -0.12(-0.52)
ID Included Included Included
YD Included Included Included
LR Chi2 28.01*** 22.68*** 18.40***
Pseudo R2 0.0146 0.0145 0.0381
Obs 1691 1365 326
Note 1: Variable Definitions ID : Industry fixed effect YD : Year fixed effect Other variables are defined in [Table 2]
Note 2: Group Definitions
IG : Investment grade group (Credit rating is BBB- or above)
SG : Speculation grade(or non-investment grade) group (Credit rating is below BBB-)
Note 3***, **, * indicate significance level (z value) at 1%, 5%, 10% respectively.
performance as proxy for low default risk. In our second probit regression analysis, we divide our sample into investment grade group(IG) and speculation grade group(SG). We find the consistent results, but the relation is stronger (significant at 1%
level) for the IG group in which dependent variable is
the credit ratings of only investment grade firms in period t+1, suggesting that higher credit risk can be seen as higher expected returns for investment grade firms. Since IG firms are considered safe investments, lower grade(therefore higher risk) firms may be preferred in the stock market for expected higher return. In model 3, we use CR at time t+1 as the dependent variable for non-investment grade firm(SG). Our results for the non-investment group is marginally significant at the 10% level. Taken together, the results suggest that credit rating agencies may not consider market performance as a metric for default risk. However, we interpret the negative association that market participants may prefer firms with higher credit risk for higher returns.
Loss - -0.71(-1.81)* -0.34(-1.26) 0.49(1.75)*
ID Included Included Included
YD Included Included Included
Chi2 54.30*** 28.58*** 49.63***
Pseudo R2 0.1037 0.0186 0.0581
Obs 430 1563 1389
Note 1: Variable Definitions
for the positive vs negative model : Dummy variable that takes 1 if credit rating increased from t to t+1 period, 0 if decreased.
for the positive vs no change model : Dummy variable that takes 1 if credit rating increased from t to t+1 period, 0 if unchanged.
for the negative vs no change model : Dummy variable that takes 1 if credit rating decreased from t to t+1 period, 0 if unchanged.
Other variables are defined in [Table 2]
Note 2: ***, **, * indicate significance level at 1%, 5%, 10%
respectively
This relation is stronger for the IG sample, suggesting that investors may prefer stocks with higher risk (therefore, higher return), implying that IG_BBB+ stocks may be preferred over IG_AAA stocks because AAA stocks are already more expensive (therefore, lower return).
In [Table 4], we examine the relation between a change in credit rating in period t+1 and stock return in period t using a dummy variable approach where CR takes a value of 1 if credit ratings change from period t to period t+1.
Our results show a statistically significant relation between stock in period t and credit rating in period t+1 for our entire sample and the non-investment grade group at the 5% level. The results for the
investment grade group show the correct sign;
however, the results are statistically insignificant.
Overall, the results suggest it is likely that the credit ratings of firms with higher stock returns remain stable.
In [Table 5], we examine the effect of stock return on credit rating changes for 3 sub-groups. D_change is a dummy variable establishing the affect of stock return in period t on credit ratings changes in period t+1. In column, 1 we find a statistically insignificant difference between positive and negative change.
Column 2 shows that the stock return of firms that did not experience a credit rating change, and firms that experienced a credit rating change were not statistically different. In column 3, we find that firms that experience a credit rating decrease show lower levels of stock returns in period t compared to firms that did not experience a credit rating change in the following period. Overall, these results suggest that firms with high market performance have a higher probability of keeping their credit ratings stable, consistent with our main results.
V. Conclusion
The CAPM model is associated with the economic
theory that suggest that a systematic relation between risk and reward. Thus, investors should demand a higher risk premium of bearing additional risk. However, previous literature suggest that an anomaly exists in the public bond market[3-5]. This anomaly has the potential to provide investors with financial rewards and low risk because of a potentially inverse relation between risk and reward.
Previous studies examine the association between risk and reward in period t. In this paper we establish the relation between stock return in period t and credit rating in period t+1 because credit ratings firms and analysts do not determine credit ratings immediately.
Our results suggest that there is a negative relation between stock return in period t and credit ratings in period t+1. The results suggest that credit ratings analysts do not consider credit ratings as a metric with the potential to influence default risk in subsequent periods. Whilst we do not find evidence that a firm’s market performance influences credit rating in the subsequent period, we find that market participants may prefer to invest in non-investment grade bonds because of the expectation of a higher level of bond yield because of higher levels of default risk. Moreover, we find that stock returns are negatively related to credit rating changes, suggesting it is likely that the credit ratings of firms with high stock return remain the stable. Additional analysis supports our main findings, suggesting that firms with high market performance have a higher probability of keeping their credit ratings stable.
Thus, overall, we do not find evidence consistent with our initial hypothesis, stock returns do not influence credit ratings and credit rating changes in period t+1.
However, market participants may use credit ratings to purchase risker bonds with higher returns.
Although we fail to find an evidence that credit
rating agencies consider a higher market performance as a lower default risk, our results suggest that firms with lower credit ratings may be more attractive to market participants who seek for higher return. Since firms with higher credit ratings tend to be big firms with stabilized share price, it may be difficult for investors to achieve high return from them. On the contrary, non-investment grade firms can be seen as attractive investments if a bright prospect can be predicted. Future studies may compare the relation between market performance and credit ratings at time t+1 among different countries.
참 고 문 헌
[1] R. C. Merton, “On the pricing of corporate debt:
the risk structure of interest rates,” Journal of Finance, Vol.29, pp.449-470, 1974.
[2] E. F. Fama and J. K. MacBeth, “Risk, return, and equilibrium: empirical tests,” Journal of Political Economy, Vol.81, pp.607-636, 1973.
[3] I. D. Dichev, “Is the risk of bankruptcy a systematic risk?,” Journal of Finance, Vol.53, pp.1131-1147, 1998.
[4] J. Y. Campbell, J. Hilscher, and J. Szilagyi, “In search of distress risk,” Journal of Finance, Vol.63, pp.2899-2939, 2008.
[5] D. Avramov, T. Chordia, G. Jostova, and A.
Philipov, “Credit ratings and the cross-section of stock returns,” Journal of Financial Markets, Vol.2, pp.469-499, 2009.
[6] J. M. Griffin and M. L. Lemmon,
“Book-to-Market Equity, Distress-Risk, and Stock Returns,” Journal of Finance, Vol.57, No.23, pp.17-36, 2002.
[7] T. J. George and C. Y. Hwang, “A resolution of the distress risk and leverage puzzles in the
financial data for enhancing international competitiveness,” The Journal of the Korea Contents Association, Vol.7, No.12, pp.123-130, 2007.
[10] A. W. Boot, A. T. M. Todd, and S. Anjolein,
“Credit ratings as coordination mechanisms,” Review of Financial Studies, Vol.19, No.1, pp.81-118, 2006.
[11] D. Kisgen, “Credit ratings and capital structure,”
Journal of Finance, Vol.61, No.3, pp.1035-1072, 2006.
[12] S. Bhojraj and P. Sengupta, “Effect of Corporate Governance on Bond Ratings and Yields: The Role of Institutional Investors and Outside Directors,” The Journal of Business, Vol.76, No.3, pp.455-476, 2003.
[13] H. Ashbaugh-Skaife, D. Collins, and R.
LaFond, “The effects of corporate governance on firms’ credit ratings,” Journal of Accounting and Economics, Vol.42, pp.203-243, 2006.
[14] P. Kraft, “Do rating agencies cater?: Evidence from rating-based contracts,” Journal of Accounting and Economics, Vol.59, No.2-3, pp.264-283, 2014.
[15] H. J. Lim, “A study on non-audit service and audit quality, focused on the comparison between Big4 and Non-Big4 audit firm,” The Journal of the Korea Contents Association, Vol.15, No.7, pp.477-488, 2015.
[16] W. Alissa, S. B. Bonsall, K. Koharki, and M.
W. Penn, “Firms' use of accounting discretion to influence the credit ratings,” Journal of
▪2009년 : 부산대학교 경영학과 (석사)
▪2013년 : 부산대학교 경영학과 (박사)
▪2014년 ∼ 현재 : 극동대학교 글 로벌 경영학과 조교수
<관심분야> : 지배구조, 이익조정, 보수주의, 패널데 이터, CSR, IFRS
다피드 말리(Dafydd Mali) 정회원
▪2009년 : University of Liverpool (MBA)
▪2015년 : 부산대학교 경영학과 (박사)
▪2012년 ∼ 현재 : 경성대학교 회 계학과 조교수
<관심분야> : 환경분야, 기업지배구조, 이익조정, 재 무회계