Introduction
Neuroblastoma, which is derived from the sympathoa- drenal cell lineage of neural crest origin [3], is one of the most common solid tumors of children. Genetic alterations commonly found in these cells include deletion 1p; loss of heterozygosity of 1p, 11q and 14q; and amplification of N-myc [2,15]. Cloned murine neuroblastoma cells have been widely used as a model system for neural cells. In particular, murine Neuro-2a (N2a) cells are frequently used not only to investigate the differentiation and trophic interaction of neuronal cells because of their rapid changes in morphology [13], but also to examine the neurotoxic effects of various compounds and their associated mechanisms [7,9,18]. Many characteristics of N2a might be associated with genomic var- iations such as gain or loss in DNA copy number. However, no publications have reported on chromosomal aberrations of N2a cells, which might bring about the unexpected ex- perimental results or a misinterpretation of experimental
data. The present study aimed, for the first time, to system- atically examine the chromosomal aberration of N2a cells in high resolution. Oligonucleotide array-based comparative genomic hybridization (oaCGH) has become a successful and valuable tool for chromosome copy number analysis [16]. Therefore, we examined the chromosomal aberrations of N2a cells with an oaCGH platform from Agilent Technologies (http://www.agilent.com) that consists of 60-mer oligonucleotides synthesized on arrays with approx- imately 35kb resolution. In addition, we analyzed our oaCGH data with a Hidden Markov Model (HMM) consist- ing of six DNA copy number states: double loss, single loss, normal, gain, double gain and amplification. Most aberra- tional regions in the N2a genome are composed of single loss or gain of DNA copy number state rather than double loss, double gain or amplification.
Materials and Methods Cell culture and DNA extraction
Neuro-2a (N2a) cells (CCL-131, American Type Culture Collection, VA, USA) were cultured in Dulbecco’s Modified
High Resolution Genomic Profile of Neuro2a Murine Neuroblastoma Cell Line by Array-based Comparative Genomic Hybridization
Jin Hwan Do, In Su Kim1, Hyun Myung Ko1 and Dong-Kug Choi1* HumanGenome Center,Institute of MedicalScience, University of Tokyo, Tokyo 108-8639,Japan
1Departmentof Biotechnology, Konkuk University, Chungju 380-701, Korea
Received February 12, 2009 /Accepted March 17, 2009
Murine Neuro-2a (N2a) cells have been widely used for the investigation of neuronal differentiation, trophic interaction and neurotoxic effects of various compounds and their associated mechanisms.
N2a cells have many genomic variations such as gains or losses in DNA copy number, similar to other neuroblastoma cells, and no systematic or high-resolution studies of their genome-wide chro- mosomal aberrations have been reported. Presently, we conducted a systematic genome-wide deter- mination of chromosomal aberrations in N2a cells using a high-throughput, oligonucleotide ar- ray-based comparative genomic hybridization (oaCGH) technique. A hidden Markov Model was em- ployed to assign each genomic oligonucleotide to a DNA copy number state: double loss, single loss, normal, gain, double gain and amplification. Unlike most neuroblastoma cells, Mycn amplification was not observed in N2a cells. In addition, these cells showed gain only in the neuron-derived neu- rotrophic factor (NF), while other neurotrophic factors such as glial line-derived NF and brain-de- rived NF presented normal copy numbers. Chromosomes 4, 8, 10, 11 and 15 displayed more than 1000 aberrational oligonucleotides, while chromosomes 3, 17, 18 and 19 displayed less than 20. The largest region of gain was located on chromosome 8 and its size was no less than 26.7 Mb (Chr8:8427841-35162415), while chromosome 4 had the longest region of single deletion, with a size of 15.1 Mb (Chr4:73265785-88374165).
Key w ords : N euroblastom a, chrom osom alaberration, N euro2a, oligonucleotide array-C GH
*Corresponding author
*Tel +82-43-840-3610, Fax +82-43-840-3872: :
*E-mail : [email protected]
Eagles Medium (GIBCO, NY, USA) supplemented with 10%
heat-inactivated fetal bovine serum, penicillin (final concen- tration, 100 U/ml), and streptomycin (final concentration, 0.1 mg/ml) and maintained in a humidified incubator with 5% CO2. Genomic DNA was extracted as described pre- viously [5].
Genomic DNA labeling and hybridization to oligonucleotide microarray
For each CGH hybridization, 20 ng of genomic DNA from the reference mouse genomic DNA (Cat.#G3091, Promega, Madison, WI, USA) and the N2a genomic DNA were ampli- fied with GenomePlex whole genome amplification kit ac- cording to the supplier’s protocols (Sigma, MO, USA).
Briefly, the random fragmentation step was performed by incubating the mixture of 10X fragmentation buffer and ge- nomic DNA sample at 94oC for exactly 4 min. The frag- mented samples immediately were cooled on the ice. For OmniPlex library preparation, the fragmented samples were mixed with 1X library buffer and library stabilization sol- ution and then heated at 95oC for 2 min. Library preparation enzyme was added into the samples and placed in thermal cycler and incubated as follows; 16oC for 20 min, 24oC for 20 min, 37oC for 20 min, 75oC for 5 min, and finally 4oC hold. Whole genome amplification (WGA) reaction was car- ried out in a volume of 20 µl with 15 µl the OmniPlex library sample, 7.5 µl of 10X amplification master mix and 12.5 unit of W GA DNA polymerase. Amplification conditions were the follows; initial denaturation at 95oC for 3 min, 14 cycles of 95oC for 15 sec and 65oC for 5 min, and hold at 4oC. The amplified samples were purified by using QIAQuick PCR clean-up kit (QIAGEN, CA, USA). Labeling reactions were performed with 5 µg of purified amplified DNA and a Bioprime labeling kit (Invitrogen, CA, USA) according to the manufacturer’s instructions in a volume of 50 µl with a modified dNTP pool containing 120 µM each of dATP, dGTP, and dCTP; 60 µM dTTP; and 60 µM Cy5-dUTP for N2a sample and Cy3-dUTP for the reference sample.
Labeled targets were subsequently purified by using QIAQuick PCR clean-up kit (QIAGEN). After checking label- ing efficiency, Cy3-labeled and Cy5-labeled DNA targets were mixed and adding 10X blocking solution and 2X hy- bridization buffer and human Cot-1 DNA (Applied Genetics, FL, USA) and incubating at 95oC for 5 min, 37oC for 30 min.
The labeled targets were directly pipetted onto assembled mouse genome CGH microarray 44K (Agilent Technologies,
CA, USA) containing in situ synthesized 60-mer oligonucleo- tides for 43,000+ coding and noncoding mouse sequences.
The arrays hybridized at 65oC for 40 hr using Agilent Hybridization oven (Agilent Technologies). The hybridized microarrays were washed as the manufacturer’s washing protocol (Agilent Technologies).
Image and data analysis
Micorarry slide images were obtained by a GenePix 4200A laser scanner (Axon Instruments, CA, USA) and were saved as a GenePix Result (GPR) format. The GPR files were imported into GeneSpring 7.2 (Agilent, CA, USA) and were normalized by the intensity-dependent “lowess normal- ization” method. The ratio of Cy5/Cy3 should theoretically be 0.5 (1/2) for a single loss, 1 (2/2) for the normal state, 1.5 (3/2) for a gain when N2a DNA and reference DNA are labeled by Cy5 and Cy3, respectively. In practice, micro- array experiments are subject to sources of variation which create noise and bias the theoretical values. To reduce the experimental biases, the average for two replicate arrays was used for our analysis. The sex chromosomes X and Y are excluded in our analysis because the reference genomic DNA was isolated from whole blood of disease-free mice whose sex is unclear. We used a segmental maximum a pos- teriori approach (SMAP, www.bioconductor.org) to analyze the oaCGH data. The SMAP is an R (www.r-project.org) package developed by Andersson et al. [1] for genome-wide copy number profiling. The SMAP is based on discrete-index Hidden Markov Model (HMM) and incorporates genomic distance and overlap between clones or oligonucleotides. For a given sequence of length T of olionucleotides, which is the total number of oligonucleotides, and the corresponding sequence of observed intensity ratios O ={o1,...,oT}, and chromosomal position P ={p1,...,pT}, and chromosomal identifiers Ch ={ch1,...,chT}, such that cht∈{1,...,C}(1≤t
) T
≤ , the most plausible sequence of copy number assign- ments, Q ={q1,...,qT}, is inferred using an HMM which is a pair H =(S,λ), where S={si}Ni=1is a set of N DNA copy number states, such that qt∈S(1≤t≤T), and λ=(Π,A,Ω)are parameters for the model. In this study, we employed a six-state model consisting of double loss, single loss, normal, gain, double gain and amplification, i.e. N=6. Given a se- quence of observations O, chromosomal positions P and known parameters λ, the probability of a certain sequence of copy number assignments can be obtained by the a poste- rior probability density function (pdf):
( )
) , (
) , , ( ) , , (
, λ
λ λ λ
P O p
P Q O p p Q P p
O Q
p =
where p(QP,λ) is the a prior pdf of the copy number states, p(OQ,P,λ)is the likelihood of the observed intensity ratios and p(OP,λ) is a normalization constant. Therefore, the most probable sequence of copy number assignments can be inferred by posterior maximization, i.e. Q =* argmax
)]
, , ( [pQOOλ
Q . However, in most cases the parameter λ is unknown. Therefore, the SMAP finds the most plausible state sequence Q* by maximizing the joint probability of Q and λ given O and P as below
∏ ∏
= =
= Ω Π
=
=
=
N
j i
N
i
i i i d ij Q
Q
p p p a p p
A p p p
p P O Q p
P O Q p Q
1
, 1
*
) ( ) ( ) ( ) ( ) ( ) ( ) ( ) (
)]
( ) , , ( [ max max arg
)]
, , ( [ max max arg
σ µ π λ
λ λ λ
λ λ
where Q* is called the segmental MAP estimate of Q.
Alternate maximization over Q, λ gives a sequence of esti- mates with non-decreasing values of p(Q,λO,P) for any stating parameter estimate λ(m)[6], i.e.
)]
( ) , , ( [ max arg
, ] , , ( [ max arg
), , , ( ) , , (
) ( )
1 (
) ( )
(
) ( ) ( )
1 ( ) 1 (
λ λ λ
λ λ λ
λ
p P O Q p
P O Q p Q
P O O p P O Q
p
m m
m Q
m
m m m
m
=
=
≥
+ + +
The SMAP uses the gradient descent method to find the parameters λ maximizing the p(Q(m),OP,λ p) (λ). The start chromosomal location for each oligonucleotide is based on the mouse genome database (UCSC mm8, NCBI Build 36).
Validation of DNA copy number aberration from oaCGH data by polymerase chain reaction
To test the reliability of oaCGH data, we carried out a polymerase chain reaction (PCR) against three genomic re-
gions showing normal, single loss and gain in N2a cells. The primer sequences and genomic regions are shown (Table 1).
PCRs were performed in a total volume of 20 µl of ExTaqTM (Takara, Japan) with 100 ng of the genomic DNA samples isolated from N2a cells and from reference mice, re- spectively, a final concentration of 10 pmoles/µl oligonu- cleotide primers. The reference mouse genomic DNA was the same as that used in the oaCGH experiment (Cat.#G3091, Promega, W I, USA). The cycle number of the PCRs was selected to be between the mid-exponential phase and the late-exponential phase increase in DNA copy number. The thermal cycling conditions of the PCRs were as follows: normal and single loss regions, 30 cycles of dena- turation at 98°C for 10sec, annealing at 60°C for 30sec, and extension at 72°C for 60sec; gain region, 27 cycles of denaturation at 98°C for 10sec, annealing at 60°C for 30sec, and extension at 72°C for 60sec.
Results
Genomic variations of murine neuroblastoma N2a cells
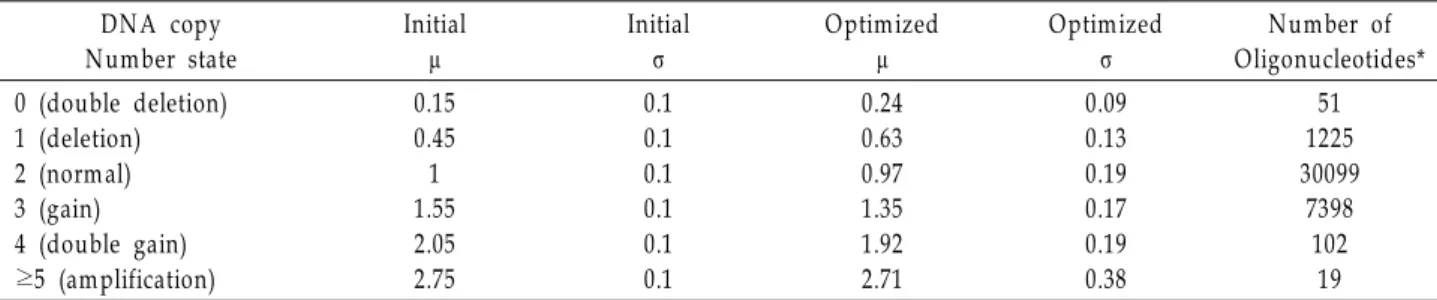
We employed a biologically motivated six-state model for DNA copy number, proposed by van de Wiel et al. [16], rath- er than the conventional three-state model that includes loss, normal and gain to analyze our oaCGH data. The six-state model consists of double loss, single loss, normal, gain, dou- ble gain and amplification. In addition, each state is assumed to have a Gaussian distribution. The initial values of mean and standard deviation for each state are given in Table 2.
The optimized mean and standard deviation were obtained by adaptation of HMM to oaCGH data in sequential max- imum a posteriori probability (SMAP). Prior to chromosomal aberrations of N2a cells, we surveyed the DNA copy number
Table 1. PCR conditions for the amplification of genom ic regions showing loss, norm al and gain of DNA copy number in N2a cells
DNA copy number in
N2a cells Prim er sequence (5` 3`)→ Genomic region covered AFa
(bp)
PCR condition A Tb(oC) cycles Norm al forward
reverse
ACTGTGCCTGGTGCTGACAT
CTAGCCTTCCATCCCCTCA G chr13:55461602-55463802 587 60 30
Gain forward
reverse
CA AACACCCGCA GCTAA AGA
GCAGTCCA ATGATGTGCTA CC chr13:112569626-112571826 598 60 27
Loss forward
reverse
CCTCCAGTGGTCTTCACCCT
TGAA CA CCTTGCCTTTGAGC chr13:23429082-23431282 554 60 30 A Fa, am plified fragment (bp); A Tb, annealing temperature (oC)
(A)
(B)
Fig. 1. The genomic profile of N2a cells with six states of HMM.
The six colors represent the six DNA copy number states:
black (double deletion), red (single deletion), green (normal), blue (gain), cyan (double gain) m agenta (amplification). (A) W hole chrom osom e profile of oaCGH data. The vertical and horizontal axes represent ratio of N2a DNA to norm al DNA and chromosome num ber, respectively. (B) The profile of oaCGH data in each chromosome over chromosomal location (bp). The vertical and horizontal axes represent ratio of N2a DNA to normal DNA and chromosomal position, respectively.
Fig. 2. The distribution of aberrational oligonucleotides in each chromosome. The vertical and horizontal axes represent the number of aberrational oligonucleotide and chromo- som e num ber, respectively. The blue color presents the total num ber of aberrational oligonucleotide, while the red color is the number of oligonucleotides with various gains including gain, double gain and am plification.
aberration of neurotrophic factor (NF) and its receptor in N2a cells because neural crest-derived cells can be regulated to proliferate or differentiate by neurotrophins including nerve growth factor (NGF), brain-derived neurotrophic fac- tor (BDNF) and neurotrophin-3 (NT-3) via their respective receptors, TRKA, TRKB and TRKC [4,8,11,14]. TRKB is fre- quently expressed in N-myc amplified tumors and may pro- mote tumor cell survival and invasive activity through an autocrine or paracrine mechanism involving BDNF [12].
Neuroblastoma N2a cells showed gain only in neu- ron-derived neurotrophic factor (NDNF) while GDNF and BDNF presented normal copy number. In addition, the NF-related receptors Ntrk2, Ntrk3, Gfra1, Gfra2, Gfra3 and Gfra4 showed a normal DNA copy number. The amplifica- tion of Mycn was also not observed, contrary to most neuro- blastomas, but its down-regulated genes Ndrg1 and Ndrg4 showed gain of DNA copy number. Similar to many cancer cells or immortalized cell lines, N2a cells display a loss of Table 2. The initial and optimized values of m ean (μ) and standard deviation ( ) for each state of DNA copy numberσ
DNA copy Number state
Initial µ
Initial σ
Optimized µ
Optimized σ
Number of Oligonucleotides*
0 (double deletion) 1 (deletion) 2 (norm al) 3 (gain) 4 (double gain)
≥5 (amplification)
0.15 0.45 1 1.55 2.05 2.75
0.1 0.1 0.1 0.1 0.1 0.1
0.24 0.63 0.97 1.35 1.92 2.71
0.09 0.13 0.19 0.17 0.19 0.38
51 1225 30099
7398 102
19
*the number of oligonucleotide belonging to each DNA copy num ber state after optimization of µ and σ .
suppressor genes like Hrasls3 (NM_139269) and gain of on- cogenes such as Rabl2a (NM_026817).
The genomic profile of N2a cells are shown in Fig. 1. The six colors used represent the six states in DNA copy number:
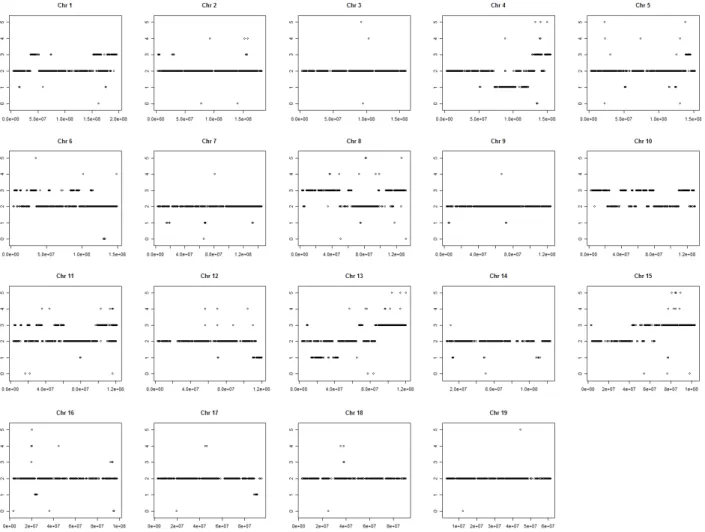
black (double loss), red (single loss), green (normal), blue (gain), cyan (double gain) and magenta (amplification). The number of oligonucleotides showing aberrations in DNA copy number was 8796, which constituted 23% of the total oligonucleotides studied. Ninety-eighty percent of aberra- tional oligonucleotides belonged to single loss or gain and 85% were associated with various gain states in DNA copy number (Table 2). Chromosomes 4, 8, 10, 11 and 15 had more than 1000 aberrational oligonucleotides, while chromosomes 3, 17, 18 and 19 displayed less than 20 (Fig. 2). For a clearer representation of DNA copy number states in each chromo- somal location, we plotted the profile of DNA copy number state for each chromosome (Fig. 3). The largest region of gain
was located on chromosome 8 and its size was no less than 26.7 Mb (Chr8:8427841-35162415), while chromosome 4 had the longest region of single deletion with a size of 15.1 Mb (Chr4:73265785-88374165) (Table 3). The number of oligonu- cleotides with a single loss in chromosomes 4, 5, 13 and 16 ascended to more than 30% of the total aberrational oligonu- cleotides on each chromosome, in contrast to chromosomes 1, 2, 6, 8, 10, 11 and 15, which had mainly gain of chromoso- mal aberration (Figs. 2 and 3).
Confirmation of oaCGH data by polymer chain reaction
To test the reliability of the oaCGH data, we conducted polymerase chain reaction (PCR) to amplify three genomic regions that had displayed normal, single deletion and gain in oaCGH data. As the ratio of a single oligonucleotide (spot) in oaCGH data provides a representative value for the ap-
Fig. 3. Copy number state profile for each chromosome. The vertical and horizontal axes represent the copy num ber state and chrom osom al location (bp), respectively. The DNA copy num ber states 0, 1, 2, 3, 4, 5 and 6 represent double loss, single loss, normal, gain, double gain and amplification of DNA copy number, respectively.
proximately 35-kb genomic region, we chose the genomic regions for the PCR test from copy number stable genomic region that maintains the same state of DNA copy number in long range ≥1 Mb. In addition, all test genomic regions were selected from the same chromosome with both loss and
gain aberrations for the clear representation of chromosomal imbalance. The primer sequences and genomic regions are shown in Table 1. The included genes on each region were Gprk6 (normal region), Abt1 (single deletion region) and Gpbp1 (gain region). The difference of the initial amount Table 3. The chromosomal aberrational regions with sam e DNA copy number state over long range ( 1 M b)≥
Chromosome Chrom osom al location (size (M b), DNA copy number state)
1
Chr1:14870952-15875335 (1.0, 1), Chr1:36210559-52046369 (16.0, 3), Chr1:152827844-158303332 (5.5, 3), Chr1:159379583-161967580 (2.6, 3), Chr1:165886030-167428847 (1.5, 3), Chr1:179515258-183658644 (4.1, 3), Chr1:185682037-190709390 (5.0, 3), Chr1:190996460-196871859 (5.9, 3)
2 Chr2:3624394-6122470 (2.5, 3)
4
Chr4:51198419-52745230 (1.5, 1), Chr4:73265785-88374165 (15.1, 1), Chr4:89617858-100792040 (11.2, 1), Chr4:101149548-104267925 (3.1, 1), Chr4:112125091-116244795 (4.1, 1), Chr4:116652861-118477303 (1.8, 1), Chr4:118698044-119799028 (1.1, 1), Chr4:120201872-122695521 (2.5, 1), Chr4:131837732-139001915 (7.2, 3), Chr4:139123537-140192396 (1.1, 3), Chr4:146666967-149827601 (3.2, 3), Chr4:149849372-155028976 (5.2, 3) 5 Chr5:138742968-142911467 (4.2, 3), 143276190-145704260 (2.4, 3) 6
Chr6:4475810-8580530 (4.1, 3), Chr6:27568619-34703935 (7.1, 3), Chr6:53165457-54437239 (1.3, 3), Chr6:83919758-85343104 (1.4, 3), Chr6:91664951-96014807 (4.3, 3), Chr6:112432425-113681877 (1.2, 3)
8
Chr8:3151837-4524923 (1.4, 3), Chr8:8427841-35162415 (26.7, 3), Chr8:35218222-37146622 (1.9, 3), Chr8:37930642-48936608 (11.0, 3), Chr8:60180098-64448714 (4.3, 3), Chr8:97476541-98684517 (1.2, 3), Chr8:106979517-112888491 (5.9, 3), Chr8:113662285-114647390 (1.0, 3), Chr8:116576103-125956454 (9.4, 3), Chr8:126120139-131912936 (5.8, 3)
9 Chr9:5302346-6418030 (1.1, 1)
10
Chr10:3051921-6867084 (3.8, 3), Chr10:7281921-22529882 (15.2, 3), Chr10:24284285-25300016 (1.0, 3), Chr10:38612811-45612119 (7.0, 3), Chr10:57942136-70788595 (12.8, 3), Chr10:74090487-79470491 (5.4, 3), Chr10:110126294-122602508 (12.5, 3), Chr10:127212252-128570992 (1.4, 3)
11
Chr11:18862572-20138380 (1.3, 3), Chr11:20594189-21686646 (1.1, 3), Chr11:31710004-35733852 (4.0, 3), Chr11:51463693-55037352 (3.6, 3), Chr11:57297784-60605786 (3.3, 3), Chr11:98797852-102703982 (3.9, 3), Chr11:102815548-110114229 (7.3, 3), Chr11:120605270-121652569 (1.0, 3) 12 Chr12:110296986-111773850 (1.5, 1), Chr12:114361459-119905025 (5.5, 1)
13
Chr13:13843491-15810835 (2.0, 1), Chr13:17667293-19158261 (1.5, 1), Chr13:22059672-24623650 (2.6, 1), Chr13:25064128-27356432 (3.0, 1), Chr13:38146972-43566130 (5.4, 1), Chr13:67340620-71351933 (4.0, 3), Chr13:85668336-96802597 (11.1, 3), Chr13: 97497472-102048867 (4.6, 3), Chr13:102802057-113844080 (11.0, 3), Chr13:114284416-120556883 (6.3, 3) 14 Chr14:12969090-14243791 (1.3, 1), Chr14:107693618-112289290 (4.6, 1)
15
Chr15:42908270-46489830 (3.6, 3), Chr15:50487545-52165659 (1.7, 3), Chr15:54539781-61783521 (7.2, 3), Chr15:64489112-76543576 (12.1, 3), Chr15:77424795-82979015 (5.6, 3), Chr15:83281940-84383682 (1.1, 3), Chr15:85069288-88519703 (3.5, 3), Chr15:89480001-103393017 (14.0, 3)
16 Chr16:23024872-25337641 (2.3, 1)
17 Chr17:88441369-91140858 (2.7, 1)
The DNA copy number states 0, 1, 2, 3, 4, 5 and 6 represent double loss, single loss, normal, gain, double gain and amplification of DNA copy number, respectively. The regions with losses in DNA copy number are marked with gray background.
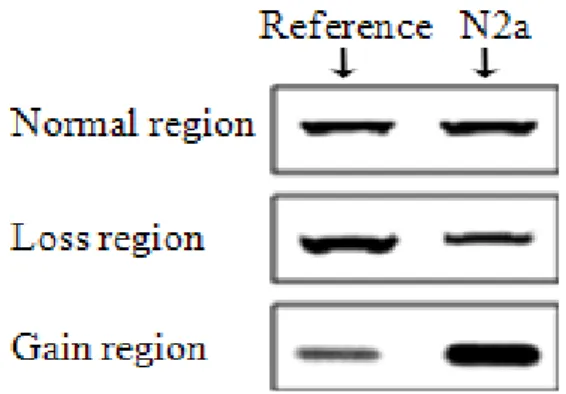
Fig. 4. Comparison of PCR product quantities for three genomic regions in N2a DNA and normal mouse (reference) DNA exam ined by gel electrophoresis.
of DNA or DNA copy number would make the amount of PCR end-product different and simply identified by agarose gel electrophoresis. There was no change in the quantity of PCR end-product for normal region, but a marked change in the amount of PCR end-product was observed in the re- gions with DNA copy number aberrations (Fig. 4). The quan- tity of PCR end-product derived from N2a genomic DNA in the gain region was greater than that obtained from nor- mal mouse genomic DNA, while the quantity of the PCR end-products in the single loss region was much less than normal mouse DNA. This result is a good agreement with oaCGH data.
Discussion
Presently, we surveyed chromosomal aberrations of N2a cells in genome-wide high-resolution study using micro- array-based technique with HMM. Many regions with chro- mosomal imbalances were successfully identified in N2a cells. For example, chromosomes 4, 8, 10, 11 and 15 had more than 1000 aberrational oligonucleotides, while chromosomes 3, 17, 18 and 19 had less than 20. The total size of genomic regions with losses was 74.9 Mb, while the overall size of genomic regions with gains was 322.3 Mb. However, it is conceivable that the chromosomal aberrations could be due, in part, to strain difference. Mouse genomic DNA obtained from Promega (Madison, W I) was used as reference; it was not clear whether this genomic DNA was from the same strain as that used for establishing N2a. Furthermore, the X and Y chromosomes have not been evaluated because the reference genomic DNA was isolated from whole blood of disease-free mice whose sex was unclear. The genotype of different strains, including copy number of specific genomic
segments, might be different. In any event, these oaCGH da- tas might provide clues for studies of neuroblastoma biology and neurotoxic effects. W e reported previously the chromo- somal aberrations in the SH-SY5Y [5], in which the genomic region including PNPLA6, i.e. NTE (19p13.3~19p13.2), showed a normal copy number. However, the PNPLA6 in N2a cells (8qA1.1, Chr8:3515425- 3544266) showed gain in DNA copy number in this study (Table 3). It is interesting to note that there are symptomatic differences of organo- phophate-induced neurotoxicity between neuroblastoma N2a cells and neuroblastoma SH-SY5Y cells [10]. This might be related to difference in DNA copy number of neuropathy target esterase (NTE) between two genomes because a phys- iological substrate of NTE is bound by organophosphates that cause a delayed neuropathy in humans and some animals. Pathophysiological and drug development studies with neuroblastoma N2a cells might require cautious eluci- dation and further study taking genome variations into consideration.
Acknowledgement
This paper was supported by Konkuk university in 2006.
References
1. Andersson, R., C. E. Bruder, A . Piotrowski, U . M enzel, H.
Nord, J. Sandgren, T. R. Hvidsten, T. Diaz de Ståhl, J. P.
Dumanski, and J. Kom orowski. 2008. A segmental max- imum a posteriori approach to genome-wide copy number profiling. Bioinformatics 24, 751-758.
2. Aoyama, M ., K. Asai, T. Shishicura, T. Kawamoto, T.
M iyachi, T. Yocoi, H. Togari, Y. M iura, T. Kato, and A . Nakagawara. 2000, There are different expressions of BDNF and its variants between human neuroblastoma with favor- able prognoses and with unfavorable prognoses. Soc.
Neurosci. Abstr. 26(Part 2), 2120.
3. Brodeur, G. M . , C. Azar, M . Brother, J. Hiemstra, B.
Kaufman, H. Marshall, J. Moley, A. Nakagawara, R. Saylors, N. Scavarda, S. Schneider, J. W asson, P. W hite, R.Seeger, T. Look, and R. Castleber. 1992. Neuroblastoma: Effect of genetic factors on biology and treatm ent. Cancer 70, 1685-1694.
4. Chao, M . V. 1992. Neurotrophin receptors: a window into neuronal differentiation. Neuron 9, 583-593.
5. Do, J. H. , I. S. Kim, T. K. Park, and D. K. Choi. 2007.
Genom e-wide examination of chromosomal aberrations in neuroblastom a SH-SY5Y cells by array-based com parative genom ic hybridization. Mol. Cells 24, 105-112.
6. Gauvain, J. L. and C. H. Lee. 1992. M AP estimation of con-
tinuous density HM M : theory and applications. In DARPA Sp. And Nat. Lang. Workshop. Harriman, New York.
7. Johnson, V. J., S. H. Kim, and R. P. Sharma. 2005.
Alum inum-m altolate induces apoptosis and necrosis in neuro-2a cells: potential role for p53 signaling. Toxicol. Sci.
83, 329-339.
8. Konger, P., G. Barbany, C. Dom inici, M . A . Castello, G.
Raschella, and H. Persson. 1993. Coexpression of messenger RNA for TRK protooncogene and low affinity nerve growth factor receptor in neuroblastoma with favorable prognosis.
Cancer Res. 53, 2044-2050.
9. Lepage, K. T., R. W . Dickey, W . H. Gerwick, E. L. Jester, and D. Murray. 2005. On the use of neuro-2a neuroblastoma cells versus intact neurons in primary culture for neuro- toxicity studies. Crit. Rev. Neurobiol. 17, 27-50.
10. Li, X. -H., D. X. D. -X. Long, W . Li, and Y. -J. W u. 2007.
Different m echanisms of lysophosphatidylcholine-induced Ca2+ mobilization in N2a mouse and SH-SY5Y human neu- roblastom a cells. Neurosci. Lett. 424, 22-26.
11. Nakagawara, A., M. Arima, C. G. Azar, N. J. Scavarda, and G. M . Brodeur. 1992. Inverse relationship between trk ex- pression and N-myc amplification in human neuroblastomas.
Cancer Res. 52, 1364-1368.
12. Nakagawara, A., C. G. Azar, N. J. Scavarda, and G. M . Brodeur. 1994. Expression and function of TRK-B and BNDF in human neuroblastomas. Mol. Cell Biol. 14, 759-767.
13. Sakaguchi, M ., K. M urayam a, K. Yabe, M . Satoh, M . Takeuchi, and E. M atsumura. 1998. Beta-casom orphin-5 stimulates neurite outgrowth in a mouse neuroblastoma cell line (Neuro-2a). Neurosci. Lett. 251, 97-100.
14. Snider, W . D. 1994. Functions of the neurotrophins during nervous system development: what the knockouts are teaching us. Cell 77, 627-638.
15. Tonini, G. P. 1993. Neuroblastoma: The result of multistep transformation? Stem Cells 11, 276-282.
16. van de W iel, M . A., K. I. Kim , S. J. Vosse, W . N. van W ieringen, S. M. W ilting, and B. Ylstra. 2007. CGHcall: call- ing aberrations for array CGH tumor profiles. Bioinformatics 23, 892-894.
17. Ylstra, B., P. van den Ijssel, B. Carvalho, R. H. Brakenhoff, and G. A. M eijer. 2006. BAC to the future! or oligonucleo- tides: a perspective for micro array comparative genomic hybridization (array CGH). Nucleic Acids Res. 34, 445-450.
18. Zhang, X., A. S. Vincent, B. Halliwell, and K. P. Wong. 2004.
A m echanism of sulfite neurotoxicity: direct inhibition of glutam ate dehydrogenase. J. Biol. Chem. 279, 43035-43045.
초록 고집적어레이 기반의 비교유전체보합법: (CGH)을 통한 신경아세포종 Neuro2a 세포의 유전체이상 분석
도진환김인수․ 1․고현명1․최동국1* 일본 동경대학 인간유전체센터
( , 1건국대학교 생명과학부 생명공학과)
신경아세포종은 미분화된 신경외배엽 세포로부터 유래한 신경능세포에 의해 형성된 소아기에 보는 가장 많이 발생하는 악성 종양 중 하나이다 신경아세포종인. Neuro-2a 세포는 신경세포의 분화 세포사 억제 효능 세포독성, , 검정 등에 활용되고 있다. Neuro-2a역시 다른 신경아세종과 같이 염색체 변이를 가지고 있지만 이에 대해 고밀도의, 게놈수준에서 염색체 변이에 대해 보고된 바가 없다 본 연구에서는 고집적 마이크로어레이 최소. ( 43,000개의 코딩,
코딩 유전자 서열이 집적된 마이크로어레이 기반의 비교유전체보합법을 활용하여 고해상도의 유전
non- ) , Neuro-2a
체 이상을 분석하였다 마이크로 어레이 데이터는. Hidden Markov Model을 활용하여 유전체 변이를, double loss,
그리고 으로 나누어 분석하였다 는 유전자의 증폭은
single loss, normal, single gain amplification . Neuro2a MYCN
관찰되지 않았고, GDNF, BDNF, NENF등의neurotrophic factor가운데NENF의gain 현상이 관찰 되었다 염색체. 의 이상은4,8,10,11,15번에서 발견되었으며 염색체, 3,17,18,19에서는 전부20개 미만의 염색체 이상이 발견되었다. 염색체 이상이 연속적으로 일어난 부위 중gain으로서 가장 긴 부분은Chr8:8,427,841-35,162,415의 약26.7 Mb이며,
로서 가장 긴 곳은 의 약 였다 염색체의 위치는 데이터베이스
single loss Chr4:73,265,785-88,374,165 15.1 Mb . UCSC
에 근거하였다 (UCSC mm8, NCBI Build 36) .