Gender Comparison of Ratings of Perceived Exertion (RPE) as a Predictor of Exercise Intensity in College Students
Do-Yeon Kim
1and Jeong-Ah Lee
2*
1
Department of Physical Education, Pusan National University, Busan 609-735, Korea
2
Department of Physical Education, Kyung-Sung University, Busan 608-736, Korea
Received August 31, 2010 /Accepted October 5, 2010Perceived exertion involves detection and interpretation of sensations arising from the body during physical exercise. Physiological variables such as heart rate and oxygen consumption positively correlate with ratings of perceived exertion (RPE). It is unknown whether the accuracy of predicting exercise intensity from RPE differs between men and women. Therefore, it was examined whether men or wom- en could predict relative exercise intensity, determined by oxygen consumption, more accurately from RPE. Ten male and ten female young adult subjects aged 25.1±3.52 yr volunteered to participate. RPE were determined by the Borg 15-category scale, and a standard Bruce treadmill protocol was used to perform graded exercise testing. There was no significant difference in slope means between males and females (p=0.501). No significant difference was observed when plotting rates of perceived exertion (RPE) vs. percentage of VO
2max. The relative maximal oxygen consumptions (VO
2max, rel) were 52.36±7.35 ml/kg/min for males and 41.44±6.71 ml/kg/min for females, respectively and there was a significantly high difference between the two groups in the relative VO
2max, as well as figures of 4.05±0.36 l/min for males and 2.53±0.39 l/min for females in the absolute VO
2maxin this study. There were no significant differences in slope, y-intercept, and standard error of estimate (SEE) between males and females. No significant difference with RPE according to exercise intensity was found between males and females. However, RPE was a useful predictor of exercise intensity in independent genders.
Key words : Ratings of perceived exertion (RPE), energy expenditure, oxygen consumption, graded exercise test, HR
*Corresponding author
*Tel:+82-51-663-4956, Fax:+82-51-663-4959
*E-mail : [email protected]
Introduction
In addition to oxygen consumption, heart rate, and blood lactate as indicators of exercise intensity, one also can use the rating of perceived exertion (RPE) [26]. RPE is the most common method used for monitoring individuals for both graded exercise testing (GXT) and prescribing and regulat- ing exercise training intensity. Perceived exertion has been defined as the act of detecting and interpreting sensations arising from the body during physical exercise [10]. To help quantify these sensations, Gunnar Borg [3] proposed a scale consisting of numbers from 6 to 20 with descriptive words printed by every other number, ranging from “very, very light” at 7 to “very, very hard” at 19 [25]. In developing the RPE scale, Borg considered each number increase in RPE to correspond to 10 bts/min increase in heart rate. The sub- jective rating of the intensity of exertion, as perceived by an exercising person, has been shown to be a good indicator
of the physiological work being done [25]. Exercise levels corresponding to higher levels of energy expenditure and physiologic strain produce higher RPE ratings. RPE of 13 or 14 coincides with about 70% HRmax during cycle ergo- meter and treadmill exercise; an RPE between 11 and 12 cor- responds to exercise at the lactate threshold for trained and untrained individuals [27].
RPE scales have been used as a reliable and valid measure- ment of exercise intensity [3,4,10,11,14,20]. Research has shown that RPE provides a simple and physiologically valid method of regulating exercise intensity [10,11]. The wide- spread use of RPE is most likely based on the premise that the physiological relationship is reliable and valid across vari- ous physiological (oxygen uptake, heart rate, and physical rate) markers of exercise testing and training conditions [2,7,24,30]. It is known that RPE is linearly related to the in- crease in exercise intensity based on physiological variables such as heart rate and oxygen consumption [10,20].
Furthermore, research suggests that the session RPE is a valid
method of assessing effort sense associated with a completed
bout of aerobic and resistance exercise in both general and
athletic populations [8,16,17]. These findings suggest that RPE
is useful, subjective measure of predicting exercise intensity.
Previous researchers have compared RPE between male and female participants using experimental paradigms that explained the physiological reference criterion in absolute (oxygen uptake, heart rate) [6,18,19,31] and relative (%VO
2max/peak, %HRmax/peak) units [6,18,19,29]. The ex- perimental paradigms employed in the investigations cited above generally compared RPE between male and female subjects at a predetermined physiological reference criteria [25]. These experimental paradigms involved dynamic ex- ercise modalities requiring relative metabolic rates ranging between 25% and 90% of mode detail maximal/peak values for oxygen uptake and heart rate. In exercise prescription, the target exercise intensity is determined using information from a prior GXT that yields a direct relationship between exercise intensity and responses of selected physiological variables that can be monitored during exercise.
Treadmill running has significantly higher oxygen con- sumption and energy expenditure than other kinds of ex- ercise such as stepping, cycling, and rowing [18]. Therefore, treadmill exercise would be the good choice to measure car- diorespiratory endurance and expenditure. RPE, HR, and VO
2maxwere selected as the cardiovascular and aerobic refer- ence criteria because these variables: a) provide metabolic and circulatory function involving exercise and b) are com- monly used in experimental paradigms where physiological measures are employed as reference criteria [23].
Research has been unable to establish whether the accu- racy of predicting exercise intensity with RPE significantly differs between men and women during cycling, ergometry, and swimming. Gender differences in RPE have been incon- sistent for weight-bearing exercise such as treadmill walking and running [18,21]. Therefore, the primary aim of this study was to establish the validity of using RPE to rate exercise intensity (% oxygen consumption) independent of gender.
This study is necessary to evaluate cardiovascular and meta- bolic responses of male and female and to see the difference between them. Based on current research [18,21], it was hy- pothesized that there will be no significant difference in gen- der reported RPE with exercise intensity determined by oxy- gen consumption.
Materials and Methods Subjects
Subjects consisted of 20 male and female volunteers of
college age students (25.1±3.52 yr) from the Exercise Science undergraduate and graduate programs. All participants were asymptomatic of illness or disease and free from any acute or chronic injury, as established by the ACSM partic- ipant activity readiness Par-Q health questionnaire and an informed consent before participating. All subjects were healthy nonsmokers used no medications and were light to moderate recreational exercisers. Descriptive data were col- lected at the initial laboratory session including age, weight, and height. Body fat percentage was assessed using Lange calipers (Cambridge, Mass.) and a 3-skinfold site method (men: chest, abdomen, thigh; women: tricep, suprailiac, thigh) [22].
Measurements and GXT
Perceived exertion was analyzed using the Borg Rating of Perceived Exertion (RPE) scale [3]. Prior to the each ex- ercise test, participants read a standard set of perceptual scaling instructions. The RPE scale was in full view of each participant during the exercise test. These instructions fol- lowed an established format used in previous investigations.
The RPE scale consists of a 15-point rating scale ranging from 6 to 20, with 6 being the least exertion and 20 being the most exertion.
Expired gases were analyzed using a ParvoMedics Truemax 2400 metabolic measuring system (Sandy, UT). The Truemax 2400 analyzed expired air to determine oxygen consumption (VO
2), carbon dioxide production (VCO
2), ven- tilation (V
E), and respiratory exchange ratio (R). Updates of these measures were provided every 20 s. Heart rate was monitored throughout exercise using a wireless chest strap telemetry system (Polar Electro T31, Kempele, Finland). The VO
2peak test consisted of a graded exercise test on a tread- mill utilizing the protocol developed by Bruce [5]. The Bruce protocol is a maximal exercise test where the athlete works to complete exhaustion as the treadmill speed and incline is increased every three minutes until test termination.
Prediction equations for this protocol have been developed
to estimate the VO
2max of active and sedentary women and
men, cardiac patients, and elderly individuals. The length
of time on the treadmill is the test score and can be used
to estimate the VO
2max value. During the test, HR, BP, and
RPE are often also collected. The Bruce Protocol was chosen
because it allows participants to walk for the initial stages,
thus eliminating possible local fatigue problems observed in
individuals with a low fitness level.
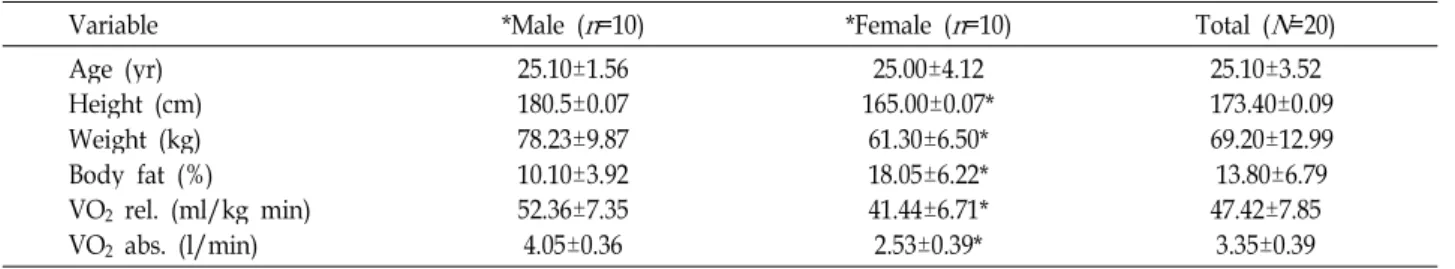
Table 1. Descriptive characteristics of the study participants
Variable *Male (
n
=10) *Female (n
=10) Total (N
=20)Age (yr) Height (cm) Weight (kg) Body fat (%) VO2 rel. (ml/kg min) VO2 abs. (l/min)
25.10±1.56 180.5±0.07 78.23±9.87 10.10±3.92 52.36±7.35 4.05±0.36
25.00±4.12 165.00±0.07*
61.30±6.50*
18.05±6.22*
41.44±6.71*
2.53±0.39*
25.10±3.52 173.40±0.09 69.20±12.99 13.80±6.79 47.42±7.85
3.35±0.39 Values are means±
SD
.*
p
<0.05 for male and female differences.VO2 rel, relative VO2max, VO2 abs, absolute VO2max
Table 2. Data from regression line for study subjects
Variable Male (
n
=10) Female (n
=10)p
-valueSlope (%RPE) Y-intercept (%) SEE
0.067±0.01 -0.067±0.14 0.051±0.01
0.064±0.01 -0.166±0.22 0.056±0.02
0.501 0.241 0.510 Values are means±
SD
. SEE: standard error of estimateProcedures
The nature, purpose, and experimental procedures were outlined verbally to each participant, and each subject signed an informed consent before participating in the study. The subjects were tested on one occasion, consisting of a VO
2peak test. Each subject was educated on the RPE scale before the exercise session to ensure participant under- standing of the scale.
Following the introduction, the subjects participated in a graded exercise test to measure VO
2peak. As outlined in the Bruce Protocol, subjects started exercise at a low speed and
% grade.
Every three minutes the speed and % grade were increased. This protocol continued until the subject stopped the test. VO
2peak was assumed if the subject reached 85 % HRmax. During the test, RPE was recorded at the end of each minute. The subjects pointed at the number corre- sponding to their perceived exertion on the RPE scale that was held by the research assistants. The research assistants repeated the number, and the subject confirmed that the number was correct.
Data analysis
SPSS (14.0) was used to analyze the statistics. Descriptive statistics were used to present the demographic character- istics (age, weight, height, relative VO
2peak, absolute VO
2peak, and % body fat) of the study participants.
Predicted VO
2from RPE was analyzed using a simple re-
gression for every subject at each minute of exercise. Slope, y-intercept, and standard error of estimate (SEE) were re- corded for each subject. In order to determine differences between men and women, independent t-test were used with the average slope, y-intercept, and SEE for men and women.
Results
A complete description of demographic characteristics of the study participants can be found in Table 1. Twenty col- lege-aged individuals were sampled, 10 male and 10 female.
The mean ages of the subjects were 25.1±1.56 yr for males and 25.0±4.12 yr for females (p=0.944). The mean weight of the male subjects were 78.23±9.87 kg while the mean weight for the females were 61.3±6.50 kg (p=0.001). The males had an average height of 1.805±0.07 m and the females had an average height of 1.65±0.07 m (p=0.001). The relative, max- imum ventilatory response of the subjects was 52.36±7.35 ml/kg·min for the males and 41.44±6.71 ml/kg·min for fe- males (p=0.003). The absolute, maximum ventilatory re- sponses per subject were 4.05±0.36 l/min for the males ver- sus 2.53±0.39 l/min for the females.
The means for slope, y-intercept, and standard error of
estimate (SEE) for males and females are shown in Table
2. There was no significant difference in slope means for
males and females (p=0.501). No significant difference was
found between the standard error of estimate means for
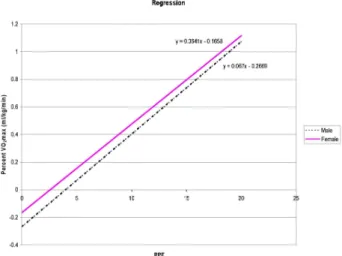
Fig. 1. Regression lines for male and female data.
males and females (p=0.510). There was also no significant difference in the means for y-intercept (p=0.241).
Fig. 1 shows the regression lines for males and females.
No significant difference is observed when plotting rating of perceived exertion (RPE) vs. percentage of VO
2max.
P-values for data in Fig. 1 are shown in Table 2.
Discussion
The primary aim of this study was to establish the validity of using RPE to rate exercise intensity (% oxygen con- sumption) independent of gender. This study is necessary to evaluate cardiovascular and metabolic responses of male and female and to see the difference between them. I there- fore examined whether men or women could predict relative exercise intensity, determined by oxygen consumption, more accurately from RPE. Based on the findings of this study, I concluded that there is no significant difference in gender reported RPE with exercise intensity determined by oxygen consumption (Table 2). These findings are supported by oth- er reports concerning RPE as a predictor of exercise intensity measured in absolute and relative VO
2[9,21]. Robertson et al. [25] found no difference between male and female sub- jects when compared at three mode specific relative criteria (i.e. % VO
2peak). The three modes were treadmill, simulated ski, and cycle exercise. Male and female have been shown to be both similar and dissimilar in RPE during cycling, er- gometry, and swimming. Gender differences in RPE have and have not been observed for weight-bearing exercise such as treadmill walking and running [25]. The subject demo- graphics (VO
2peak, age, and sample size) were similar be-
tween Robertson et al. [25] study and this study. For males and females, HR was similar during treadmill running.
Compared with females, males had significantly greater VO
2and energy expenditure, while females had higher HR.
However, there was no significant difference in the rate of increase for VO
2between genders. RPE were not different from males and females [18,25].
This study differed because I used at graded exercise test in order to get more data points, so I am able to examine to entire spectrum or exercise intensities. This study ex- tended these results by reporting RPE in one minute incre- ments as opposed to only 3 specific intensities (70, 80, 90
% relative VO
2peak) [21]. By reporting RPE at one-minute increments, I gained more data points. Thus, this study as- sessment of prediction accuracy is more complete. Another study with similar demographics focused on trained and un- trained men and women and treadmill exercise. RPE was taken at 4 data points (50, 60, 70, 80 % relative VO
2peak) [7]. Demello et al. [7] reported no significant gender or train- ing-related differences between RPE and 50, 60, 70, 80 % VO
2peak. Thus, the current study’s data is in agreement with other studies [7,21], in that, RPE predicts relative exercise intensity similarly in men and women. Recent research by Eston and colleagues [12,13,15] have reported that there were no statistically significant differences between meas- ured VO
2max and VO
2max predicted from the submaximal, perceptually regulated exercise test in each of these afore- mentioned studies, regardless of gender and fitness.
Other articles here reported gender differences at absolute workloads as expressed in % of VO
2peak [25]. Robertson et al. [25] also reported gender differences at absolute VO
2max/peak based on maximal aerobic power. Men ach- ieved higher VO
2max/peak than women at given absolute workloads. Whereas women achieved a larger relative aero- bic metabolic rate than men at the same given submaximal absolute workloads. Therefore, gender differences result when compared at absolute VO
2due to the greater relative aerobic metabolic strain for women than men.
The ACSM guideline recommends that individuals ex-
ercise at 40 or 50 % to 85 % of VO
2max [1]. Not all in-
dividuals have access to the necessary equipment to measure
oxygen consumption or even HR, so RPE can be a useful
tool for estimating exercise intensity. With practice an in-
dividual can learn to associate RPE with a specific target
exercise HR, especially at higher exercise intensities. Thus,
the RPE can be used instead of HR, or in combination with
HR, to monitor training intensity and to adjust the exercise prescription for conditioning effects.
In conclusion, previous research examining RPE differ- ences between male and female and comparing overall and differentiated RPE between treadmill and cycling exercise has been equivocal and in the latter case also limited. Results of this study show no gender differences in RPE with ex- ercise intensity determined by oxygen consumption. One main concern could be that the RPE scale may not be accu- rate for predicting exercise intensity when compared to men and women. The findings of this study suggest that RPE is a useful predictor of exercise intensity in independent of gender.
References
1. American College of Sports Medicine. 1998.
ACSM’s Resource Manual for Guidelines for exercise testing and prescription.
3rdEds, Williams & Wilkins, Baltimore, MD.2. American College of Sports Medicine. 2008.
ACSM’s guide- lines for exercise testing and prescription
. Lippincott Williams& Wilkins, Philadelphia, PA.
3. Borg, G. 1998.
Borg’s perceived exertion and pain scales
. Human Kinetics, Champaign.4. Borg, G. and H. Linderholm. 1970. Exercise performance and perceived exertion in patients with coronary in- sufficiency, arterial hypertension and vasoregulatory asthenia.
Acta. Med. Scand
187, 17-26.5. Bruce, R. A. 1971. Exercise testing of patients with coronary artery disease.
Ann. Clin. Res.
3, 323-332.6. Butts, N. K. and D. Crowell. 1985. Effect of caffeine ingestion on cardiorespiratory endurance in men and Women.
Res.
Q Exerc. Sport
56, 301-305.7. Danielle, M. L., J. A. Faulkner, A. V. Rowlands, and R. G.
Eston. 2009. Prediction of maximal oxygen uptake from sub- maximal ratings of perceived exertion and heart rate during a continuous exercise test: the efficacy of RPE 13.
Eur. J.
Appl. Physiol.
107, 1-9.8. Day, M. L., M. R. McGuigan, G. Brice, and C. Foster. 2004.
Monitoring exercise intensity during resistance training us- ing the session RPE scale.
J. Strength Cond. Res.
18, 353-358.9. Demello, J. J., K. J. Cureton, R. E. Boineau, and M. M. Singh.
1987. Ratings of perceived exertion at the lactate threshold in trained and untrained men and women.
Med. Sci. Sports Exerc.
19, 354-362.10. Doherty, M., P. M. Smith, M. G. Hughes, and D. Collins.
2001. Rating of perceived exertion during high-intensity treadmill running.
Med. Sci. Sports Exerc.
33, 1953-1958 11. Dunbar, C. C., R. J. Robertson, R. Baun, M. F. Blandi, K.Metz, R. Burdet, and F. L. Goss. 1992. The validity of regu- lating exercise intensity by ratings of perceived exertion.
Med. Sci. Sports Exerc.
24, 94-99.12. Easton, R. G., K. L. Lamb, G. Parfitt, and N. King. 2005.
The validity of predicting maximal oxygen uptake from a perceptually-regulated graded exercise test.
Eur. J. Appl.
Physiol.
94, 221-227.13. Easton, R., D. Lambrick, K. Sheppard, and G. Parfitt. 2008.
Prediction of maximal oxygen uptake in sedentary males from a perceptually-regulated, sub-maximal graded exercise test.
J. Sports Sci.
26, 131-139.14. Easton, R. G., and J. G. Williams. 1988. Reliability of ratings of perceived effort regulation of exercise intensity.
Br. J.
Sports Med.
22, 153-155.15. Faulkner, J. A., G. Parfitt, and R. G. Eston. 2007. Prediction of maximal oxygen uptake from the ratings of perceived exertion and heart rate during a perceptually-regulated sub-maximal exercise test in active and sedentary participants.
Eur. J. Appl. Physiol.
101, 397-407.16. Foster, C., J. A. Florhaug, J. Franklin, L. Gottschall, L. A.
Hrovatin, S. Parker, P. Doleshal, and C. Dodge. 2001. A new approach to monitoring exercise testing.
J. Strength Cond.
Res.
15, 109-115.17. Green, J. M., Z. Yang, C. M. Laurent, J. K. Davis, K. Kerr, R. C. Pritchett, and P. A. Bishop. 2007. Session RPE follow- ing interval and constant-resistance cycling in hot and cool environments.
Med. Sci. Sports Exerc.
39, 2051-2057.18. Kravitz, L., R. A. Robergs, V. H. Hayward, D. R. Wagner, and K. Powers. 1997. Exercise mode and gender compar- isons of energy expenditure at self-selected intensities.
Med.
Sci. Sports Exerc.
29, 1028-1035.19. Noble, B. J., C. M. Maresh, and M. Ritchey. 1981.
Comparison of exercise sensations between females and males.
Med. Sport
14, 175-179.20. Noble, B. J., G. A. Borg, I. Jacobs, R. Ceci, and P. Kaiser.
1983. A category-ratio perceived exertion scale: relationship to blood and muscle lactates and heart rate.
Med. Sci. Sports Exerc.
15, 523-528.21. Noble, B. J. and R. J. Robertson. 1996.
Perceived Exertion
. Champaign, IL: Human Kinetics, pp. 77-82.22. Pollock, M. L., D. H. Schmidt, and A. S. Jackson. 1980.
Measurement of cardiorespiratory fitness and body compo- sition in the clinical setting.
Clin. Ther.
6, 12-27.23. Robergs, R. A. and S. O. Roberts. 1997.
Exercise Physiology:
Exercise, performance, and clinical applications
. St. Louis, MO:Mosby-Year Book, Inc.
24. Robertson, R. J., F. L. Goss, T. E. Auble, D. A. Cassinelli, R. J. Spina, E. L. Glickman, R. W. Galbreath, R. M.
Silberman, and K. F. Metz. 1990. Cross-modal exercise pre- scription at absolute and relative oxygen uptake using per- ceived exertion.
Med. Sci. Sports Exerc.
22, 653-659.25. Robertson, R. J., N. M. Monya, K. L. Sward, N. B. Millich, F. L. Goss, and P. D. Thompson. 2000. Gender comparison of RPE at absolute and reflective physiological criteria.
Med.
Sci. Sports Exerc.
32, 2120-2129.26. Robertson, R. J. and B. J. Noble. 1997. Perception of physical exertion: methods, mediators, and applications.
Exerc. Sport
Sci. Rev.
25, 407-452.초록:RPE에 의한 운동강도 예측인자의 남녀 대학생 비교 김도연
1․이정아
2*
(
1부산대학교 체육교육학과,
2경성대학교 체육학과)
심박수(heart rate) 및 산소 소비량(oxygen consumption) 등의 생리학적 변수는 운동자각도(RPE)와 밀접한 관련이 있으며, RPE의 남녀차이에 의한 예측 운동강도의 정확성은 아직 밝혀지지 않고 있고, 본 연구는 남녀 대학생의 심장 혈관 및 신진대사의 반응을 평가하고 남녀의 차이를 밝히는 데 있다. 남자대학생(25.1±1.56 yr)과 여자대학생(25.0±4.12 yr) 각각 10명이 본 연구에 자발적으로 참여를 하였고, 본 연구를 위하여 설정된RPE는 Borg의 15 범주에서 결정을 하였 으며, 점증적 운동부하(graded exercise testing)는 Bruce Treadmill Protocol을 이용하였다. 남녀의 평균 slope (p=0.501) 와 RPE의 plotting rates와 최대산소섭취율(% VO
2max)은 유의한 차이가 나타나지 않았다. 각자의 상대적 최대산소섭취 량은 남학생의 경우52.36±7.35 ml/kg/min, 여학생은 41.44±6.71 ml/kg/min로 나타나 두 그룹간에 유의하게 큰 차이가 있었으며, 절대적 최대산소섭취량은 남학생은 4.05±0.36 l/min, 여학생은 2.53±0.39 l/min로 나타나 두 그룹간에 큰 차 이가 나타냈다. 남학생과 여학생간의 slope, y-intercept, SEE는 통계적으로 유의한 차이는 없었다. 본 연구에서 운동강 도에 따른 남학생과 여학생의 RPE 의 차이는 유의하게 나타나지 않았다. 이상의 결과로 보아 RPE는 운동중 산소섭취량 에 대한 운동강도의 예측에 남녀별 차이가 없어 유효한 예측인자라고 사료된다.
27. Seip, R. L., D. Snead, E. F. Pierce, P. Stein, and A. Weltman.
1991. Perceptual responses and blood lactate concentration:
effect of training state.
Med. Sci. Sports Exerc.
23, 80-87.28. Skinner, J. S., R. Hutsler, V. Bergsteinova, and E. R. Buskirk.
1973. The validity and reliability of a rating scale of per- ceived exertion.
Med. Sci. Sports Exerc.
5, 94-96.29. Ueda, T. and J. Kurokawa. 1995. Relationships between per- ceived exertion and physiological variable during
swimming.
Int. J. Sports Med.
16, 385-389.30. Whaley, M. H., W. M. Thomas, L. A. Kaminsky, and J. D.
Emmett. 1997. Reliability of perceived exertion during grad- ed exercise testing in apparently healthy adults.
J.
Cardiopulm. Rehabil.
17, 37-42.31. Winborn, M. D., A. W. Meyers, and C. Mulling. 1988. The effects of gender and experience on perceived exertion.