2009년도 춘계 학술발표회 논문집 대한방사선방어학회
152 _http://www.karp.or.kr
Evaluation of Gamma Ray Spectrum and Its Efficiency for a HPGe Detector Using Monte Carlo Method
Seung Chan Lee*․Sang Yeol Kim
Nuclear Engineering & Technology Institute, NETEC Korea Hydro and Nuclear Power Co. LTD, KHNP
*E-mail: [email protected]
Key words : Radioactivity, Monte Carlo, Mass attenuation coefficient, HPGe detector
Introduction
The purpose of this study is to evaluate the efficiency and the gamma ray spectrum of a High Purity Ge (HPGe) detector through calculation of the radioactivity of a gamma reference source using the Monte Carlo (MC) method. For the detection of low-level radioactivity, the HPGe detector is generally used. However, with the use of gamma spectroscopy, the detection time of more than 24 hours is required for the determination of radioactivity.
This detection time can be reduced if prediction of the efficiency and the gamma ray spectrum for the detector is possible. In this work, in order to reduce the detection time, the MC method to evaluate the efficiency and the gamma ray spectrum for the HPGe detector is proposed.
Modeling Method
In this calculation, the total attenuation coefficients of gamma rays are used by tracking the pathways of the gamma rays absorbed in the detector[1, 2]. The algorithm for tracking the pathways is implemented by the MC method.
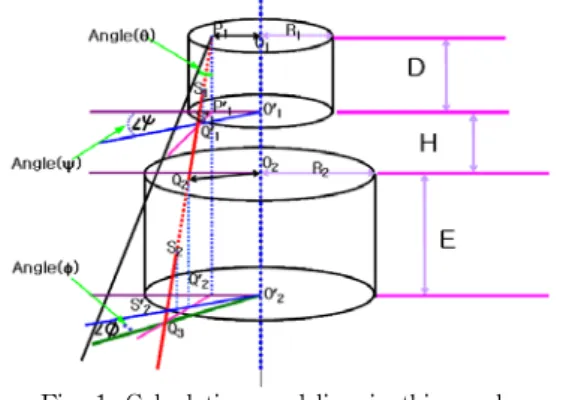
Fig. 1. Calculation modeling in this work
Table 1. Geometry of the source material and the HPGe detector( Fig. 1)
Detector Source material
Diameter(R2) 46.7mm Diameter(R1) 30.0mm
Depth(E) 46.8mm Depth(D) 10.0mm
Distance(H) : 3 mm (Distance between detector and source material
It is assumed that the gamma ray source has the shape of a small cylinder in the upper front plane of the HPGe detector as shown in Fig. 1.
Also, a larger cylinder is modeled as the detector in Fig.
1. This geometric structure is used for the MC calculation
tracking pathways l1(P1S1) and l2(Q2S2). The main idea here is that the initial gamma ray crossing the pathway l1
of the source material(reference source) and the pathway l2 of the detector material(HPGe detector) is attenuated depending on the total attenuation coefficients of pathway l1 and pathway l2.
These relations of attenuation are illustrated by the interaction probability between gamma rays and the materials.
In Fig. 1, the interaction probability of the gamma ray generated from P1 after crossing pathway l1=P1S1 in a source material with a radius (R1) in centimeters, a depth (D) in centimeters, and a density (ρ1) in g․cm-3 is given by equation (1).
( 1 ) where u1 is the total attenuation coefficient of the source material.
The probability after crossing pathway l2 = Q2S2 in the cylinder-type HPGe detector with a radius (R2) in centimeters, a depth (E) in centimeters, and a density (ρ2) in g․cm-3 is given by equation (2).
( 2 ) where u2 is the total attenuation coefficient of the HPGe detector.
From equation (1) and equation (2), the efficiency for a gamma ray is expressed as follows:
( 3 ) where N is the number of MC calculations.
Pathways l1 and l2 are calculated under the following conditions of case 1 and case 2 using the random parameters of d, r1, θ and ψ.
Where random parameters are expressed by given equation (4).
d = Dη (0≤η<1), r1 = R1ξ (0≤ξ<1),
θ= 2πκ (0≤κ<1), and ψ = 2πγ (0≤γ<1) ( 4 ) Case 1 : pathway l1(P1S1)
If R1 ≥ the length O1'Q1, l1 = d/cos(θ).
If R1 ≤ the length O1'Q1, l1 = l(r,θ,ψ).
where O1'Q1 and l(r,θ,ψ) are calculated by followings:
(O1'Q1)2 = (r1)2 + d2 tan2(θ)
+ 2r1 d tan(θ) cos(ψ) ( 5 )
θ ψ ψ ψ
θ ( 6 ) Case 2 : pathway l2(Q2S2)
If the length O2Q2 < R2 and O2'Q3 ≤R2, l2=E/cos(θ).
If the length O2Q2 < R2 and O2'Q3 >R2, l2=X.
where O2Q2, O2'Q3, and X are calculated as follows:
2009년도 춘계 학술발표회 논문집 대한방사선방어학회
대한방사선방어학회_153
(O2Q2)2 = (r1)2 + (d+H)2 tan2(θ)
+ 2r1 (d+H) tan(θ) cos(ψ) ( 7 ) (O2'Q3)2 = (r1)2 + (d+H+E)2 tan2(θ)
+ 2r1 (d+H+E) tan(θ) cos(ψ) ( 8 )
φ φ
θ ( 9 ) To carry out the MC calculation of the spectrum, Helmer's method is selected in this work[3].
The main concept of Helmer's method is based on the relation between the half peak width of the spectrum and its energy. The relation is generally expressed by equation (10).
Half peak width = 1.552 ( 10 ) where E = ΔE․ X (ΔE: energy difference between each channels, X : channel number).
With the use of the half peak width, the peak shape is expressed by equation(11).
F(E) = exp[-(ΔEX - E0)2/k] ( 11 ) where
ΔE : energy difference between each channels X : channel number
E0 : the centroid of energy peak k = 0.6591
Equation (11) which shows the spectrum shape and the Gaussian distribution is dependent on the energy.
Herein, the range of the peak is calculated as followings:
Range = ending point of the peak(F(E')=0)
- starting point of the peak(F(E)=0) ( 12 ) To simulate the spectrum using equation (11) and equation (12), the parameter of energy is given by random numbers as follows:
if ε > 0.5, E = E0 + Λ1․(Range / 2), and
if ε ≤ 0.5, E = E0 - Λ2․(Range / 2) ( 13 ) where ε, Λ1, and Λ2 are random numbers ranging from 0 to 1.
From equations(10) ~ (13), the spectrum simulation is carried out as follows:
Spectrum = efficiencym ․F(Em)․Cm ( 14 ) where Cm is the radioactivity counts of the m-th gamma energy(Em) and efficiencym is the efficiency of the m-th gamma energy (Em) which is derived from equation (3).
The radioactivity counts (Cm) of equation (14) are calculated under the condition of the case 2 of equation (7) ~ equation(9). In the calculation of the radioactivity counts (Cm), case 1 is used for the limit condition of the gamma ray positions.
Finally, using equation (1) ~ equation (14), the MC calculation results are compared with experimental results in terms of efficiency, spectrum, and the detection time. In particular, reduced detection time is achieved by generating a set of random numbers, which consists of 1000 random numbers. Here, for each MC calculation run, 1000 runs are carried out with the set of random numbers.
Nevertheless, the MC calculation results are precisely
compared with the experimental results in the following section.
Results and Discussion
The efficiency and the gamma ray spectrum of the present simulation results using the MC method are compared with experimental results using the gamma reference source.
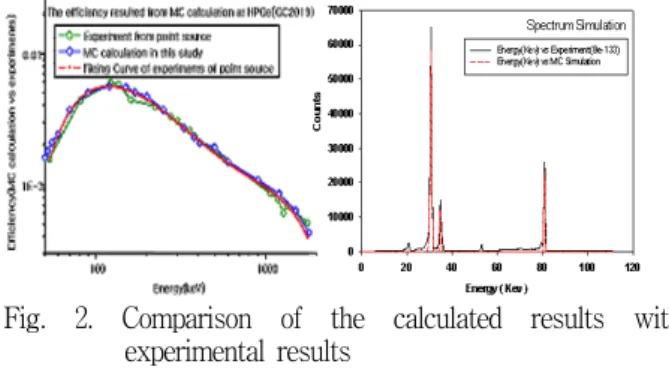
Fig. 2. Comparison of the calculated results with experimental results
( Left : efficiency ; Right : spectrum shape )
The simulation results show good agreement with the experimental results within a error of 1.5% as shown in Fig 2. The energy channel and the radioactivity count of the MC calculations also agree well with the spectrum of the reference source in a error range of 0.3% ~ 1.2% as shown in Fig. 2 and Table 2. Table 2 shows that the MC calculations at 3000 sec are similar to the detected results at 83600 sec for Ba-133 material. These results demonstrate that the MC method can predict the gamma spectrum and the efficiency within a short time of 3000 sec.
Table 2. Comparison of the detection time and the energy peak(the right side of Fig. 2)
Ba-133 (keV)
Detection time
(sec) Energy peak
(channel ; counts) Experiments MC
method Experiments MC method 31 86300 3000 249 ; 59032 247 ; 58320 35 86300 3000 283 ; 15027 281 ; 14979 81 86300 3000 654 ; 26055 649 ; 25795
Conclusion
The efficiency and the spectrum of the HPGe detector are evaluated by the MC method. The present simulation results are in good agreement with the experimental data of the gamma reference source in the range of 0.3% ~1.5%. The detection time for low-level radioactivity is expected to be reduced if this method is applied to predict the efficiency and the spectrum of HPGe detector.
Reference
1. Ziegler, J.F. "The Stopping and Range of Ions in Solid", 1985, Pergamon Press.
2. IAEA Xu-Software, "Tables of gamm ray and X-ray mass attenuation coeffients and mass energy- absorption coefficients", 1999.
3. Helmer, R.G. and Lee, M.A., Nucl. Instr. and Meth. 178, 1990.