大韓獸醫學會誌 (2013) 第 53 卷 第 1 號 Korean J Vet Res(2013) 53(1) : 7~10
7
<원례보저>
Application of varimax rotated principal component analysis in quantifying some zoometrical traits of a relict cow
PM Parés-Casanova*, I Sinfreu, D Villalba
Department of Animal Production, Universitat de Lleida, 25198 Lleida, Spain (Received: December 7, 2011; Revised: November 13, 2012; Accepted: December 10, 2012)
Abstract : A study was conducted to determine the interdependence among the conformation traits of 28 “Pallaresa”
cows using principal component analysis. Originally 21 body linear measurements were obtained, from which eight traits are subsequently eliminated. From the principal components analysis, with raw varimax rotation of the transformation matrix, two principal components were extracted, which accounted for 65.8% of the total variance. The first principal component alone explained 51.6% of the variation, and tended to describe general size, while the second principal component had its loadings for back-sternal diameter. The two extracted principal components, which are traits related to dorsal heights and back-sternal diameter, could be considered in selection programs.
Keywords : Blanca del Pallars, correlation, morphometry, multivariate analysis, Pallaresa
Introduction
Body size and conformation are important traits in meat animals [13] and phenotypic information becomes impera- tive [1]. Analysis of variance and product moment correla- tions are widely used to characterize phenotypic and genetic relationships among traits in a breeding program [14]. How- ever, principal component analysis is a more refined tech- nique for analyzing data on linear body measurements and performances [6, 7]. Principal components are linear combi- nations of the original traits and are estimated in such a way that the first principal component can explain the largest per- centage of the total phenotypic variance. This paves way for the explanation and identification of trait groups, which can allow a quantitative measure for animal conformation with fewer parameters. The resulting principal components or loading may decrease the dimension of the explanatory vari- ables.
The “Pallaresa” or “Blanca del Pallars” breed is a native population of beef cattle found in the western regions of the Catalan Pyrenees (Catalonia, NE Spain). For a long time, these animals were raised to take advantage of their three aptitudes: work, meat and milk. Since the second half of the last century, population size decreased dramatically in favor of the “Bruna dels Pirineus” breed [4] which belongs to the Brown Alpine group.
At the present time (2011), the “Pallaresa” is on the brink of extinction, as only 49 breeding animals remain (2 bulls, 36 cows and 11 veals). The four remaining herds represent the
last vestiges of the breed which can be considered as a typi- cal example of a breed in “relic state” in Catalonia while
“Bruna dels Pirineus” is widely extended in the area. Its importance as genetic and cultural heritage and its contribu- tion in maintaining the landscape and ecosystem, as well as its unquestionable interest as a tourist attraction, make it an irreplaceable element in this area [4]. In 2001 an official recovery program was initiated.
The present investigation explores the relationships among body dimensions in the “Pallaresa” breed using Principal Component Analysis (PCA) with the view of reducing the number of body measurements required in ranking programs and also to explain the body conformation.
Materials and Methods
Twenty-eight extensively managed “Pallaresa” cows from three different farms were measured. Originally 21 metric traits were obtained on each animal following standard pro- cedure and anatomical reference points described elsewhere [3]. The body linear measurements consisted of withers height (WH), back height (BH), rump height (RH), chest height (CH), back-sternal diameter (DL), body length (BL), thorax width (TW), shoulder width (SW), thorax girth (TG), rump width (RW), rump length (RL), cannon perimeter (CP), horn perimeter (HP), outer horn length (HoL), head length (HL) and width (HW), skull length (SkL) and width (SkW), face length (FL) and width (FW), and head depth (HD). Only adult specimens (> 24 months) were included in this study,
*Corresponding author
Tel: +34-973-70-64-60, Fax: +34-973-70-28-74 E-mail: [email protected]
8
PM Parés-Casanova, I Sinfreu, D Villalbabecause the developing skeleton undergoes large changes in size and proportions during growth. Birth data was known for all animals from official individual documentation. Mor- phological measurements were done with a zoometric stick, a compass and a tape measure. All measurements were recorded once and by the same person (Ignasi Sinfreu, tech- nician of the official breeding association) to avoid between- recorder effects. No specimens had missing measurements.
Ethical approval was not necessary as animals were mini- mally manipulated. Main statistical values of each measure- ment were computed. The correlation coefficients and the variance-covariance values were also determined. From the variance-covariance matrix, data for the PCA with two com- ponents were generated. Kaiser-Meyer-Olkin (KMO) test of sampling adequacy and Bartlett’s test of sphericity were computed to establish the validity of the data set (KMO’s measure determines whether the common factor model is appropriate. The KMO should be greater than 0.5 for a satis- factory factor analysis to proceed; for Bartlett’s test, if it is significant it means that the correlation matrix is not an iden- tity matrix). Rotation of principal components was through the transformation of the components to approximate a sim- ple structure. The raw varimax criterion of the orthogonal rotation method was employed for the rotation of the factor
matrix (the aim of the varimax rotation is to maximize the sum of variances of a quadratic weight). Cumulative propor- tion of variance criterion was finally employed to determine the number of components to extract. Statistic analysis was performed using Factor ver. 7.00 [5] and PAST [2].
Results
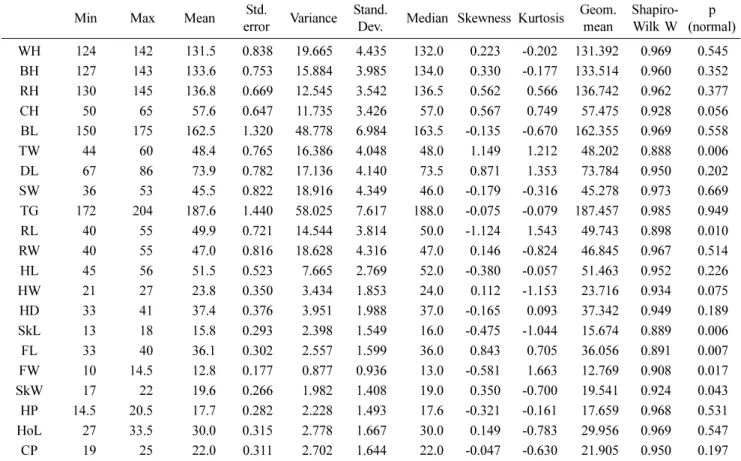
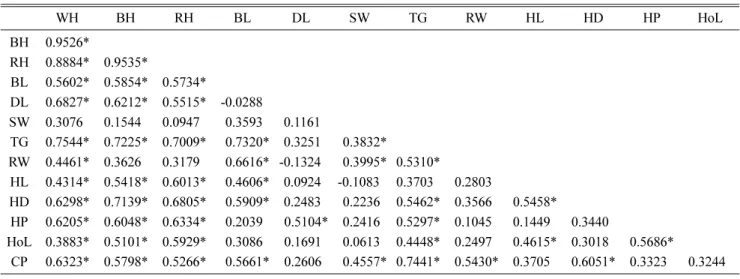
Main statistic values for linear body measurements are presented in Table 1. Eight traits were subsequently elimi- nated because their distribution is not normal [chest height, thorax width, rump length, head width, skull length and width, face length and width]. Pearson’s coefficient of corre- lation matrix for normally distributed measurements is shown in Table 2. Moderate to high estimates were attained for most of the variables. In the factor analysis for the extant thirteen traits, the KMO measure of sampling adequacy was 0.725. Bartlett’s test of sphericity was significant (chi-square
= 321.0, p < 0.01). The determinant of the matrix was 0.000000412510722 and so the variance of the variables can be reproduced using the other variables.
The first two components (PC1 and PC2) were selected, accounting cumulatively for 65.8% of the variance in the remnant thirteen traits (Table 3). The first principal compo-
Table 1. Main statistic values for linear body dimensions (cm) of “Pallaresa” cows (N = 28)
Min Max Mean Std.
error Variance Stand.
Dev. Median Skewness Kurtosis Geom.
mean
Shapiro- Wilk W
p (normal)
WH 124 142 131.5 0.838 19.665 4.435 132.0 0.223 -0.202 131.392 0.969 0.545
BH 127 143 133.6 0.753 15.884 3.985 134.0 0.330 -0.177 133.514 0.960 0.352
RH 130 145 136.8 0.669 12.545 3.542 136.5 0.562 0.566 136.742 0.962 0.377
CH 50 65 57.6 0.647 11.735 3.426 57.0 0.567 0.749 57.475 0.928 0.056
BL 150 175 162.5 1.320 48.778 6.984 163.5 -0.135 -0.670 162.355 0.969 0.558
TW 44 60 48.4 0.765 16.386 4.048 48.0 1.149 1.212 48.202 0.888 0.006
DL 67 86 73.9 0.782 17.136 4.140 73.5 0.871 1.353 73.784 0.950 0.202
SW 36 53 45.5 0.822 18.916 4.349 46.0 -0.179 -0.316 45.278 0.973 0.669
TG 172 204 187.6 1.440 58.025 7.617 188.0 -0.075 -0.079 187.457 0.985 0.949
RL 40 55 49.9 0.721 14.544 3.814 50.0 -1.124 1.543 49.743 0.898 0.010
RW 40 55 47.0 0.816 18.628 4.316 47.0 0.146 -0.824 46.845 0.967 0.514
HL 45 56 51.5 0.523 7.665 2.769 52.0 -0.380 -0.057 51.463 0.952 0.226
HW 21 27 23.8 0.350 3.434 1.853 24.0 0.112 -1.153 23.716 0.934 0.075
HD 33 41 37.4 0.376 3.951 1.988 37.0 -0.165 0.093 37.342 0.949 0.189
SkL 13 18 15.8 0.293 2.398 1.549 16.0 -0.475 -1.044 15.674 0.889 0.006
FL 33 40 36.1 0.302 2.557 1.599 36.0 0.843 0.705 36.056 0.891 0.007
FW 10 14.5 12.8 0.177 0.877 0.936 13.0 -0.581 1.663 12.769 0.908 0.017
SkW 17 22 19.6 0.266 1.982 1.408 19.0 0.350 -0.700 19.541 0.924 0.043
HP 14.5 20.5 17.7 0.282 2.228 1.493 17.6 -0.321 -0.161 17.659 0.968 0.531 HoL 27 33.5 30.0 0.315 2.778 1.667 30.0 0.149 -0.783 29.956 0.969 0.547
CP 19 25 22.0 0.311 2.702 1.644 22.0 -0.047 -0.630 21.905 0.950 0.197
WH: withers height, BH: back height, RH: rump height, CH: chest height, BL: body length, TW: thorax width, DL: back-sternal diameter, SW: shoulder width, TG: thorax girth, RL: rump length, RW: rump width, HL: head length, HW: head width, HD: head depth, SkL: skull length, FL: face length, FW: face width, SkW: skull width, HP: horn perimeter, HoL: horn outer horn length, CP: cannon perimeter.
Varimax rotated principal component analysis of a relict cow
9
nent (PC1) accounted for 51.6% of the total variance and clearly distinguished dorsal heights. The second PC (PC2) summarized 14.2% of the variation, and showed a differenti- ation pattern with back-sternal diameter.
The communalities (0.305~0.931) observed indicated that a good amount of variance has been accounted for by the component solution. For withers height, back height and rump height, it means that about 88.5%, 93.1% and 90.9%
respectively of their variance has been captured by the two PC together. All traits presented coefficients > 0.300 and showed a negative relative contribution of each trait to the PC1 (Table 3). Being of the same sign, the PC1 seemed to be explaining the body size of the cow.
Discussion
Shoulder width, rump width and horn perimeter were the more variable parameters but in general all traits showed low variance. This could be attributed to a low degree of environ- mental effects and the same condition of all animals. The obtained metric traits were in general slightly minor than those obtained by Jordana et al. [4], although no statistical test has been applied to compare them. Probably the differ- ences are due to a simple individual variation.
The result of PCA is slightly lower to those obtained by other authors. Pundir et al. [8] studied Kankrej cows using 18 measurements and these explained 66.0% of total varia- tion. Salako [10] who studied Uda sheep using seven mea- surements and these explained 67.7% of the total variation.
Curiously, both Yakubu & Ayoade [13] in rabbit as Shahin et al. [12] in buffalo obtained positive loadings on all body measurements. The variables associated with withers height, back height and rump height had the highest loadings (com- ponent-variate correlations), followed by thoracic girth. It corroborates the submission of Pundir et al. [8], Salako [10], Shahin & Hassan [11] and Yakubu & Ayoade [13], between others, for whom the PC1 can be considered as a generalized size factor. Similarly, Ruales-España & Perdomo [9] extracted eight principal components from 31 original traits and con- cluded that these could be of great importance in the determi- nation of body attributes of criole Romosinuano cow. Size can be synonymous with body mass as traits correlated with live weight, such thoracic girth, present a high communality (0.771). Moreover, as it has been seen, high relationship appeared between thoracic girth and withers height, back height and rump height, this could imply that selection for any of these traits will lead to improvement in the other.
More importantly, any of these body dimensions could serve as a predictor of body mass. Thus body weight can be esti- mated by size. Because this multicollinearity of interdepen- dent explanatory variables, it could lead to erroneous
Table 2. Coefficients of correlation among body measurements of “Pallaresa” cows (N=28)WH BH RH BL DL SW TG RW HL HD HP HoL
BH 0.9526*
RH 0.8884* 0.9535*
BL 0.5602* 0.5854* 0.5734*
DL 0.6827* 0.6212* 0.5515* -0.0288
SW 0.3076 0.1544 0.0947 -0.3593 -0.1161
TG 0.7544* 0.7225* 0.7009* -0.7320* -0.3251 0.3832*
RW 0.4461* 0.3626 0.3179 -0.6616* -0.1324 0.3995* 0.5310*
HL 0.4314* 0.5418* 0.6013* -0.4606* -0.0924 -0.1083 0.3703 0.2803
HD 0.6298* 0.7139* 0.6805* -0.5909* -0.2483 0.2236 0.5462* 0.3566 0.5458*
HP 0.6205* 0.6048* 0.6334* -0.2039 0.5104* 0.2416 0.5297* 0.1045 0.1449 0.3440
HoL 0.3883* 0.5101* 0.5929* -0.3086 0.1691 0.0613 0.4448* 0.2497 0.4615* 0.3018 0.5686*
CP 0.6323* 0.5798* 0.5266* -0.5661* 0.2606 0.4557* 0.7441* 0.5430* 0.3705 0.6051* 0.3323 0.3244
*
p < 0.05.
Table 3. Eigenvalues and communalities after unrotated matrix of each morphological trait of “Pallaresa” cows
Trait PC1 PC2 Communality
WH -0.923 0.885
BH -0.933 0.931
RH -0.913 0.909
BL -0.725 0.513 0.789
DL -0.491 -0.670 0.690
SW -0.354 0.424 0.305
TG -0.860 0.771
RW -0.544 0.655 0.726
HL -0.581 0.339
HD -0.758 0.585
HP -0.637 -0.434 0.594
HoL -0.582 0.370
CP -0.755 0.310 0.667
Eigenvalue 6.712 1.847
% variance 51.63 14.21
Loadings lower than absolute 0.300 are omitted.
10
PM Parés-Casanova, I Sinfreu, D Villalbainferences if only thoracic girth was used as predictor. The PC2 had its loading for back-sternal diameter.
So, the use of orthogonal characters (PC1 and PC2) derived from the PCA can be more reliable in predicting body size compared to the use of the original body measure- ments. These first two PC could be exploited in the evalua- tion and comparison of animals and thus provide an opportunity to select the animals based on a small group of traits rather than on isolated traits. Our results suggest that the present PCA provided a means for a reduction in the number of biometric traits to be recorded in “Pallaresa” cows [withers height, back height, rump height and thoracic girth]
which could be used in ranking programs as a mean to explain the body conformation.
Acknowledgments
Authors wish to express their special gratitude to all farm- ers who allowed the measurements and/or observation of their cattle: Ignasi Sinfreu Canturri, Fernando Blasi and Mercè Casals, from Pallars Sobirà, and the “Cal Puxica”
family, from Berguedà.
References
1. Ali AKA, Al-Enazi M, Hayes E, Al-Saidy M. Phenotypic factor and image analysis of type traits of Holstein cows in the Masstock Saudi herds. J King Saud Univ Agric Sci 1995, 7, 143-161.
2. Hammer Ø, Harper DAT, Ryan PD. PAST: Paleontological statistics software package for education and data analysis.
Palaeontol Electronica 2001, 4, art. 4.
3. Herrera M, Luque M. Morfoestructura y sistemas para el futuro en la valoración morfológica. In: Sañudo C (ed.).
Valoración morfológica de los animales domésticos. pp. 83- 102, Ministerio de Medio Ambiente y Medio Rural y Marino, Madrid, 2009.
4. Jordana J, Ferrando A, Marmi J, Avellanet R, Aranguren-
Méndez JA, Goyache F. Molecular, genealogical and morphometric characterisation of the Pallaresa, a Pyrenean relic cattle breed: Insights for conservation. Livest Sci 2010, 132, 65-72.
5. Lorenzo-Seva U, Ferrando PJ. FACTOR: a computer program to fit the exploratory factor analysis model. Behav Res Methods 2006, 38, 88-91.
6. Miserani MG, McManus C, Santos SA, Silva JA, Mariante AS, Abreu UGP, Mazza MC, Sereno JRB. Variance analyses for biometric measures of the Pantaneiro horse in Brazil. Arch Zootec 2002, 51, 113-120.
7. Posta J, Komlósi I, Mihók S. Principal component analysis of performance test traits in Hungarian sporthorse mares.
Arch Tierz 2007, 50, 125-135.
8. Pundir RK, Singh PK, Singh KP, Dangi PS. Factor analysis of biometric traits of Kankrej cows to explain body conformation. Asia Australas J Anim Sci 2011, 24, 449-456.
9. Ruales-España FR, Perdomo CM. Uso del análisis de componentes principales para construir un índice tipo producción en ganado Romosinuano (Bos taurus). Rev Colomb Cienc Pecu 2007, 20, 124-128.
10. Salako AE. Principal component factor analysis of the morphostructure of immature Uda sheep. Int J Morphol 2006, 24, 571-574.
11. Shahin KA, Hassan NS. Sources of shared variance among body shape characters at marketing age in new zealand white and Egyptian rabbit breeds. Ann Zootech 2000, 49, 435-445.
12. Shahin KA, Soliman AM, Moukhtar AE. Sources of shared variability for the Egyptian buffalo body shape (conformation). Livest Prod Sci 1993, 36, 323-334.
13. Yakubu A, Ayoade JA. Application of principal component factor analysis in quantifying size and morphological indices of domestic rabbits. Int J Morphol 2009, 27, 1013- 1017.
14. Yakubu A, Salako AE, Abdullah AR. Varimax rotated principal component factor analysis of the zoometrical traits of Uda Sheep. Arch Zootec 2011, 60, 813-816.