pISSN 1229-3008 eISSN 2287-6251
Progress in Superconductivity and Cryogenics
Vol.19, No.1, (2017), pp.26~29 https://doi.org/10.9714/psac.2017.19.1.026
```
1. INTRODUCTION
It is important to understand AC transport properties of coated conductor for commercialization and other applications.[1] In our previous studies, we measured distributions of DC transport current in coated conductor with various external magnetic fields[2] and noticed that the DC current distribution was redistributed by external fields [3–7]. Likewise the DC current experiment, investigation about distribution of AC transport current and field dependence of AC current had been necessary. In this study, we developed the technique which can selectively detect signal of local AC transport current in noise-free condition by using Lock-in amplifier [8]. We measured 1-dimensional magnetic field profiles by using Low Temperature Scanning Hall Probe Microscopy (LTSHPM) near superconducting critical temperature Tc
for the condition of current which can be easily influenced by external field. We obtained distributions of AC current by the inversion calculation from the measured magnetic field profiles and compared with distributions of DC current. We carried out the same measurements at various external magnetic fields and investigated field dependence of AC current distribution.
2. EXPERIMENTAL PROCEDURES
2.1. Samples
We used commercialized GdBCO coated conductor produced by SuNAM Co. Ltd. The thickness of GdBCO layer is 1 μm and protection layer (Ag) is 1-3 μm. In this
1.5 mm
x y
4.0 mm 0
0.5 mm
4.0 mm
x y
0
(a) (b)
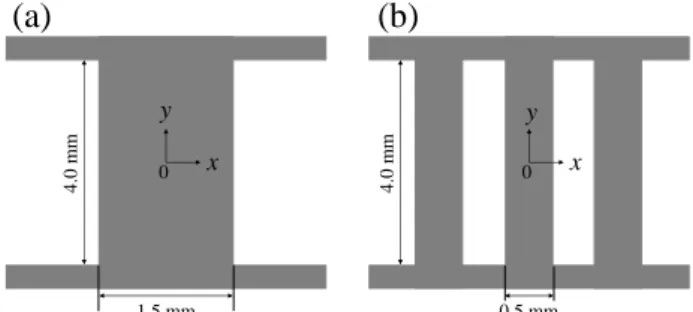
Fig. 1. The dimension of GdBCO coated conductor samples with (a) one bridge and (b) three bridge structure.
study, we removed protection layer to use LTSHPM. We made the samples as two filamentary structures by photolithography process. The dimensions of samples are shown in Fig. 1. The one bridge sample has width of 1.5 mm and length of 4.0 mm. The three bridge sample has the same length and total width as one bridge sample. The bridges of three bridge sample had width of 0.5 mm respectively and they were separated by gaps of 0.5 mm.
2.2. Measurement technique
In order to measure the magnetic field signal of AC transport current, we used Lock-in amplifier and LTSHPM.
The principle of LTSHPM was shown in reference [2, 9-10]. We used 50x50 μm Hall probe and its height from the samples was about 100 μm. We connected Lock-in amplifier to voltage output of Hall sensor and measured AC voltage. The reference input of Lock-in amplifier was connected with AC power supply which is current source of samples. Fig. 2 shows the schematic diagram of connection of Lock-in amplifier and LTSHPM.
Selective detection of AC transport current distributions in GdBCO coated conductors using low temperature scanning Hall probe
microscopy
Chan Kim, Mu Young Kim, Hee Yeon Park, and Hyeong-Ceoul Ri*
Kyungpook National University, Daegu, Korea
(Received 13 February 2017; revised or reviewed 10 March 2017; accepted 11 March 2017)
Abstract
We studied the distribution of the current density and its magnetic-field dependence in GdBCO coated conductors with AC bias currents using low temperature scanning Hall probe microscopy. We selectively measured magnetic field profiles from AC signal obtained by Lock-in technique and calculated current distributions by inversion calculation. In order to confirm the AC measurement results, we applied DC current corresponding to RMS value of AC current and compared distribution of AC and DC transport current. We carried out the same measurements at various external DC magnetic fields, and investigated field dependence of AC current distribution. We notice that the AC current distribution unaffected by external magnetic fields and preserved their own path on the contrary to DC current.
Keywords : Superconductivity, AC transport current, Coated conductors, Current distribution
* Corresponding author: [email protected]
Chan Kim, Mu Young Kim, Hee Yeon Park, and Hyeong-Ceoul Ri
Sample
Hall sensor
Lock-in amplifier
~
AC input
Reference signal
Vac Magnetic field
DC input
Fig. 2. Schematic diagram of Lock-in and LTSHPM connection.
We applied AC current to samples with IRMS = 420 mA, f = 64.44 Hz for considering our previous studies and interference of other apparatuses in 60 Hz. The measured AC magnetic field profile was converted into in-phase component by Lock-in amplifier for comparison with DC experimental result. We obtained current density distribution from the measured magnetic field profile by using inversion calculation [11–13].
3. EXPERIMENTAL RESULTS
3.1. Temperature dependence of resistivity
To decide experimental temperature for LTSHPM, we measured temperature dependence of resistivity of samples by 4-probe measurement. We applied bias current 1 mA and measured resistivity with temperature ramp rated +1 K/min. Fig. 3 shows the results. The critical temperature of one bridge sample is 93.89 K and three bridge sample is 93.80 K. We set experimental temperature at reduced temperature t (T/Tc) = 0.909.
93.2 93.4 93.6 93.8 94.0 94.2 94.4 94.6 94.8 0
20 40 60 80 100
Resistivity (cm)
Temperature (K)
One bridge Three bridge
Critical Temperature One bridge Three bridge
93.89 K 93.80 K Ibias = 1 mA
Ramp rate = +1 K/min
Fig. 3. Temperature dependence of resistivity of one bridge sample (black) and three bridge sample (red). The critical temperature of one bridge sample is 93.89 K and three bridge is 93.80 K.
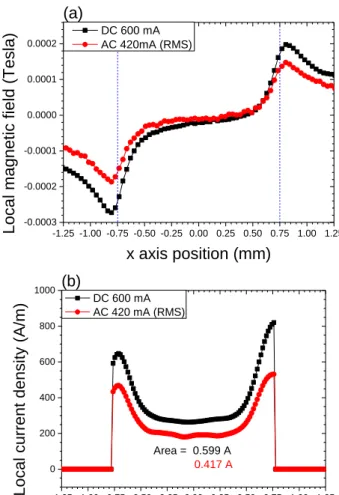
3.2 Comparison between DC and AC current density distribution We measured 1-dimensional magnetic field distribution of DC and AC transport current across the center of the sample (y = 0) at t = 0.909. In the one bridge sample we applied DC 600 mA and measured magnetic field profile for comparison with AC current. The measured profiles are shown in Fig. 4 (a). The distribution of AC current was similar to DC current while it has amplitude difference.
We calculated current density distribution and compared two results. Fig. 4 (b) shows current distribution of AC and DC current. The total currents of DC and AC current were obtained from area calculation of current density distributions. The current density distribution of AC was similar to DC and difference of total current was almost √2.
We multiplied AC results of Fig. 4 (a) and (b) by factor √2 and compared with DC result. Fig. 4 (c) and (d) show those comparison results. The distributions and total current of AC was almost the same as DC. In the three bridge sample, we applied DC 420 mA which corresponded to RMS value of AC current, compared between DC and AC directly. Fig.
5 (a) and (b) show the magnetic field and current distributions of AC and DC. The distributions and total currents of AC and DC were almost the same. We noticed that the magnetic field and current distribution of AC was the same as DC and measured in RMS.
-1.25 -1.00 -0.75 -0.50 -0.25 0.00 0.25 0.50 0.75 1.00 1.25 -0.0003
-0.0002 -0.0001 0.0000 0.0001 0.0002
Local magnetic field (Tesla)
x axis position (mm)
DC 600 mA AC 420mA (RMS)
(a)
-1.25 -1.00 -0.75 -0.50 -0.25 0.00 0.25 0.50 0.75 1.00 1.25 0
200 400 600 800 1000 (b)
Area = 0.599 A 0.417 A
Local current density (A/m)
x axis position (mm)
DC 600 mA AC 420 mA (RMS)
27
Selective detection of AC transport current distributions in GdBCO coated conductors using low temperature scanning Hall probe microscopy
-1.25 -1.00 -0.75 -0.50 -0.25 0.00 0.25 0.50 0.75 1.00 1.25 -0.0003
-0.0002 -0.0001 0.0000 0.0001 0.0002
(c)
Local magnetic field (Tesla)
x axis position (mm)
DC 600 mA
AC 420mA (RMS) 2
-1.25 -1.00 -0.75 -0.50 -0.25 0.00 0.25 0.50 0.75 1.00 1.25 0
200 400 600 800 1000 (d)
Area = 0.599 A 0.590 A
Local current density (A/m)
x axis position (mm)
DC 600 mA
AC 420 mA (RMS)
Fig. 4. (a) The magnetic field distribution of DC 600 mA and AC 420 mA (RMS) in one bridge sample at t = 0.909 (T=85.34 K) and (b) calculated current density distributions by inversion calculation. (c) Multiplied AC magnetic field distribution of (a) by √2 and (d) multiplied AC current distribution of (b) by √2.
3.3 Field dependence of AC current distribution
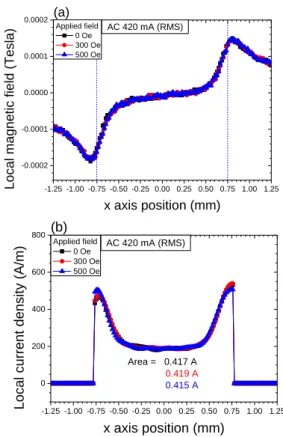
In order to investigate field dependence of AC current, we applied AC transport current to samples with external DC magnetic fields. The direction of external magnetic field was + z axis which is perpendicular to the sample surface. In one bridge sample, we applied AC current of 420 mA (RMS) in external magnetic fields of 300 Oe and 500 Oe.
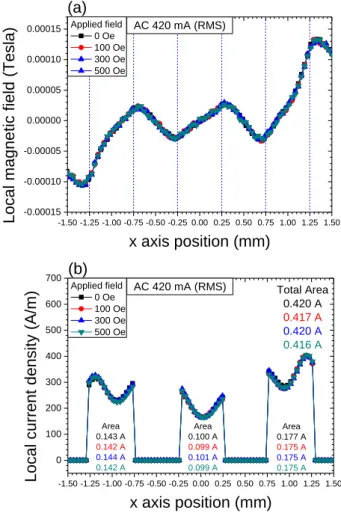
The measured local magnetic field distributions is shown in Fig. 6(a). The distributions of local magnetic field in external magnetic fields were almost the same as result of 0 Oe. We calculated current density distributions from local magnetic field distributions and showed in Fig. 6 (b). The current density distributions in external fields were quite similar to 0 Oe. In case of the three bridge, we applied the same experimental condition of one bridge sample with external magnetic fields of 100 Oe, 300 Oe and 500 Oe. Fig.
7(a) and (b) show the magnetic field and current density distributions. The distributions of AC transport current in external fields were the same as 0 Oe and current values of each bridge in Fig. 7(b) were almost not changed by external fields. From the results of two samples, we noticed that the AC transport current density distribution was almost unaffected by external DC magnetic fields on the contrary to the DC current experimental results.
-1.50 -1.25 -1.00 -0.75 -0.50 -0.25 0.00 0.25 0.50 0.75 1.00 1.25 1.50 -0.0001
0.0000 0.0001 0.0002
(a)
Local magnetic field (Tesla)
x axis position (mm)
DC 420 mA AC 420 mA (RMS)
-1.50 -1.25 -1.00 -0.75 -0.50 -0.25 0.00 0.25 0.50 0.75 1.00 1.25 1.50 0
100 200 300 400 500 600
(b)
Total Area 0.420 A 0.420 A
Area 0.176 A 0.177 A Area
0.104 A 0.100 A Area
0.141 A 0.143 A
Local current density (A/m)
x axis position (mm)
DC 420 mA AC 420 mA (RMS)
Fig. 5. (a) The magnetic field distribution of DC 420 mA and AC 420 mA (RMS) in three bridge sample at t = 0.909 (T=85.26 K) and (b) calculated current density distributions by inversion calculation.
-1.25 -1.00 -0.75 -0.50 -0.25 0.00 0.25 0.50 0.75 1.00 1.25 -0.0002
-0.0001 0.0000 0.0001 0.0002 (a)
AC 420 mA (RMS)
Local magnetic field (Tesla)
x axis position (mm)
Applied field 0 Oe 300 Oe 500 Oe
-1.25 -1.00 -0.75 -0.50 -0.25 0.00 0.25 0.50 0.75 1.00 1.25 0
200 400 600 800(b)
AC 420 mA (RMS)
Area = 0.417 A 0.419 A 0.415 A
Local current density (A/m)
x axis position (mm)
Applied field 0 Oe 300 Oe 500 Oe
Fig. 6. (a) The magnetic field distribution of AC 420 mA (RMS) with external fields in one bridge sample at t = 0.909 (T=85.34 K) and (b) calculated current density distributions by inversion calculation.
28
Chan Kim, Mu Young Kim, Hee Yeon Park, and Hyeong-Ceoul Ri
-1.50 -1.25 -1.00 -0.75 -0.50 -0.25 0.00 0.25 0.50 0.75 1.00 1.25 1.50 -0.00015
-0.00010 -0.00005 0.00000 0.00005 0.00010 0.00015
(a)
AC 420 mA (RMS)
Local magnetic field (Tesla)
x axis position (mm)
Applied field 0 Oe 100 Oe 300 Oe 500 Oe
-1.50 -1.25 -1.00 -0.75 -0.50 -0.25 0.00 0.25 0.50 0.75 1.00 1.25 1.50 0
100 200 300 400 500 600 700 (b)
AC 420 mA (RMS) Total Area 0.420 A 0.417 A 0.420 A 0.416 A
Area 0.177 A 0.175 A 0.175 A 0.175 A Area
0.100 A 0.099 A 0.101 A 0.099 A Area
0.143 A 0.142 A 0.144 A 0.142 A
Local current density (A/m)
x axis position (mm)
Applied field 0 Oe 100 Oe 300 Oe 500 Oe
Fig. 7. (a) The magnetic field distribution of AC 420 mA (RMS) with external fields in three bridge sample at t = 0.909 (85.26 K) and (b) calculated current density distributions by inversion calculation.
4. CONCLUSIONS
In this study, we produced two filament type samples of GdBCO coated conductor by photolithography process.
We measured temperature dependence of resistivity of two samples. The critical temperature of one bridge sample was 93.89 K and in case of three bridge was 93.80 K. We carried out LTSHPM experiments at 85.34 K of one bridge sample and 85.26 K of three bridge sample which is t (T/Tc) = 0.909.
We applied AC current to GdBCO samples and selectively detected magnetic field distributions by using Lock-in amplifier and LTSHPM. In order to compare with DC results, we applied DC current with the same condition of AC. The measured magnetic field distributions of AC were the same as DC results. We calculated current distributions by inversion calculation from magnetic field distributions and compared between AC and DC current.
The distributions AC current were the same as DC current.
We carried out the same measurements of AC current distribution at various external fields for investigation of field dependence of AC current. We applied AC current 420 mA (RMS) to samples with external magnetic fields whose direction is + z axis. And we measured magnetic
fields distributions of AC current. The distributions were same as result of 0 Oe. We calculated current distributions from magnetic field distributions and the AC current distributions in external fields also were same as 0 Oe. We noticed that the AC transport current distribution was unaffected by external DC magnetic fields and preserved their own path differently to DC current.
ACKNOWLEDGMENT
This study was supported by Brain Korea 21 Plus. We thanks to SuNAM Co., Ltd. for providing GdBCO coated conductor sample.
REFERENCES
[1] J. Rieger, M. Leghissa, J. Wiezoreck, H.-P. Krämer, G. Ries, and H.-W. Neumüller, “Development of a 10 m long superconducting multistrand conductor for power transmission cables,” Supercond. Sci. Technol., vol. 11, no. 9, pp. 902–908, 1998.
[2] S. K. Park, B. R. Cho, H. Y. Park, and H. Ri, “Analysis of the local current in GdBCO coated conductors using low-temperature scanning laser and Hall probe microscopy,”
Cryogenics, vol. 52, pp. 744–748, 2012.
[3] J. Yoo, J. Lee, S.-M. Lee, Y.-H. Jung, D. Youm, and S. S. Oh,
“Current redistribution of a current carrying superconducting tape in a perpendicular magnetic field,” Supercond. Sci. Technol., vol. 22, no. 12, p. 125019, 2009.
[4] E. H. Brandt and M. Indenbom, “Type-II-superconductor strip with current in a perpendiculat magnetic field,” Phys. Rev. B, vol.
48, no. 17, p. 14, 1993.
[5] C. Xue, A. He, H. Yong, and Y. Zhou, “Field-dependent critical state of high-Tc superconducting strip simultaneously exposed to transport current and perpendicular magnetic field,” AIP Adv., vol. 3, no. 12, p. 122110, 2013.
[6] J. Herrmann, “Current distribution and critical state in superconducting silver-sheathed ž Bi, Pb / -2223 tapes,” Science, vol. xxx, pp. 114–124, 1998.
[7] A. Miyazoe, M. Sekino, T. Kiyoshi, and H. Ohsaki, “Current distribution in coated conductor under external magnetic field up to 5 T,” IEEE Trans. Appl. Supercond., vol. 21, no. 3, pp.
1600–1603, 2011.
[8] X. Wang, “Sensitive digital lock‐in amplifier using a personal computer,” Rev. Sci. Instrum., vol. 61, no. 7, pp. 1999–2001, 1990.
[9] A. M. Chang et al., “Scanning Hall probe microscopy,” Appl.
Phys. Lett., vol. 61, no. 16, pp. 1974–1976, 1992.
[10] A. Oral, S. J. Bending, and M. Henini, “Scanning Hall probe microscopy of superconductors and magnetic materials,” J. Vac.
Sci. Technol. B Microelectron. Nanom. Struct. Process. Meas.
Phenom., vol. 14, no. 2, pp. 1202–1205, 1996.
[11] T. Johansen et al., “Direct observation of the current distribution in thin superconducting strips using magneto-optic imaging,”
Phys. Rev. B, vol. 54, no. 22, pp. 16264–16269, 1996.
[12] A. Lucarelli, G. Lüpke, T. J. Haugan, G. A. Levin, and P. N.
Barnes, “Time-resolved magneto-optical imaging of Y1Ba2Cu3O7−δ thin films in high-frequency AC current regime,”
Supercond. Sci. Technol., vol. 19, no. 6, pp. 667–670, 2006.
[13] A. V Bobyl, D. V Shantsev, Y. M. Galperin, T. H. Johansen, M.
Baziljevich, and S. F. Karmanenko, “Relaxation of transport current distribution in a YBaCuO strip studied by magneto-optical imaging,” Supercond. Sci. Technol., vol. 15, no.
1, pp. 82–89, 2002.
29