DOI: 10.5389/KSAE.2010.52.6.057
Seasonal Variation in Heavy Metal Removal Efficiency and Application of Risk Assessment for Constructed Wetlands
인공습지에서 중금속 제거율의 계절적 변동 및 위해성평가
Shin, Yu-Ri* Yoon, Chun Gyeong*, Son, Yeong Kwon* Kim, Hyung Joong**
신유리 윤춘경 손영권 김형중
ABSTRACT
본 연구는 자유수면형 인공습지에서의 시기적인 중금속 제거율의 변동을 평가하기 위하여 수행되었다. 대상 인공습지의 유입 수는 하수처리수가 포함된 하천수이다. 인공습지에는 갈대 (Phragmites australis)와 부들 (Typha latifolia)이 주로 분포하며, 이들 두 종은 습지의 95 % 이상을 차지하는 우점종이다. 2009년 5월부터 9월까지 습지의 유입과 유출부분에서 유입수와 유출수를 시 료 채취하였다. 채취된 시료는 ICP-AES 방법을 이용하여 6가지 중금속을 분석하였으며, 위해성 평가를 이용하여 카드뮴 (Cd), 크롬 (Cr+6), 비소 (As), 납 (Pb), 니켈 (Ni), 구리 (Cu)의 분석 결과를 평가하였다. 위해성평가는 농부와 레크리에이션에 대한 두 가지 시나리오를 바탕으로 이루어졌다. 연평균 중금속 제거율은 계절적인 변화 측면에서 큰 변화를 나타내지 않았다. 위해성 평 가 결과 시료가 채취된 부분 및 계절적인 변화 대부분에서 US EPA의 기준인 10-4를 초과하지 않는 수준으로 허용가능한 수준이 었다. 하지만, 봄철 농부에 대한 위해성평가 결과 위해도가 10-4 수준이며, 10-6-10-8 수준은 질병의 이동이 우려되는 수준 (US EPA)임을 감안하여, 인공습지에 중금속 농도 저감 시설의 설치를 고려해야 한다. 본 연구에서는 위해성 평가를 가상의 시나리오 에 적용하여 평가를 시도함으로서, 수치적인 자료로 제시할 수 있을 뿐만 아니라 중금속의 정량적인 평가를 수행할 수 있었다.
따라서 위해성 평가는 인공습지의 안전성에 대하여 대중과 소통할 수 있는 도구로서 이용할 수 있으며, 인공습지의 효율적인 운 영 및 현장 적용에 있어서 스크리닝 도구로서의 역할이 가능할 것으로 판단된다.
Keywords: Constructed wetland; heavy metal; risk assessment; seasonal variation
I. INTRODUCTION*
Green remediation approaches, such as constructed wetlands, are increasingly being used worldwide. Constructed wetlands imitate natural ecosystems in the way they interact with biological, chemical, and physical components and are ecological and economical. Constructed wetland systems are well-suited for rural settings or areas of low population density because they have lower maintenance costs than alternative treatments. Wetland systems collect nutrients, organic matter, micro-pollutants, and heavy metals, and can improve the environment through decontamination. Constructed wetlands can also be used for recreation (Yeh et al., 2009;
* Department of Environmental Science, Konkuk University
** Korea Rural Research Institute
† Corresponding author Tel.: +81-2-452-3931 Fax: +81-2-452-3931
E-mail: [email protected] 2010년 9월 10일 투고
2010년 10월 18일 심사완료 2010년 10월 27일 게재확정
Maine et al., 2007).
Heavy metal pollution is one of the most crucial environmental problems. Heavy metals do not degrade and can accumulate in water, soil, bottom sediments, and living organisms. Thus, wetlands are used to trap heavy metals before they reach receiving waters (Yeh et al., 2009;
Miretzky et al., 2004). The main processes for removing metals in wetlands take place in water, biota, and suspended solids. Aquatic plants have the ability to accumulate metals present in their environment and concentrate them in tropic chains through an accumulative effect (Miretzky et al., 2004;
Lytle et al., 1998; Stottmeister et al., 2003). In addition, sedimentation and settling efficiently remove metals associated with particulate matter (Sheoran and Sheoran et al., 2006).
For green remediation, the potential toxicity of effluent water needs to be evaluated before implementing constructed wetlands. Quantitative analysis of metal in effluent water should be considered to determine a suitable method of remediation (Rattan et al., 2005; Sridhara Chary et al.,
2008). In addition, for an efficient approach, constructed wetland systems should be based on regional characteristics such as vegetation, locations, and weather conditions (Kadlec and Wallace, 2008). South Korea has a diverse climate system because of its four seasons and location on the east coast of the Eurasian continent (Park et al., 2009).
The objectives of this study were to evaluate the rate of heavy metal removal in wetlands, derive a numerical formulation to predict heavy metal removal rates in the wetlands of South Korea, and perform a risk assessment for heavy metal contamination. For the evaluation and utilization of the wetland effluent water, this study suggested two scenarios: recreation and agriculture.
II. MATERIALS AND METHODS
1. Experiments and operating conditions of the wetlands
Constructed wetland systems were located in the Sukmoon reservoir of Asan Bay, South Korea (126° 34’E, 36° 56’~
37°N) and consisted of four sets of free-surface-flow constructed wetland systems, including wetland-pond systems and pond-wetland systems (Fig. 1). The pond systems controlled suspended solids in the contaminated water and helped achieve the target water quality of the wetland. The inflow water was pumped from a river contaminated by agricultural runoff (from paddy fields). More than 95 % of the constructed wetlands were covered over by reed (
Phragmites australis
), and cattail (Typha latifolia
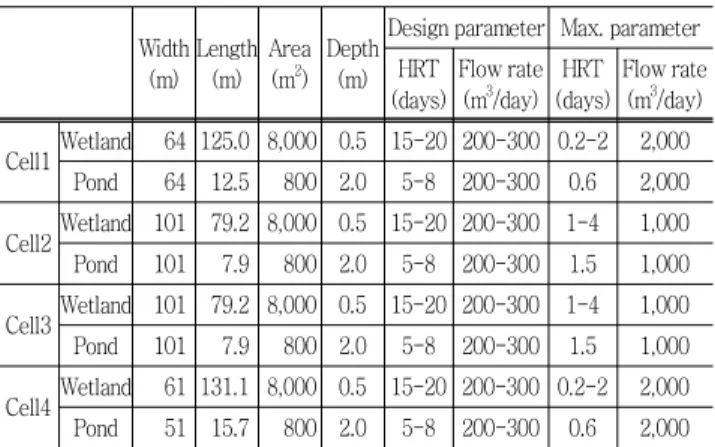
) was the sub-dominant species. The bottom of the wetlands consisted of silt.Table 1 shows specific parameters for the constructed wetlands. Each wetland area was 8,000 m2 and the pond
Fig. 1 Constructed wetland structure.
Table 1 Parameters of the wetlands and ponds
Width (m)
Length (m)
Area (m2)
Depth (m)
Design parameter Max. parameter HRT
(days) Flow rate
(m3/day) HRT (days)
Flow rate (m3/day)
Cell1Wetland 64 125.0 8,000 0.5 15-20 200-300 0.2-2 2,000 Pond 64 12.5 800 2.0 5-8 200-300 0.6 2,000
Cell2Wetland 101 79.2 8,000 0.5 15-20 200-300 1-4 1,000 Pond 101 7.9 800 2.0 5-8 200-300 1.5 1,000
Cell3Wetland 101 79.2 8,000 0.5 15-20 200-300 1-4 1,000 Pond 101 7.9 800 2.0 5-8 200-300 1.5 1,000
Cell4Wetland 61 131.1 8,000 0.5 15-20 200-300 0.2-2 2,000 Pond 51 15.7 800 2.0 5-8 200-300 0.6 2,000
area was 800 m2. The hydraulic retention time was designed to be 15~20 days in the wetland and 5~8 days in the pond system. The depth was 0~0.5 m and was controlled using a weir. Cells 1 and 4 had similar widths and lengths and cells 2 and 3 had a similar shapes.
The experiments were conducted for 5 months (May to September 2009) during which the wetlands were supplied with contaminated water at a constant flow rate of 500 m3/day. The wetland systems had hydraulic retention times of 0.2~4 days in the wetlands and 0.6~1.5 days in the ponds.
2. Field study and laboratory analysis
Samples were collected from each wetland-pond system for 5 months at the influent and effluent points of each wetland. Water samples were measured for dissolved oxygen (DO), biochemical oxygen demand (BOD), chemical oxygen demand by the potassium permanganate method (CODMn), suspended solid (SS), total nitrogen (TN), and total phosphorus (TP). Sediment from the constructed wetlands was also measured for pH, electrical conductivity (EC), Organic carbon, NH4-N, NO3-N, TN, and TP. All analyses were performed according to standard methods (APHA, 2005). Parameters such as temperature, turbidity, pH, and EC were recorded when the sample was collected. Water samples were also analyzed by ICP-AES (JY 138, Jobin-Yvon, France). Pre- treatment was performed by wet combustion using to nitric acid. The target metals were Cd, Cr+6, As, Pb, Ni, and Cu.
3. Risk assessment
Risk assessment was used to determine the probability of
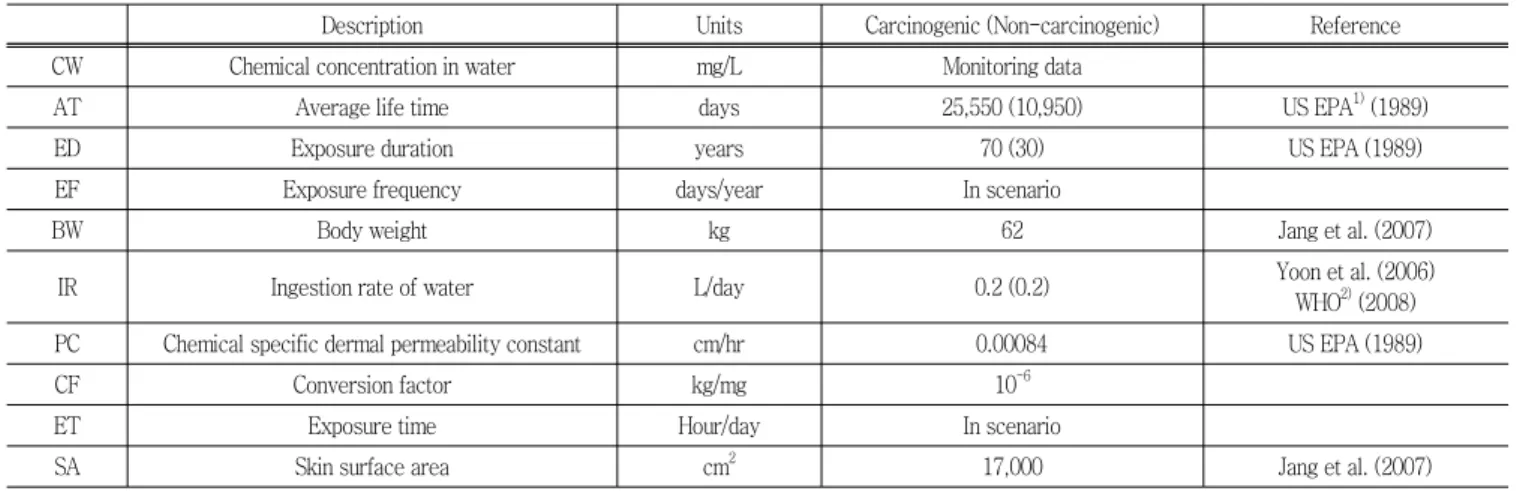
Table 3 Exposure factors for South Korea
Description Units Carcinogenic (Non-carcinogenic) Reference
CW Chemical concentration in water mg/L Monitoring data
AT Average life time days 25,550 (10,950) US EPA1) (1989)
ED Exposure duration years 70 (30) US EPA (1989)
EF Exposure frequency days/year In scenario
BW Body weight kg 62 Jang et al. (2007)
IR Ingestion rate of water L/day 0.2 (0.2) Yoon et al. (2006)
WHO2) (2008)
PC Chemical specific dermal permeability constant cm/hr 0.00084 US EPA (1989)
CF Conversion factor kg/mg 10-6
ET Exposure time Hour/day In scenario
SA Skin surface area cm2 17,000 Jang et al. (2007)
1) US EPA, US Environmental Protection Agency (1989).
2) WHO, World Health Organization (2008).
an event and the probable magnitude of adverse health effects over a specified time period. Human health risk assessment considered four steps: hazard identification, dose-response assessment, exposure assessment, and risk characterization (US EPA, 1989; Kolluru et al., 1996; Lim et al., 2008). Toxicity assessment included two toxicity indices:
the slope factor (SF) for carcinogenic agents and reference dose (RfD) for non-carcinogenic agents. Toxicity incidences of the metals are presented in Table 2, along with values suggested by the Ministry of Environment, Republic of Korea (MOE) and the US Environmental Protection Agency (US EPA).
The estimated intake dose in humans by exposure pathways was determined by the average daily dose (ADD, mg/kg/day) for exposure assessment. The ADD values were used to assess the possibility of metals entering the human body (US EPA, 1989; Lim et al., 2008). The parameters used in ADD equations are presented in Table 3, and the equations are shown below.
Table 2 Toxicity indices of metals
Metals SFa [ (mg/kg/day)-1] RfD1) [mg/kg/day] Weight of evidence (IRIS2))
Oral Dermal Oral Dermal
Cd - - 0.0005 0.000013 -
Cr+6 - - 0.003 - D
As 1.5 1.5 0.0003 0.00029 A
Pb 0.0085 - 0.0005 - B2
Ni - - 0.02 (dissolved) 0.0008 -
Cu - - - - D
1) MOE, Ministry of Environment Republic of Korea (2006)
2) US EPA, IRIS (2010)
×
×××
(1)
×
××××××
(2)
Risk characterization was calculated using carcinogenic risk equation and non-carcinogenic risk equations (hazard quotient, HQ). Total values for the multiple exposure pathways and substances (hazard index, HI) added the calculated risk values according to whether they were carcinogenic or non-carcinogenic. The acceptable range for carcinogenic risk is 10-6 to 10-4. The range for non- carcinogenic risk does not exceed 1 (US EPA, 1989).
× (3)
(4)
Scenario 1. The wetland outflow water was reused for agricultural irrigation. Workers may be exposed to the water through ingestion or dermal contact. Inhalation of vapors or dust containing the target metals is a low exposure possibility, and this pathway was not included in this scenario. The exposure target was a farmer working in a paddy rice field. The exposure frequency was calculated for 100 days/year based on farming periods, and the exposure time was considered to be 8 hour/day (An et al., 2007; Yoon et al., 2006).
Scenario 2. As a green approach, wetlands are constructed
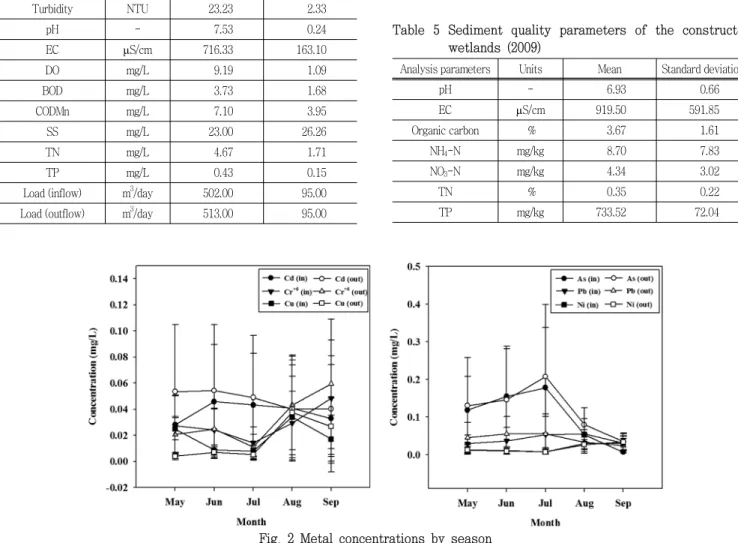
Fig. 2 Metal concentrations by season near cities and connected with a recreational activity. For
example, the effluent water from the wetland can be used in an outdoor pool. Thus, this scenario assumed the wetlands were used for recreational swimming water. The exposure pathways were the same as those for scenario 1.
The exposure frequency was calculated for 30 days/year based on weekends during the season when outdoor swimming pools are open, and the exposure time was considered to be 0.0114 hour/day (MOE, 2007).
III. RESULTS AND DISCUSSION
The water parameters of inflow river water and outflow load are listed in Table 4. Effluent loading was larger than influent loading because of precipitation.
Table 4 Water quality parameters of the inflow river (2009) Analysis parameters Units Mean Standard deviation
Temperature ℃ 12.67 6.51
Turbidity NTU 23.23 2.33
pH - 7.53 0.24
EC µS/cm 716.33 163.10
DO mg/L 9.19 1.09
BOD mg/L 3.73 1.68
CODMn mg/L 7.10 3.95
SS mg/L 23.00 26.26
TN mg/L 4.67 1.71
TP mg/L 0.43 0.15
Load (inflow) m3/day 502.00 95.00
Load (outflow) m3/day 513.00 95.00
Table 5 presents the sediment parameters of the con- structed wetlands. The soil texture of the wetland sediment was silty sand. Organic carbon from accumulated sediment maintained constant concentrations at the input, middle, and outlet points because the wetland vegetation maintained a balanced level, and dead vegetation in winter was distributed throughout this wetland. Organic carbon, TP, and TN showed similar trends. TP was affected by dead vegetation, and the concentrations were highest in at cell 2 and cell 3, which had high vegetation densities.
Fig. 2 and Table 6 show metal concentrations in influent and effluent waters according to the months. The concent- rations of metals in the influent and effluent waters did not increase or decrease with the change in season, with the exception of As, which increased from September until July and decreased from July to September. The difference between the highest and the lowest average concentration was 0.169 at the influent and 0.172 at the effluent. When compared with the permissible levels for sewage disposal
Table 5 Sediment quality parameters of the constructed wetlands (2009)
Analysis parameters Units Mean Standard deviation
pH - 6.93 0.66
EC µS/cm 919.50 591.85
Organic carbon % 3.67 1.61
NH4-N mg/kg 8.70 7.83
NO3-N mg/kg 4.34 3.02
TN % 0.35 0.22
TP mg/kg 733.52 72.04
Table 6 Average concentration of metals from May to September 2009 (mg/L)
May Jun Jul Aug Sep
Mean SD Mean SD Mean SD Mean SD Mean SD
Cd I1) 0.028 0.020 0.046 0.004 0.043 0.005 0.041 0.000 0.041 0.000 O2) 0.053 0.004 0.054 0.007 0.049 0.002 0.040 0.000 0.040 0.000
Cr+6 I 0.028 0.012 0.024 0.012 0.014 0.003 0.029 0.006 0.061 0.026 O 0.021 0.008 0.025 0.014 0.011 0.004 0.043 0.014 0.059 0.017
As I 0.119 0.036 0.155 0.034 0.178 0.048 0.053 0.047 0.009 0.032 O 0.130 0.034 0.146 0.027 0.208 0.062 0.080 0.050 0.036 0.114
Pb I 0.030 0.012 0.037 0.004 0.054 0.012 0.056 0.027 0.039 0.027 O 0.046 0.008 0.055 0.016 0.055 0.004 0.033 0.068 0.024 0.016
Ni I 0.014 0.003 0.011 0.002 0.008 0.002 0.030 0.007 0.037 0.033 O 0.013 0.006 0.010 0.001 0.008 0.006 0.027 0.016 0.034 0.023
Cu I 0.025 0.024 0.009 0.006 0.008 0.005 0.034 0.014 0.021 0.006 O 0.004 0.003 0.007 0.005 0.005 0.003 0.038 0.017 0.027 0.009
1) I : Input, 2) O : Outlet
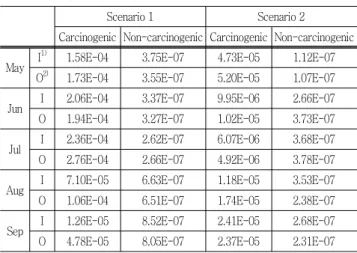
Table 7 Total risk value for the multiple exposure pathways and substances
Scenario 1 Scenario 2
Carcinogenic Non-carcinogenic Carcinogenic Non-carcinogenic
May I1) 1.58E-04 3.75E-07 4.73E-05 1.12E-07 O2) 1.73E-04 3.55E-07 5.20E-05 1.07E-07
Jun I 2.06E-04 3.37E-07 9.95E-06 2.66E-07
O 1.94E-04 3.27E-07 1.02E-05 3.73E-07
Jul I 2.36E-04 2.62E-07 6.07E-06 3.68E-07
O 2.76E-04 2.66E-07 4.92E-06 3.78E-07
Aug I 7.10E-05 6.63E-07 1.18E-05 3.53E-07
O 1.06E-04 6.51E-07 1.74E-05 2.38E-07
Sep I 1.26E-05 8.52E-07 2.41E-05 2.68E-07
O 4.78E-05 8.05E-07 2.37E-05 2.31E-07
1) I : Input, 2) O : Outlet
water reuse (MOE, 2009), the levels of Pb, Ni, and Cu were lower than the guidelines. However, Cd and As values were high, and Cr+6 exceeded the guidelines during September because the dock in the wetland was composed of chromated copper arsenate-treated wood.
The calculated health risks for scenarios 1 and 2 are shown in Table 7. The carcinogenic risk value had acceptable ranges of 10-4~10-5 in scenario 1 and 10-5~10-6 in scenario 2. The non-carcinogenic risk did not exceed the permeable range in either scenario 1 or scenario 2 (10-7). A comparison of influent and effluent, waters showed little difference between the two. The effluent value was greater when the
influent value showed an elevated carcinogenic risk in both scenarios. However, most months had low non-carcinogenic risk in the effluent.
IV. CONCLUSIONS
In this study heavy metal removal efficiency in the constructed wetlands did not show a strong seasonal variation. The difference between the influent and effluent, waters was insignificant. The risk assessments in scenarios 1 and 2 showed similar seasonal variation for the reduction rate, and calculated risk values were within acceptable ranges. Additional periodic treatment processes, such as sediment excavation, should be considered for reduction of heavy metals in constructed wetlands. Sediment excavation can remove metals from wetland systems (Yeh et al., 2009).
This study performed heavy metal analysis at one site in one year. For a reliable estimation of risk, additional heavy metal concentrations at different sites and over longer time period must be analyzed.
The effluent concentration can be affected by the influent concentration, although the reduction rate did not change.
However, heavy metal risk assessment can quantitatively evaluate concentrations using numerical data. It is also possible to evaluate the risk in imaginary scenarios. Public awareness of the potential economic and environmental benefits of green approaches such as constructed wetlands and reclaimed water is important (Kretschmer et al., 2000;
Po et al., 2003). Risk assessment offers a helpful tool for communication the safety of constructed wetlands to the public and can be applied to the management and application of constructed wetlands.
This study was supported by the Development Program of Freshwater Reservoir Integrated Water Quality Prediction and Improvement System of the Korea Rural Research Institute.
REFERENCES
1. American Public Health Association (APHA), Standard Methods for Examination of Water and Wastewater, 2005. 21st edn, American Public Health Association/
American Water Works Association/Water Environment
Federation, Washington DC, USA.
2. An, Y. J., C. G. Yoon, K. W. Jung, and J. H. Ham, 2007.
Estimating the microbial risk of E. coli in reclaimed wastewater irrigation on paddy field.
Environmental monitoring and assessment
129(1/3): 53-60.3. Cheng S., W. Grosse, F. Karrenbrock, and M.
Thoennessen, 2002. Efficiency of constructed wetlands in decontamination of water polluted by heavy metals.
Ecological Engineering
18: 317-325.4. Jang J. Y., S. N. Jo, S. Y. Kim, S. J. Kim, and H. K.
Cheong, 2007.
Korean exposure factors handbook.
Ministry of Environment, Seoul, Korea.
5. Kadlec, R. H., and S. D. Wallace, 2008.
Treatment wetlands
, 2nd edn. CRC Press.6. Kolluru, R. V., S. M. Bartell, R. M. Pitblado, R. S.
Stricoff, 1996.
Risk assessment and management handbook.
McGrow-Hill.7. Kretschmer, N., L., Ribbe, and H., Gaese, 2000.
Wastewater reuse for agriculture.
Technology Resource Management and Development : Scientific Contributions for Sustainable Development
2: 37-64.8. Lim, H. S., J. S. Lee, H. T. Chon, and M. Sager, 2008.
Heavy metal contamination and health risk assessment in the vicinity of the abandoned Songcheon Au-Ag mine in Korea.
Journal of Geochemical Exploration
96: 223-230.9. Lytle, C. M., F. W. Lytle, N. Yang, J. H. Qian, D.
Hansen, A. Zayed, and N. Terry, 1998. Reduction of Cr (VI) to Cr (III) by wetland plants: Potential for in situ heavy metal Detoxification.
Environmental Science and Technology
32: 3087-3093.10. Maine, M. A., N. Suñe, H. Hadad, G. Sánchez, and C.
Bonetto, 2009. Influence of vegetation on the removal of heavy metals and nutrients in a constructed wetland.
Journal of Environmental Management
90: 355-363.11. Ministry of Environment Republic of Korea, National Institute of Environmental Research, 2006.
Notification about risk assessment methods
(in Korean).12. Ministry of Environment Republic of Korea, 2009.
Guidelines for sewage disposal water reuse
, 1469.13. Miretzky, P., A. Saralegui, and A. F. Cirelli, 2004.
Aquatic macrophytes potential for the simultaneous removal of heavy metals (Buenos Aires, Argentina),
Chemosphere
57: 997-1005.14. Park, C., Y. Choi, J. Y. Moon, and W. T. Yun, 2009.
Classification of climate zones in South Korea considering both air temperature and rainfall.
The Korean Geographical Society
44(1): 1-16 (in Korean).15. Po, M., J. D. Kaercher, and B. E. Nancarrow, 2003.
Literature review of factors influencing public perceptions of water reuse
, Technical Report 54/03. CSIRO land and water.16. Rattan, R., S. P. Datta, P. K. Chhonkar, K. Suribabu, and A. K. Singh, 2005. Long-term impact of irrigation with sewage effluents on heavy metal content in soils, crops and groundwater - a case study.
Agriculture, Ecosystems and Environment
109: 310-322.17. Sheoran, A. S., and Sheoran V., 2006. Heavy metal removal mechanism of acid mine drainage in wetlands:
A critical review, Minerals Engineering
19: 105-116.18. Sridhara, C. N., C. T. Kamala, and S. R. D. Samuel, 2008. Assessing risk of heavy metals from consuming food grown on sewage irrigated soils and food chain transfer.
Ecotoxicology and Environmental Safety
69 (3): 513-524.19. Stottmeister, U., A. Wießner, P. Kuschk, U.
Kappelmeyer, M. Kästner, O. Bederski, R. A. Müller, and H. Moormann, 2003. Effects of plants and microorganisms in constructed wetlands for wastewater treatment.
Biotechnology Advances
22: 93-117.20. US EPA, 1989.
Risk Assessment Guidance for Superfund Volume I, Human Health Evaluation Manual (Part A)
, Washington, D.C. 20450.21. US EPA, Integrated Risk Information System (IRIS).
http://www.epa.gov/iris/ (accessed 28 May 2010) 22. WHO, 2008. Guidelines for Drinking-water Quality
(electronic resource): ISBN 978 92 4 154761 1, 3edn, Incorporating the first and second addenda, Volume 1. Recommendations. Geneva.
23. Yeh, T. Y., C. C. Chou, and C. T. Pan, 2009. Heavy metal removal within pilot-scale constructed wetlands receiving river water contaminated by confined swine operation.
Desalination
249: 386-373.24. Yoon, C. G., J. Y. Han, K. W. Jung, and H. H. Jang, 2006. Quantitative microbial risk assessment of wastewater reuse for irrigation in paddy field.