Dose Distribution and Image Quality in the Gantry Aperture for CT Examinations
― 전산화단층촬영 검사 시 Gantry Aperture 내의 선량분포와 영상의 질 ―
Department of Radiology, Ansan Hospital, Korea University Medical Center
1)Department of Radiologic Science, College of Health Science, Korea University
2)Department of Diagnostic Radiology, Guro Hospital, Korea University Medical Center
3)Department of Diagnostic Radiology, Anam Hospital, Korea University Medical Center
4)Department of. Radiologic Technology, Dongnam Health College
Pyong-Kon Cho·You-Hyun Kim1)·Jong-Hak Choi1)·Ki-Yeol Lee Hyung-Cheol Kim·Jang-Seob Kim·Dong-Chul Shin·Sung-Hyun Lee2)
Jun-Hyub Lee3)·Gwi-Soon Shin4)
― Abstract ―
The purpose of this study was to determine the dose distribution and image quality according to slice thickness and BC(beam collimation) in the gantry aperture. CT scans were performed with a 64-slice MDCT(Brilliance 64, Philips, Cleveland, USA) scanner. To determine the dose distribution according to BC, a ionization chamber was placed at isocenter and 5, 10, 15, 20, 25 and 30 cm positions from the isocenter in the 12, 3, 6 and 9 o’clock directions. The dose distribution for phantom scan was also measured using CT head and body dose phantom with five holes at the center of the phantom and the positions of the 12, 3, 6 and 9 o’clock directions. The image noise measurement for different BCs was performed using an AAPM CT phantom. Water-filled block of the phantom was moved by 5 cm or 10 cm to the 12 o’clock di- rection, and the image noise was measured at the center of the phantom, and the points of 12, 3, 6 and 9 o’clock direction respectively. Some points were placed beyond the scan field of view (SFOV), so that measurement was not possible at that points. The results are as follows:
The CTDIw showed a larger decrease as the source goes farther from the iso-center or the BC became wider. The CTDIw depends on the BC width more than the number of the channel of a detector array.
The value of CTDIW decreased with increasing BC, but the value decreased 16.6~31.9% in the head phan- tom scan in air scan and 51.0~64.5% in the body phantom scan. The value of the noise was 3.9~5.9 in the head and 5.3~7.4 in the body except for BC of 2×0.5 mm, regardless of the degree of deviation from the iso-center. When a subject was located within the SFOV, the position did not significantly affect image quality even if the subject was out of the center.
Key Words : Computed tomography, Beam collimation, Radiation dose, Image noise
*접수일(2009년 10월 27일), 심사일(2009년 11월 6일), 확정일(2009년 11월 26일) 책임저자 : 김유현, (136-703) 서울시 성북구 정릉동 산 1번지
고려대학교 보건과학대학 방사선학과 TEL : 02-940-9823, FAX : 02-917-9074 E-mail : [email protected]
Ⅰ. Introduction
Since the introduction of computed tomography (CT) in the 1970s, it has been recognized that the use of CT leads to high radiation exposure to patients. CT is responsible for the largest amount(35~40%) of the collective effective dose of X-rays to patients from diagnostic procedures1,2). The International Com‐
mission on Radiological Protection(ICRP) has recom‐
mended the establishment of diagnostic reference levels for radiological procedures3). The choice of the radiographic technique factors(kV and mAs) used in CT examinations has an important effect on CT image quality4–6). Changes in kVp(tube voltage) and mA(tube current) affect image contrast and image noise (mottle), thereby affecting the resultant of contrast- to-noise ratio(CNR). The size and composition of the object are also important factors that affect image quality in CT examinations. The improved diagnostic capabilities of multi–detector row CT (MDCT) tech‐
nology have resulted in the increasing number of CT examinations performed, which are responsible for a significant portion of patient radiation dose from all CT procedures7–9). The potential radiation risk from the incessant use of CT justifies that CT dose shall be kept as low as reasonably achievable. To fulfill this goal, it is important to understand the relationship between dose and image noise, as noise is a major factor in the determination of acceptable image quality and often dictates the dose for a particular CT protocol10). Such being the case, the dose distribution within the gantry aperture in CT is important. The purpose of this study was to determine the dose distribution and image noise according to beam collimation(BC) for the gantry aperture.
Ⅱ. Materials and Methods
CT scans were performed with a 64-slice MDCT (multi-detector computed tomography) scanner(Bril‐
liance 64, Philips, Cleveland, OH USA). Dose measurements were performed with a CT head(Model
76-414 ; Nuclear Associates, New York, NY USA) and a CT body dose phantom(Model 76-415 ; Nuclear Associates). In addition, an accurate ionization chamber(Model 10×9-3 CT, S/N 05-0077 Radcal, Monrovia, CA USA) and a radiation monitor controller (Model 9095, Radcal) were used. Image noise measure‐
ment was carried out by measuring standard deviations of HU(Hounsfield units) in a water-filled block of an AAPM(American Association of Physicists in Medicine) CT performance phantom(Model 610, CIRS, Norfolk, VA USA).
1. Dose distribution measurement in the gantry aperture
1) Air scan study
In order to determine the radiation dose in a specific location within the gantry aperture, a section of styrofoam was used in a size that could be inserted into the gantry aperture and the styrofoam was fixed in a location that would not affect the path where X-rays could be examined. In the styrofoam, holes were drilled at intervals of 5 cm from isocenter to 30 cm in the direction of the x-axis(3 and 9 o'clock direction) and y-axis (12 and 6 o'clock direction) to measure the radiation dose. After inserting a pencil type ionization chamber into the holes, the central part of the chamber to be scanned was positioned and the radiation dose was measured within the gantry aperture(Fig. 1). During the measurements, the scanning parameters were 120 kVp, 400 mAs, scan time of 1 s and a rotation time of 1 s for the head parts and 120 kVp, 230 mAs, scan time of 1 s and a rotation time of 1 s for the body parts, respectively. The measurements were prefor‐
med under the different BCs (beam collimations;
2×0.5 mm, 12×0.625 mm, 16×0.625 mm, 20×0.625 mm, 12×1.25 mm, 40×0.625 mm, 32×1.25 mm, 64×0.625 mm and 16×2.5 mm) provided by the equipment manufacturers. During the air scan study, the radiation dose was measured three times at each location and the mean values convert into the computed tomography dose index (CTDI) and weighted
computed tomography dose index (CTDIw).
2) Phantom scan study
To emulate subjects within the gantry aperture as compared to an air scan, the central part of the CT head and body dose phantom was placed on the isocenter respectively. The head and body dose phantom consisted of five holes with a diameter of 1.21 cm were placed at the center and the points of the 12, 3, 6 and 9 o'clock directions. In addition, an accurate ionization chamber and a radiation monitor controller were used, as shown in figure 2.
The changes in radiation dose were examined under the same experimental conditions as for the air scan study. The radiation doses were subsequently
measured. The phantom scans were repeated three times for the respective body parts to increase the reliability of the radiation dose. The mean values were converted into the CTDI and CTDIw.
3) Data analysis
The computed tomography dose index (CTDI) was calculated from the measured exposure as follows:
CTDI = fELC
nT (1)
where f is the conversion coefficient of the dosimetry phantom (0.893), E is the exposure (mR), L is the length of the ionization chamber (100 mm), C is the conversion coefficient of the ionization chamber (8.33×10⁻⁶mGy/mR), n is the number of slices and T is the slice thickness.
The weighted computed tomography dose index (CTDIw) was converted using the relationship:
CTDIW= 1
3 CTDIC+ 2
3 CTDIP (2)
where CTDIC is the CTDI at the center of the phantom and CTDIP is the CTDI at the periphery of the phantom.
The measurement data were analyzed by the use of SPSS (Statistical Package for the Social Sciences) version 12.0 K, with the descriptive statistics method (SPSS, Chicago, IL USA).
2. Image noise measurement
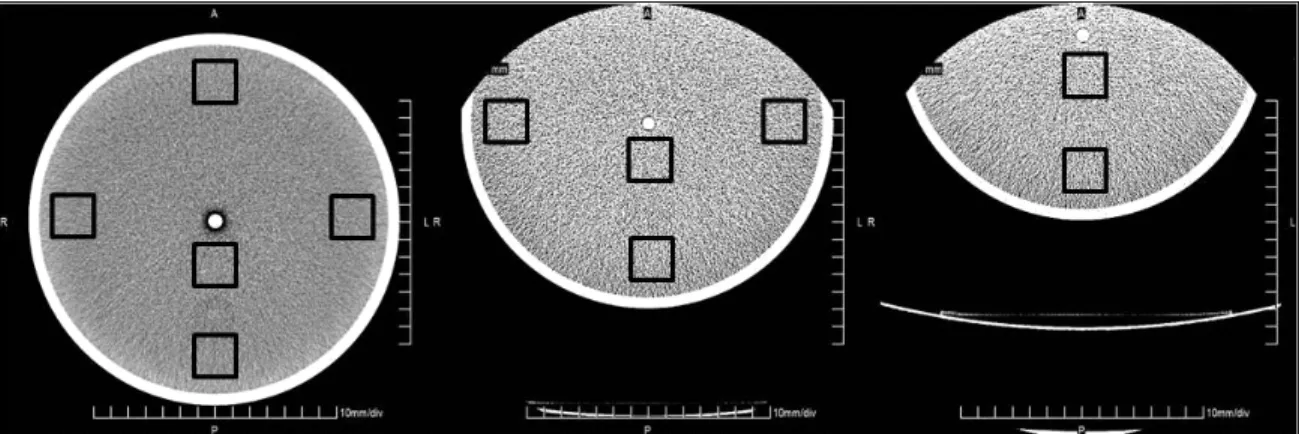
Quantitative image noise was measured using AAPM CT performance phantom with the water-filled block at the center and at the points in 12, 3, 6 and 9 o'clock direction. The phantom was moved by 5 cm or 10 cm to the 12 o'clock direction, and the image noise was measured at the center of the phantom, and the points of 12, 3, 6 and 9 o'clock direction respectively. In the case of 0 cm (isocenter), the noise could be measured at five all positions. In the case where the phantom was moved by 5 cm or 10 cm to the 12 o'clock direction, some points would be placed beyond the scan field of view (SFOV), so that measurement was not possible at that points (Fig. 3).
Figure 1. The dose measurement points in gantry aperture for air scan
Figure 2. Schematics of the CT head and body dose phantom, electrometer and ionization chamber
The images were acquired with the multi- detector row CT scanner with the scan parameters and beam collimations as described previously. Image noise was measured as the standard deviation of the atten‐
uation value by the water-filled block in the AAPM CT performance phantom. A square region of interest (ROI) was selected as 1,608 mm2 at the center, 12, 3, 6 and 9 o'clock positions respectively. The ROI was selected three times with a slightly different area on a respective part to increase the reliability of the noise measurements.
Ⅲ. Results
1. Dose distribution for air scan study In air scan study of the head and body, the CTDIw decreased as the BC became wider, but the CTDIw was
similar at the same BC(32×1.25 mm, 64×0.625 mm and 16×2.5 mm). In addition, the more far from the isocenter, the more CTDIw was reduced(Fig. 4).
2. Dose distribution for phantom scan study
In phantom scan study of the head and body, the CTDIw decreased as the BC became wider. The CTDIw was similar at the same BC (32×1.25 mm, 64×0.625 mm, 16×2.5 mm), as it was seen in the air scan study. In addition, the CTDIw in the head phantom scan study decreased between 16.6% and 31.9% as compared with that in air scan study, and the CTDIw in the body phantom scan study decreased between 51.0% and 64.5% as compared with that in air scan study (Fig. 5).
Figure 4. CTDIw with various beam collimation at each position for the air scan study(left; head parts, right; body parts) Figure 3. Image noise measurement points; isocenter (left), 5 cm (middle) and 10 cm (right) from the isocenter
3. Image noise evaluation
Noise depending on BC showed a large difference according to the measurement points. The noise values were between 3.9 and 53.9 in the head parts, and between 5.3 and 69.7 in body parts. However, when the phantom was moved 5 cm or 10 cm from isocenter towards the 12 o'clock direction at the same BC, the noise values at the center and around of the phantom showed a slight difference for the head parts and body parts respectively. In addition, at the same BC and at the same measuring point, noise values were lower at around the phantom than that at
the center of the phantom (Table 1).
Ⅳ. Discussion
As compared to a general X-ray examination, the dose distribution in a CT examination is different;
CT involves much higher patient radiation dose11,12). Even if the radiation dose in a CT examination is greater than that for other X-ray examinations, the application of CT has been expanded due to its accuracy and reliability to detect disease13). In
Table 1. Noise values at water-filled block in AAPM CT performance phantom at 0 cm, 5 cm and 10 cm from isocenter of gantry aperture in the 12 o'clock direction.
BC (mm)
Head parts Body parts
Peripheral (cm) Central (cm) Peripheral (cm) Central (cm)
0 5 10 0 5 10 0 5 10 0 5 10
2×0.5 43.7 43.8 44.4 52.0 53.9 51.1 56.3 58.1 59.8 68.5 69.7 65.5
12×0.625 4.7 4.6 4.7 5.7 5.3 5.5 6.1 6.1 6.5 7.3 7.3 7.2 20×0.625 4.6 4.7 4.8 5.4 5.6 5.7 6.1 6.2 6.1 7.3 7.4 7.0 16×0.625 4.1 4.0 4.1 4.7 4.7 4.7 5.4 5.8 5.3 6.4 6.3 6.2
12×1.25 4.0 4.1 4.2 4.8 4.6 4.7 5.3 5.5 5.6 6.4 6.4 6.3
40×0.625 4.0 4.1 4.3 4.8 4.8 4.7 5.3 5.5 5.6 6.3 6.5 6.2
32×1.25 3.9 4.1 4.3 4.7 4.8 4.7 5.3 5.4 5.5 6.4 6.2 6.2
64×0.625 4.0 4.2 4.3 4.9 4.8 4.8 5.5 5.3 5.7 6.4 6.5 6.2
16×2.5 4.1 4.1 4.2 4.9 4.9 4.8 5.4 5.5 5.8 6.3 6.2 6.4
Figure 5. Comparison of CTDIw in air and phantom scan study(left ; head parts, right ; body parts)
addition, interest in the effects of an accumulated radiation dose has influenced the determination of exposure factors in CT examination14). Due to the geometry and usage, CT is a unique modality and therefore has its own set of specific parameters for radiation dose2,15-20). General radiographic techniques are taken from one source position and the entrance skin dose is much larger than the exit skin dose, creating a large radiation dose gradient across the object. In contrast, CT scans with a full 360-degree rotation result in a radically symmetric radiation dose gradient within the object. The magnitude of the dose gradient (the size of the difference from the center to the periphery) is affected by several factors, including the size of the object, the X-ray beam spectrum and the attenuation of X-rays by the material or tissue. Especially, the differences in the amount of radiation from the center to the periphery are very much dependent on the size of the object, also indicating that the absolute values of the absorbed doses are size dependent21).
In this study, which determines the radiation dose and image quality within the gantry aperture of MDCT, the CTDIw in air scan study was decreased as it was farther from an isocenter for the same BC and was reduced as the BC widened(Fig. 4). Furthermore, when there was a subject (head phantom and body phantom) within the gantry aperture in phantom scan study, the CTDIw was likely to show the same tendency as air scan study(Fig. 5). It was found that the CTDIw value was more dependent on the BC width than the number of the channel of a detector array or a pixel size(Fig. 4, 5). For comparing image quality with the noise value, when a subject was positioned within the SFOV, the position did not significantly affect image quality even if the subject was out of the center (Table 1).
Ⅴ. Conclusions
The CTDIw depends regardless the object is placed in or out of the gantry aperture, the distance from
the isocenter and BC width, respectively. In addition, there is little impact on the image quality if an object positioned only within the SFOV of the aperture in a CT examination, even if the object deviates from the isocenter.
References
1. A. Kaul, B. Bauer, J. Bernhardt, D. Nosske, R.
Veit : Effective doses to members of the public from the diagnostic application of ionizing radia‐
tion in Germany. Eur Radiol, 7, 1127-1132, 1997 2. PC. Shrimpton, S. Edyvean : CT scanner dosi‐
metry. Br J Radiol, 71, 1-3, 1998
3. International Commission on Radiological Protec‐
tion : Recommendations of the International Commission on Radiological Protection. Oxford, United Kingdom, Pergamon Press, ICRP Publi‐
cation 60, 1991
4. JR. Mayo, TE. Hartman, KS Lee, SL. Primack, S.
Vedal, NL. Muller : CT of the chest : minimal tube current required for good image quality with the least radiation dose, AJR, Am. J. Roentgenol, 164, 603-607, 1995
5. SE. Kearney, P. Jones, K. Meakin, CJ. Garvey : CT scanning of the paranasal sinuses—the effect of reducing mAs, Br. J. Radiol, 70, 1071-1074, 1997
6. CH. McCollough : Optimization of multidetector array CT acquisition parameters for CT colonog- raphy, Abdom. Imaging, 27, 253-259, 2002 7. OW. Linton, FA. Mettler, Jr. : National conference
on dose reduction in CT, with an emphasis on pe- diatric patients. AJR Am J Roentgenol, 181, 321-329, 2003
8. SJ. Yates, LC. Pike, KE. Goldstone : Effect of multislice scanners on patient dose from routine CT examinations in East Anglia. Br J Radiol, 77, 472-478, 2004
9. G. Brix, HD. Nagel, G. Stamm et al. : Radiation exposure in multi-slice versus single-slice spiral CT : results of a nationwide survey. Eur Radiol,
13, 1979-1991, 2003
10. AN. Primak, CH. McCollough, MR. Bruesewitz, J.
Zhang, JG. Fletcher : Relationship between Noise, Dose, and Pitch in Cardiac Multi–Detector Row CT. Radigraphics, 26 (6), 1785-1794, 2006 11. SJ. Anthony, TB. Gary, GG. Robert : Specification,
Acceptance testing and quality control of diag‐
nostic X-ray imaging equipment. Medical physics monograph No. 20, 899-936, 1991
12. JE. Gray : Radiological protection issue in mam‐
mography and computed tomography proc. conf.
(Vienna : IAEA), 183-200, 2001
13. PK Cho, BK Seo, TK Choi et al. : The development of a diagnostic reference level on patient dose for CT examination in Korea. Radiation Protection Dosimetry, 129(4), 463-468, 2008
14. LM. Roberto, V. Peter, Raymond Mury, Paul P.
Schneeberger : Radiation exposure of patients who undergo CT of the trunk, Radiology. 195(2), 557- 562, 1995.
15. American Association of Physicists in Medicine Report no. 31 : Standardized methods for measur‐
ing diagnostic X-ray exposure, Available at www.aapm.org/pubs/reports, 1991
16. American Association of Physicists in Medicine
Report no 39, Specification and acceptance test‐
ing of computed tomography scanners, Available at www.aapm.org/pubs/reports, 1993
17. European Guidelines on Quality Criteria for Computed Tomography(EUR 16262 EN, May 1999).
Available at www.drs.dk/guidelines/ct/quality/
index.htm, 2002
18. LN. Rothenberg, KS. Pentlow : CT dosimetry and radiation safety. In : Goldman L. W., Fowlkes J.
B., eds. Syllubus, a categorical course in diag‐
nostic radiology physics-CT and US cross-sec‐
tional imaging. Oak Brook, Ill, Radiological Society of North America, 171-188, 2000
19. CM. McCollough, FE. Zink : Performance evalua‐
tion of CT systems. In : Goldman LW, Fowlkes JB, eds. Syllubus : a categorical course in diagnostic radiology physics-CT and US cross-sectional imaging. Oak Brook, Ill, Radiological Society of North America, 189-207, 2000
20. HD. Nagel, ed : Radiation exposure in computed tomography. 2nd ed. Hamburg, Germany, COCIR, Available at [email protected], 2000
21. F. Michale, McNitt-Gray : AAPM/RSNA Physics Tutorial for Residents, Topics in CT, Radio‐
graphics, 22, 1541-1553, 2002
y Abstract
전산화단층촬영 검사 시 Gantry Aperture 내의 선량분포와 영상의 질
조평곤·김유현1)·최종학1)·이기열·김형철·김장섭·신동철·이성현2)·이준협3)·신귀순4)
고려대학교 의료원 안산병원 영상의학과·1)고려대학교 보건과학대학 방사선과·
2)고려대학교 의료원 구로병원 영상의학과·3)고려대학교 의료원 안암병원 영상의학과·4)동남보건대학 방사선과
슬라이스 두께(slice thickness)와 선속시준(beam collimation, BC)의 변화에 따른 CT gantry aperture 내의 선 량 분포와 영상의 질을 알아보고자 하였다.
CT장치로는 64-slice MDCT 스캐너(Brilliance 64, Philips, Cleveland, USA)를 사용하였다.
피사체가 없는 경우(air scan)의 선량측정을 위해 CT용 전리함을 gantry aperture내의 회전중심점(isocenter)과 12시, 3시, 6시, 9시 방향에서 회전중심점으로부터 5 cm 간격으로 30 cm까지 BC를 변화시키면서 각각 측정 하 였다. 또한 5개의 구멍(팬텀의 중심과 12시, 3시, 6시, 9시 방향)으로 구성된 CT head and body dose phantom 을 gantry aperture 내에 위치시키고 각 지점에서 선량을 측정하였다.
Gantry aperture 내 피사체의 위치변화에 대한 영상의 노이즈를 비교하기 위해서 AAPM CT용 팬텀의 물통을 회전중심점과 12시 방향으로 5 cm와 10 cm 이동시킨 후 BC를 변화시키면서 스캔한 후 팬텀의 중심과 12시, 3 시, 6시, 9시 방향의 지점에서 노이즈를 측정하였다. 이 중에서 몇 군데의 위치는 영상 영역에서 벗어나서 측정 할 수가 없었다. 이때 노이즈 측정을 위해서 영상재구성의 슬라이스 두께는 5 mm로 하였다.
측정한 결과 다음과 같은 결론을 얻었다:
첫째, CTDIw는 회전중심점으로부터 멀어질수록, BC가 넓어질수록 감소하였다.
둘째, BC의 넓이가 비슷한 경우의 CTDIw는 거의 유사한 값을 보였다. 즉, CTDIw는 검출기 배열의 수나 화 소의 크기 보다는 전체적인 BC의 넓이에 의존하고 있음을 알 수 있었다.
셋째, air scan과 phantom scan 경우 모두에서 CTDIw는 BC가 증가될수록 감소하였다. 그러나 air scan의 경 우보다 head phantom scan 시 약 30%, body phantom scan 시 약 52% 정도 CTDIw의 값이 감소하였다.
넷째, BC와 팬텀의 위치 변화에 따른 노이즈 값은 2×0.5 mm의 BC을 제외하고는 head phantom scan한 경 우 3.9~5.9, body phantom scan한 경우 5.3~7.4로 나타나, BC와 팬텀의 위치변화에 따라서 큰 차이가 없었다.
따라서 피사체의 위치가 gantry aperture 내 SFOV(scan field of view)에 포함될 경우 회전중심점에 정확하게 위치시키지 않아도 영상의 질에는 많은 영향을 미치지 않는다는 것을 알 수 있었다.
중심단어 : 전산화단층촬영, 선속시준, 방사선량, 영상노이즈