FEM과 CFD 연동을 통한 스택 체결 시 압력에 의해 변형된 단위 전지 해석
유 빈⋅임기성⋅주현철
†
인하대학교 대학원 기계공학과
Analysis of the Deformed Unit Cell by Clamping Force Through the FEM and CFD Interaction
BIN YOO, KISUNG LIM, HYUNCHUL JU
†Department of Mechanical Engineering, Inha University Graduate School, 100 Inha-ro, Michuhol-gu, Incheon 22212, Korea
†
Corresponding author :
[email protected]Received
7 April, 2021Revised
18 August, 2021Accepted
19 August, 2021Abstract >> Polymer electrolyte membrane fuel cells (PEMFC) are currently being used in various transport applications such as drones, unmanned aerial ve- hicles, and automobiles. The power required is different according to the type of use, purpose, and the conditions adjusted using a cell stack. The fuel cell stack is compressed to reduce the size and prevent fuel leakage. The unit cells that make up the cell stack are subjected to compression by clamping force, which makes geometrical changes in the porous media and it impacts on cell performance. In this study, finite elements method (FEM) and computational flu- id dynamics (CFD) analysis for the deformed unit cell considering the effects of clamping force is performed. First, structural analysis using the FEM technique over the deformed gas diffusion layer (GDL) considering compression is carried out, and the resulting porosity changed in the GDL is calculated. The PEMFC model is then verified by a three-dimensional, two-phase fuel cell simulation applying the physical properties and geometry obtained before and after compression.
The detailed simulation results showed different concentration distributions of fuel between the original and deformed geometry, resulting in the difference in the distribution of current density is represented at compressed GDL region with low oxygen concentration.
Key words : Polymer electrolyte membrane fuel cell(고분자 전해질 연료전지, PEMFC),
Gas diffusion layer(기체확산층), Oxygen concentration(산소 농도), Current
density(전류 밀도), Intrusion(침투)
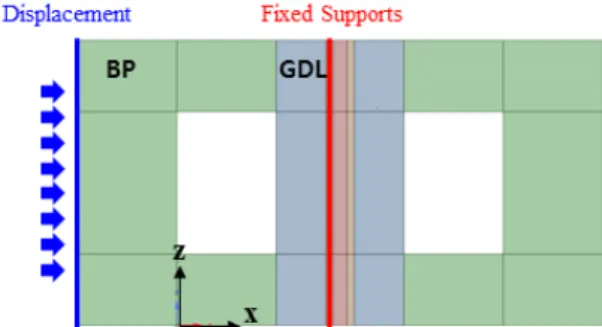
Fig. 1. Geometry of FEM simulation cases for obtaining de-
formed geometry and porosity1. 서 론
고분자 전해질 연료전지(polymer electrolyte mem- brane fuel cell, PEMFC)는 낮은 작동온도에서 높은 전력밀도를 유지하며 빠른 가동과 정지 능력을 보인 다 . 이러한 특징으로 인해서 수송용 연료전지 장비로 적합하다고 판단된다 1-13) .
PEMFC는 저온에서 작동되며 다공성막(porous media)으로 이루어진 구성으로 제작되기 때문에 전 기화학반응을 통해 생성된 물과 연료극 , 산소극에서 투입되는 수분이 액화하여 연료전지 내부에 분포하 기 때문에 이러한 형상을 다상 유동(two-phase)으로 표현하는 것이 중요하다 14) .
또한 PEMFC를 구성하는 부품 중 하나인 기체확 산층(gas diffusion layer, GDL)에 관한 연구도 활발 히 이루어지고 있다. GDL은 PEMFC 스택 내에서 membrane electrolyte assembly (MEA)를 지지하는 역할을 하며, 그 외에 전자의 전달, 반응 기체의 확산 및 전기화학반응에서 생성된 물과 열을 관리하는 등 의 다양한 역할을 하는 부품으로써 GDL에 대한 다 양한 관점에서 연구들이 진행되고 있다 15-17) .
수송용 연료전지를 운용하기 위해서는 여러 장의 단위전지를 체결하여 수십-수백 장의 스택을 쌓아서 운용하는 것이 필수적이다. 스택 체결 시 스택 기밀 성을 유지하기 위해서 연료전지에 체결압이 가해지 게 된다. 이러한 관점으로 FEM을 통해서 실제로 GDL 형상의 변형을 확인하며, 기체 확산과 물 관리 효율에서 중요 인자인 공극률의 변화를 연구하였다.
기존의 연구에서는 단상유동에서 FEM 변형을 통 한 연료전지 유동해석을 진행하고 연료전지의 성능 의 변화를 확인하였다 18) .
본 논문에서는 연료전지 스택 (fuel cell stack)에서 GDL이 체결압에 의해 형상의 변형과 공극률의 변화 로 인한 다상 유동에서 영향성을 확인하기 위해 GDL이 가스채널에 침범하는 형상을 채택해 다상 유 동 computational fluid dynamics (CFD) 연료전지 모 델을 적용하였다. GDL 두께 변화에 따른 가스분포 에 거동을 확인하고 연료전지 성능에 어떠한 영향을
주는지 이론적으로 분석하였다 .
2. 구조 해석
2.1 모델 시뮬레이션 및 가정
본 연구에서는 PEMFC 스택의 구조해석 시 변형 되는 GDL의 특성을 연구하기 위해 상용해석 프로그 램인 ANSYS-MECHANICAL 패키지(Canonsburg, PA, USA)를 사용하였다.
구조해석 모델에 적용된 가정은 다음과 같다 . 1) BP와 GDL 사이의 slip은 없다고 가정한다.
2) GDL의 변형률은 두께와 상관없이 20%로 고정 한다.
2.2 모델 형상과 경계 조건
본 연구의 구조해석에 대한 형상은 Fig. 1과 같다.
스택의 가스 흐름방향에 대한 수직 단면도이다 . 두께 방향으로 연료극 분리판 , 연료극 기체 확산층, MEA 로 적층되어 있으나 구조해석에 적용되는 형상은 실 제 변형을 가정한 bipolar plate (BP)와 GDL로 구성 하였다 .
Table 1은 전체적인 단위 전지 형상의 치수, Table 2
는 케이스별로 GDL 두께와 스택 체결에 의해 눌리
게 되는 변형률을 정리하였다. 변형이 이루어지는
case 1-1, 2-1, 3-1만 구조해석을 진행하였으며 case
Table 1. Cell dimensions
Descriptions Value
Cell length 100 mm
Gas channel height 1 mm
Channel rib width 1.0 (GC)/1.0 (BP) mm
Channel height 1 mm
Thickness of membrane 15 mm
Thickness of MPL 30 µm
Thickness of CL 7.5 µm
Active area 2 cm2 (2 mm×100 mm)
Table 2. GDL dimension for cases
Descriptions
Value
Case 1 Case 2 Case 3 Case 1-1 Case 2-1 Case 3-1
GDL thickness (µm) 100 200 300
100 200 300
Deformation ratio (%) 0
20
Table 3. GDL mechanical properties
Descriptions Value
Young's modulus of GDL, BP 6.3, 13,000 MPa Poisson's ratio of GDL, BP 0.09, 0.21
(a)
(b)
(c)
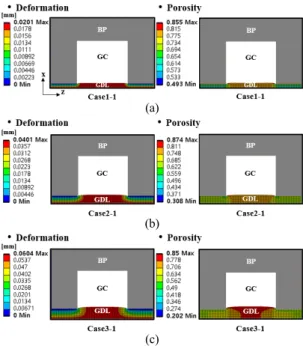
Fig. 2. Effects of compression at GDL structure: deformation
(mm) in the X-direction and porosity distributions for (a) case 1-1 (b) case 2-1 and (c) case 3-11, 2, 3은 FEM 해석을 적용하지 않은 기존의 모델이다.
Table 3에서는 구조해석에 사용되는 BP와 다공성 물체인 GDL의 물성치를 정리하였다 19) .
2.3 구조해석 결과
Fig. 2는 GDL의 변형과 공극률 변화를 보여주고 있다. GDL의 체적 변형률과 변형된 공극률은 다음 식을 통하여 계산된다 20) .
(1)
Case 1-1, 2-1, 3-1은 각각 GDL 두께만 다르며 같 은 변형률로 진행되었으며 구조해석 결과에서는 유 사함을 확인할 수 있다 . Case 1-1은 GDL과 BP가 접 촉되는 부분에서는 두께가 0.02 mm 감소하였고 case 2-1과 case 3-1 역시 늘어난 GDL의 두께 비율과 동 일한 0.04 mm와 0.06 mm가 변형되었다. 변형되는 Rib 부분의 GDL 공극률은 0.79에서 평균 0.633으로 감소하였다 . 그러나 가스 채널로 침투되는 GDL의 경우 공극률에 변화는 압축되는 부분에 비해 적으며 CFD 해석에서는 이를 기존과 같은 공극률로 가정하 였다. 이로 인해 스택 내의 가스의 유동은 형상과 공 극률의 변화로 기존의 채널형상과 다른 거동을 보이 게 될 것이며 GDL의 형상은 가스 채널로 침투된 형 태의 형상을 가지게 된다.
3. CFD 모델
3.1 모델 시뮬레이션
본 연구에서는 CFD는 ANSYS-FLUENT 19.2 전
Table 4. Transport properties in the electrolyte
Descriptions Value
Membrane water content(λ)
Water activity,
Electro-osmotic drag (EOD) coefficient of
water(
)
Proton
conductivity()
exp
Water diffusion coefficient
()
∙
for ≤
∙∙
for ≤
∙∙
for ≤
∙∙
for ≤
산유체 (CFD) 패키지를 사용하여 시뮬레이션을 수행 하였으며, CFD의 본 모델의 수렴조건은 해에 대한 정확도 향상을 위해 residual이 10 -6 이하가 되도록 반 복 계산을 하였다 . 또한, 열 유동의 특성에 대한 시뮬 레이션을 수행하기 위해 60만 개의 육면체(hexahedral) 형상의 격자가 단위 전지 형상에 적용되었다 .
3.2 모델 가정유동해석 모델에 적용된 가정은 다음과 같다 . 1) 압력 구배가 작기 때문에 비압축성 층류 유동 으 가정한다.
2) 전기화학반응은 공기극에서 느린 속도를 가지 므로 전기화학반응으로 발생하는 열은 공기극 촉매 층에서 지배적으로 발생한다 .
3) 중력의 영향은 무시한다.
4) 다공성 막의 공극률과 투과율은 등방성으로 가 정한다.
3.3 지배방정식
본 연구에서 사용된 모델은 질량(mass), 모멘텀 (momentum), 열에너지(thermal energy), 화학종 (speices), 전하(charge) 보존법칙에 의해 표현될 수 있다.
질량 보존식
∇ ∙
(2)
모멘텀 보존식
∇ ∙ ∇ ∇ ∙
(3)
화학종 보존 방정식
Flow channels and porous media
∇ ∙
∇ ∙
∇
∇ ∙
(4)
Water transport in the membrane
∇ ∙
∇
∇ ∙
∇ ∙
∇
(5) 에너지 보존식
∇ ∙
∇ ∙
∇ (6)
전하 보존식 Proton transport
∇ ∙
∇
(7)
Electron transport
∇ ∙
∇
(8)
HOR in anode CL
exp
(9) ORR in cathode CL
exp
exp
(10)
Two-phase mixture model을 설명하기 위한 Tables
4, 5는 각각 전해질에서의 물 수송 방정식과 mixture
Table 5. Expressions for two-phase mixture model.
Descriptions Value
Mixture
density
Gas mixture density
Mixture velocity
Mixture mass
fraction
Relative permeability
Kinematic
viscosity
Kinematic viscosity of gas
mixture
where
and
×
×
×
×
T in kelvin
Relative mobility
Diffusive mass flux
∇
Capillary pressure
Pc
cos
Leverett function
J(s)
i f
i f
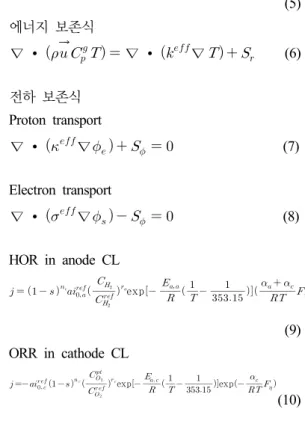
Fig. 3. Geometry and cell dimensions for simulation cases
Table 6. GDL dimension in Fig. 3
Descriptions
Value
Case 1 Case 2 Case 3 Case 1-1 Case 2-1 Case 3-1
A (µm) 0 0 0
20 40 60
B (µm) 100 200 300
80 160 240
Table 7. Operating conditions
Descriptions Value
Anode, cathode
Inlet temperature 80 ℃
Relative humidity 100 %
Operate pressure of
anode/cathode 1.0/1.0 atm
Anode stoichiometry 1.2
Cathode stoichiometry 2.0
Current density 1.0 A/cm2
모델에 관한 식에 대한 추가적인 물성치를 정의한다 .
3.4 모델 형상과 경계 조건본 연구의 CFD 모델의 형상은 FEM 시뮬레이션 결과에 의해 변형된 GDL을 적용한 Fig. 3과 같다. 스 택의 가스 흐름방향에 대한 수직 단면도이며 Fig. 3에
표시되어 있는 A는 구조해석을 통해 변형된 GDL이 가스 채널 영역으로 침투한 두께를 나타내고 , B는 BP에 의해 압축된 GDL의 두께를 나타낸다.
CFD 모델은 GDL의 두께를 기준으로 GDL이 압 축되지 않은 모델과 압축된 모델로 총 6가지의 case 로 구성하였으며 이에 대한 구분은 Table 6에 표시되 어 있다.
Table 7에서는 CFD 모델에서 적용한 작동 조건을
표기 하였으며 GDL 두께와 변형에 대해 효과를 확
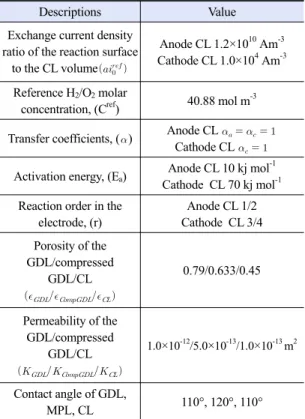
Table 8. CFD properties
Descriptions Value
Exchange current density ratio of the reaction surface
to the CL volume
Anode CL 1.2×10¹⁰ Am-3 Cathode CL 1.0×10⁴ Am-3
Reference H2/O2 molar
concentration, (Cref) 40.88 mol m-3
Transfer coefficients, (
) Anode CL
Cathode CL
Activation energy, (Ea) Anode CL 10 kj mol-1 Cathode CL 70 kj mol-1 Reaction order in the
electrode, (r)
Anode CL 1/2 Cathode CL 3/4 Porosity of the
GDL/compressed GDL/CL
0.79/0.633/0.45
Permeability of the GDL/compressed
GDL/CL
1.0×10⁻¹²/5.0×10-13/1.0×10-13 m2
Contact angle of GDL,
MPL, CL 110°, 120°, 110°
Fig. 4. Hydrogen concentration distribution contours over the
middle plane of the anode CL인하기 위해 작동 조건은 동일하게 적용하였다 . Table 8에서는 CFD 모델에 적용되는 물성치가 표 기되어 있으며 체결압에 의해서 압축된 GDL 영역을 추가적으로 고려하여 CFD 해석을 진행하였다.
일정한 조건의 전류밀도에서 연료극과 산소극의 유체 속도는 다음과 같은 식으로 정의된다.
Anode inlet velocity
(11)
Cathoode inlet velocity
(12)
동일한 전압이나 전류밀도에서 결과값을 확인하 기 위해서는 다음과 같은 조건이 해석 모델의 연료
극과 산소극 벽면에 정의된다 .
Anode side wall
(13) Cathode side wall
∇
for galvanostatic mode (14)
3.5 CFD 해석 결과앞서 언급되었듯이 열 유동해석에 적용된 형상은 Fig. 2와 동일한 형상이며 case 별로 Table 6에 기입 된 두께의 차이만을 가지고 있다.
Figs. 4, 5는 연료극의 수소와 공기극의 산소 농도 를 각각의 촉매층에서 나타낸다 . 먼저 Fig. 4는 case 별 수소 농도를 나타내는 그림이다 . Case 1, 2, 3 모 델의 경우 일반적인 parallel 채널의 수소 분포도를 보인다 . Case 1-1, 2-1, 3-1의 경우 체결압에 의해 Rib 부분과 channel 부분의 수소 농도의 차이는 일반적인 채널에 비해 더 많은 차이를 보이며 이는 GDL의 두 께 차이와 감소된 porosity로 인한 농도의 차이로 확 인하였다 .
수소 농도의 경우 높은 확산도로 인해서 체결압에
Fig. 6. Current density distribution contours in the membrane Fig. 5. Oxygen concentration distribution contours over the
middle plane of the cathode CL의한 영향성이 크게 나타나지 않는 반면에 산소 농 도는 Rib 부분에서 낮은 산소 농도를 확인할 수 있다.
Fig. 5의 나타나는 산소 농도 역시 Fig. 4의 수소 농도와 비슷하게 Rib 부분에서 농도가 낮아지는 경 향을 보인다. 앞서 언급되었듯이 산소의 경우 확산도 가 수소에 비해 낮기 때문에 Rib 부분에서 산소 고갈 을 보이며 이는 성능 저하에 큰 영향을 미치게 된다.
이를 통해 체결압에 의해 GDL이 변형되어 산소 전 달 능력에 큰 영향을 미치는 것을 확인하였다.
Fig. 6은 멤브레인의 전류밀도 분포이며, 모든 case
는 각각 동일한 작동 조건에서 시뮬레이션이 진행되 었다. 변형이 없는 case 1, 2, 3 모델의 경우 0.661 V, 0.665 V, 0.659 V로 전체적으로 고른 전류밀도 분포 를 보인다 . 구조해석을 통해 변형된 형상의 모델인 case 1-1, 2-1, 3-1은 0.647 V, 0.659 V, 0.498 V의 성 능을 보인다 . Case 3-1의 경우 낮은 산소 농도로 인 해 균일하지 못한 전류밀도 분포를 보이며 , 낮은 성 능을 확인할 수 있다 . 결과적으로 GDL 두께가 증가 할수록 고르지 못한 전류 밀도 분포를 보였다 . 또한 GDL 두께가 증가할수록 Rib 부분의 산소 전달이 부 족하여 발생되는 현상이 원인으로 판단된다 . GDL 두께가 증가되고 , 체결압에 의해 낮아진 porosity는 성능 저하의 큰 영향을 미치는 것을 확인할 수 있다 .
4. 결 론
본 연구에서는 PEMFC 스택 설계 시 발생하는 체 결압에 의해 변형된 연료전지를 FEM 및 CFD 시뮬 레이션으로 성능 및 농도분포를 확인하였다 .
1) 구조해석을 통해 PEMFC 스택 체결 시 GDL 이 변형되는 Rib 부분에서 공극률의 변화가 GDL 변 형의 지배적인 역할을 하는 것으로 확인하였다 . 가스 채널로 침투되는 GDL의 경우 압축되는 영역에 비해 서 비교적 공극률의 변화가 적은 것을 확인하였다 . 2) 연료극의 경우 변형된 형상과 공극률에 의한 수소 농도 분포를 case 별로 확인하였으나 수소의 높 은 확산도로 인해 변형된 형상과 공극률이 수소 농 도 분포에 영향성이 적은 것을 확인하였다 .
3) 산소극에서 산소 농도의 경우 낮은 확산도와 추가적으로 압축된 GDL로 낮아진 공극률로 인해 Rib 부분에서의 산소 농도 분포가 고갈되는 모습을 확인할 수 있었다.
결론적으로 체결압에 의해 변형되는 형상과 공극
률은 산소극의 산소 농도 구배의 지배적인 영향을
준다 . 산소의 불균일성과 성능 저하를 방지하기 위해
연료전지 스택 설계 시 산소 확산 관리는 중요한 인
자이므로 GDL이 체결압에 의해 변형되는 현상을 고
려한 스택 설계를 진행해야 한다.
References
1. A. Jo and H. Ju, “Numerical study on applicability of metal foam as flow distributor in polymer electrolyte fuel cells (PEFCs)”, Int. J. Hydrogen Energy, Vol. 43, No. 30, 2018, pp. 14012-14 026, doi: https://doi.org/10.1016/j.ijhydene.2018.01.003.
2. J. H. Baek, E. K. Lee, J. W. Lee, S. K. Lee, J. S. Moon, K. H.
Kim, H. W. Park, D. C. Kim, and J. H. Lee, “A study on safety performance evaluation of NG blower for 5 kW class stationary fuel cell systems”, Trans Korean Hydrogen New Energy Soc, Vol. 28, No. 6, 2017, pp. 675-682, doi:
https://doi.org/10.7316/KHNES.2017.28.6.675.
3. K. Palaniswamy, M. Marappan, and V. Rajendran Jothi,
“Influence of porous carbon inserts on scaling up studies for performance enhancement on PEMFC”, Int. J.
Hydrogen Energy, Vol. 41, No. 4, 2016, pp. 2867-2874, doi:
https://doi.org/10.1016/j.ijhydene.2015.10.148.
4. G. B. Joung, “Bidirectional power transmission fuel cell system for notebook battery”, Trans Korean Hydrogen New Energy Soc, Vol. 28, No. 3, 2017, pp. 273-278, doi:
https://doi.org/10.7316/KHNES.2017.28.3.273.
5. M. H. Song and K. Y. Kim, “Numerical study on flow dis- tribution in PEMFC with metal foam bipolar plate”, Trans Korean Hydrogen New Energy Soc, Vol. 27, No. 1, 2016, pp.
29-35, doi: https://doi.org/10.7316/KHNES.2016.27.1.029.
6. B. Wang, K. Wu, F. Xi, J. Xuan, X. Xie, X. Wang, and K. Jiao,
“Numerical analysis of operating conditions effects on PEMFC with anode recirculation”, Energy, Vol. 173, 2019, pp. 844-856, doi: https://doi.org/10.1016/j.energy.2019.02.115.
7. J. S. Lee, S. G. Kim, and Y. J. Sohn, “An experimental study on the natural convection heat transfer of air-cooling PEM FC in a enclosure”, Trans Korean Hydrogen New Energy Soc, Vol. 27, No. 1, 2016, pp. 42-48, doi:
https://doi.org/10.7316/KHNES.2016.27.1.042.
8. D. K. Ahn, H. J. Lee, H. S. Shim, and D. J. Kim, “Optimization of condensate water drain logic depending on the characteristics of drain valve in FPS of fuel cell vehicle and development of anode water management strategy to achieve high fuel efficiency and operational stability”, Trans Korean Hydrogen New Energy Soc, Vol. 27, No. 2, 2016, pp. 155-162, doi:
https://doi.org/10.7316/KHNES.2016.27.2.155.
9. E. K. Lee, J. H. Baek, J. W. Lee, S. K. Lee, and Y. J. Lee, “A study on hydrogen impurity effect in anode of proton exchange membrane fuel cell on various concentration of CO and H2S”, Trans Korean Hydrogen New Energy Soc, Vol.
27, No. 6, 2016, pp. 670-676, doi: https://doi.org/10.7316/
KHNES.2016.27.6.670.
10. B. G. Lee and Y. J. Sohn, “Experimental analysis for opti- mization of PEM fuel cell dead-end operation”, Trans Korean Hydrogen New Energy Soc, Vol. 26, No. 2, 2015, pp.
136-147, doi: https://doi.org/10.7316/KHNES.2015.26.2.136.
11. M. H. Lee, J. S. Choi, and B. W. Roh, “Synthesis and dura- bility of carbon-supported catalysts for PEMFC”, Trans Korean Hydrogen New Energy Soc, Vol. 26, No. 4, 2015, pp.
318-323, doi: https://doi.org/10.7316/KHNES.2015.26.4.318.
12. Y. H. Lee, D. J. Oh, U. S. Jeon, and J. H. Lee, “Development of an accelerated durability test mode for fuel cell”, Trans Korean Hydrogen New Energy Soc, Vol. 26, No. 5, 2015, pp.
493-498, doi: https://doi.org/10.7316/KHNES.2015.26.5.493.
13. Y. D. Lim, S. H. Lee, H. H. Jang, J. H. Yoo, J. S. Ha, H. C. Ju, T. W. Hong, and W. Kim, “New multi-phenylene polymer electrolyte containing hexabenzocoronene interior for PEMFC”, Int. J. Hydrogen Energy, Vol. 40, No. 2, 2015, pp.
1316-1323, doi: https://doi.org/10.1016/j.ijhydene.2014.09.143.
14. A. Jo, S. Ahn, K. Oh, W. Kim, and H. Ju, “Effects of metal foam properties on flow and water distribution in polymer electrolyte fuel cells (PEFCs)”, Int. J. Hydrogen Energy, Vol.
43, No. 30, 2018, pp. 14034-14046, doi: https://doi.org/10.
1016/j.ijhydene.2018.01.134.
15. Y. Lee, “Variation of porosity and gas permeability of gas diffusion layers under compression”, Trans. of the Korean Society of Mechanical Engineers, Vol. 37, No. 8, 2013, pp.
767-773, doi: https://doi.org/10.3795/KSME-B.2013.37.8.767.
16. J. Y. Yoon and J. S. Park, “Structural analysis of gasket and GDL for enhanced performance of PEMFC”, Journal of the Korean Society for Aeronautical & Space Sciences, Vol. 36, No. 7, 2008, pp. 642-650. Retrieved from http://www.dbpia.
co.kr/journal/articleDetail?nodeId=NODE01100765.
17. H. S. Jeong, J. I. Kim, S. H. Lee, C. H. Lim, B. K. Ahn, and C. J. Kim, “Analysis of mass transport in PEMFC GDL”, Trans. of the Korean Society of Mechanical Engineers, Vol.
36, No. 10, 2012, pp. 979-988. Retrieved from http://www.
dbpia.co.kr/journal/articleDetail?nodeId=NODE01970256.
18. P. Chippar, K. Oh, D. Kim, T. W. Hong, W. Kim, and H. Ju,
“Coupled mechanical stress and multi-dimensional CFD analysis for high temperature proton exchange membrane fuel cells (HT-PEMFCs)”, Int. J. Hydrogen Energy, Vol. 38, No. 18, 2013, pp. 7715-7724, doi: https://doi.org/10.1016/
j.ijhydene.2012.07.122.
19. P. Chippar, K. Oh, K. Kang, and H. Ju “A num erical investigation of the effects of GDL compression and intrusion in polymer electrolyte fuel cells (PEFCs)”, Int. J. Hydrogen Energy, Vol, 37, No, 7, 2012, pp. 6326-6338, doi: https://doi.
org/10.1016/j.ijhydene.2011.04.154.
20. K. Oh, P. Chippar, and H. Ju, “Numerical study of thermal stresses in high-temperature proton exchange membrane fuel cell (HT-PEMFC)”, Int. J. Hydrogen Energy, Vol. 39, No. 6, 2014, pp. 2785-2794, doi: https://doi.org/10.1016/