The Relationship between FDI and Economic Growth:
Kazakhstan Case
Byeong-Yun Chang1†・Assel Kassymbekova2
해외직접 투자와 경제성장의 상호관계에 관한 연구: 카자흐스탄 사례연구
장병윤 ・Assel Kassymbekova
ABSTRACT
In this paper, we study the relationship between FDI(Foreign Direct Investment) and economic growth in Kazakhstan. For this research, we, first, investigate the factors that affect FDI infow to Kazakhstan since its independence and determine the degree of their influence. Second, we study the impact of FDI per capita on GDP per capita. To achieve these goals, an empirical study is conducted with 18 years data from 1992 to 2009 from World Bank Database. Data are analyzed using multiple linear regression, time series analysis and Granger causality test.
The results show that the determinant of FDI is GDP and economic freedom index in Kazakhstan. Economic growth is affected by FDI, too. Specially, FDI is positively related to GDP and economic freedom index. FDI per capita's impact on GDP per capita is 30.4 dollars increase in GDP per capita by one dollar increase in FDI per capital inflow.
The results provides useful information for policy makers to improve obtaining large amount of investments and facilitate economic growth.
Key words : FDI, Economic Growth, Regression, Granger Causality Test
요 약
본 논문은 카자흐스탄의 해외직접투자와 경제성장에 관한 연관관계를 연구한다. 이 연구를 위하여 저자들은 먼서 카자흐스 탄의 독립이후로 해외직접투자에 영향을 미친 요인들을 조사하고 그들의 영향정도를 파악한다. 다음으로 일인당 GDP대한 일인당 해외직접투자의 영향을 연구한다. 이러한 연구목적을 달성하기 위하여 1992년부터 2009년 사이의 자료를 World Bank Database에서 수집하여 분석하였다. 자료분석은 중회귀분석, 시계열분석 및 Granger Causality Test를 주로 사용하였다. 연구 결과에 의하면 해외직접투자에 영향을 미치는 요소는 GDP 와 economic freedom index로 나타났으며, 경제성장 또한 해외직 접 투자에 영향을 받는 것으로 나타났다. 특별히, 해외직접투자는 GDP 및 economic freedom index와 양의 상관관계가 있었다.
일인당 GDP에 대한 일인당 해외직접투자의 영향은 일인당 해외직접투자 1달러 증가시 일인당 GDP 30.4달러가 증가하는 것 으로 나타났다. 본 연구의 결과는 정책결정자들로 하여금 해외투자를 유치하고 경제성장을 촉진하는 정책결정에 유용한 정보를 제공할 것이다.
주요어 : 해외직접투자, 경제성장, 회귀분석, Granger Causality Test
*본 연구는 2012학년도 아주대학교 일반연구비 지원에 의하여 연구되었음
접수일(2012년 2월 14일), 심사일(1차 : 2012년 3월 21일), 게재 확정일(2012년 3월 22일)
1)아주대학교 경영학부
2)Ministry of Foreign Affairs of the Republic of Kazakhstan 주 저 자: 장병윤
교신저자: 장병윤 E-mail; [email protected]
1. Introduction
All developing countries are facing the dilemma of beating the competition to obtain large amounts of invest- ments. Finding an answer to this dilemma will solve many problems of a country’s development and simultaneously neutralize the possible negative consequences of the unpredictable behavior of foreign investors.
Despite the existence of a large number of theories and concepts of Foreign Direct Investment (FDI), govern- ments of developing countries still do not possess reliable tools and mechanisms that will allow them to predict behavior of investors and implement an effective macro- economic policy on dynamics of movement of capital and technology. To help to overcome this issue, we tried to answer the following questions in this research:
(1) Are there factors that allow to attract (or detract) more foreign investments in the country?
(2) How these factors in (1) affect the amount of inflow of investments?
(3) Is economic growth of a developing country affected by FDI?
(4) What is the degree of FDI impact on the economic growth of a developing country?
To answer the above questions, we study the relation- ship between FDI and economic growth in a country.
First, we investigate the factors that affect FDI inflow to a country and determine the degree of their influence.
Second, we study the impact of FDI per capita on GDP per capita.
As for the methodology multiple linear regression, time series analysis, Granger causality test was conducted.
The results show that FDI is positively affected by GDP and economic freedom index. GDP per capita is also positively affected by FDI per capita in some degree.
The result of this research could be used as a guideline to construct developing countries’ policies to obtain large amounts of investments and facilitate economic growth.
In the following section, the literature related to the relationship between FDI and economic growth is reviewed. In Section 3, we explore Kazakhstan’s economic environment as a case. We then investigate the factors that affect FDI inflow to the country and determine the degree of their influence. In addition, we study the impact of FDI per capita on GDP per capita with Granger causality test and linear regression. In Section 4, we finally conclude this research with summary and future research.
2. Literature Review
2.1 The determinants of FDI inflows: theories and previous studies
The traditional model of FDI determinants are known as the eclectic OLI (Ownership - O, Location - L, Internalization - I) paradigm (Dunning and Lundan, 2008). Within this framework FDI appears when three conditions are fulfilled: 1) a firm has some specific ownership advantage over local firms, which makes it more competitive; 2) there is a location advantage of producing in the foreign country rather than at home for export; and 3) there has to be internalization advantage.
Campos and Kinoshita (2003) studied determinants of FDI in transition economies in Eastern European and Baltic, as well as CIS (Commonwealth of Independent States) countries. They found that for former states institutions, agglomeration economies and the extent of economic reforms are the main determinants while, for the CIS countries, abundant natural resources and economic reforms are main drivers of FDI inflows.
Their main finding is that the most important determinants of FDI location for CIS countries are:
- abundance of natural resources
- telephone lines (this problem is not relevant nowadays) - trade dependence
- external liberalization - rule of law
- bureaucracy - restriction on FDI
Among the recent studies on determinants of FDI, Mottaleb (2007) conducted research based on data for 60 developing countries from Asia, Africa, and Latin America. He postulated some hypotheses to prove the relationship between determinants related to developing economies and FDI inflows. His findings support the hypotheses that market size and market potentials, as well as better infrastructural facilities positively affect FDI inflow. On the other hand, unfriendly business environment and high business start-up costs discourage FDI inflow in the developing countries.
Table1. GDP and FDI inflows in Kazakhstan, 1990-20091).
Total population,
million people
GDP, million
USD
GDP per capita,
USD
GDP growth, annual %
FDI inflows, million USD 1990 16.348 26932.729 1647.463 -4.6
1991 16.451 24881.136 1512.485 -11
1992 16.439 24906.940 1515.104 -5.3 100.000 1993 16.330 23409.027 1433.462 -9.2 1271.400 1994 16.095 21250.839 1320.322 -12.6 659.700 1995 15.816 20374.307 1288.239 -8.2 964.200 1996 15.578 21035.358 1350.334 0.5 1137.000 1997 15.334 22165.932 1445.569 1.7 1321.400 1998 15.071 22135.245 1468.702 -1.9 1151.400 1999 14.928 16870.817 1130.114 2.7 1587.000 2000 14.884 18291.991 1229.003 9.8 1282.524 2001 14.858 22152.689 1490.930 13.5 2834.999 2002 14.859 24636.599 1658.037 9.8 2590.218 2003 14.909 30833.693 2068.126 9.3 2092.029 2004 15.013 43151.647 2874.285 9.6 4157.208 2005 15.147 57123.672 3771.286 9.7 1971.218 2006 15.308 81003.865 5291.569 10.7 6278.168 2007 15.484 104853.000 6771.643 8.9 11119.037 2008 15.674 133442.000 8513.562 3.3 15779.772 2009 15.888 109155.000 6870.259 1.2 12600.760 1)Data from the World Bank Database
2.2 The impact of FDI on economic growth Theoretically, a positive view has been bolstered by recent developments in growth theory, which emphasize the importance of technology improvements, productivity and efficiency in stimulating economic growth. Within this framework FDI’s contribution to growth is obvious through technology transfer (Lim, 2001).
Neoclassical models of economic growth suggest that diminishing return on capital leads to a level effect on economic growth, thus investment may affect economic development only in short-term period. The long-term economic growth is possible only due to technological progress, which is considered to be independent from investment activities (Ledyaeva and Linden, 2006).
Endogenous growth theory, initiated by Romer (1986), gives a basis to study the relationship between FDI and growth, taking into consideration the characteristics of FDI. In his studies it is argued that the most significant effect on country’s economy comes from spillovers of technology. Foreign firms bring new technologies in the host country, whereby domestic firms might adopt those advanced technologies to improve their productivity. Jones (1998) also believes that endogenous growth theory gave a rise to explanation of positive role of FDI in economic development through the existence of positive externalities (FDI spillovers).
However, other studies suggest that positive effect on growth rates may be conditional in developing countries due to narrow specialization and limited technological spillover. There also some empirical studies that do not comply with theories, giving conflicting evidence due to conditionality on host country’s characteristics. Borensztein et al. (1998), for example, argued that the level or quality of human capital is a factor to be included when analyzing economic growth.
There is yet no consensus on the relationship between FDI and economic growth, thus the related literature gives conflicting evidence regarding this issue.
3. Methodology, Models, Empirical and Simulation Results
3.1 Kazakhstan as a case
FDI plays a substantial role in the process of transforming
the former Soviet Union states into the market economy system. Moreover, nowadays a quite fierce competition can be observed for attracting investments among developing countries. In this context, a defining and proper regulation of the determinants of FDI enact crucially in building a successful investment policy to enhance the economy.
We select Kazakhstan for analyzing the relationship between FDI and economic growth since it is a good example of developing CIS countries trying to attract FDI since its independence.
From the time of gaining independence in 1991, Kazakhstan began a series of broad-based reforms in an effort to move from a centrally planned to a market economy.
In Table 1, during the 1990-1995 periods Kazakhstan faced economic downturn. In the latter half of the 1990s, despite of some economic growth, the economy was negatively impacted by Asian and Russian crises and fluctuations of commodities’ prices, thus the volume of GDP in 2000 amounted to only 67.9% of the GDP volume in 1990.
However, Kazakhstan has achieved considerable progress in transforming its economic system over the last decade, due to more favorable external environment and reasonable macroeconomic policy.
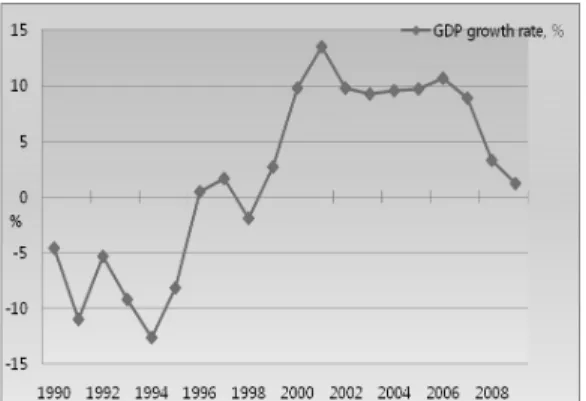
Fig. 1. GDP growth rate (%)
Fig. 2. FDI inflows, million USD In the period since 1999 there was a significant recovery
of the economy, driven by constant growth in the oil and gas sector and followed by spillover effects. Increased prices on world markets for Kazakhstan’s leading exports (oil, metal and grain) and rising of oil production supported by the official opening of the Caspian Pipeline Consortium in 2001, as well as stable FDI inflows, rocketed GDP growth up to 13.5% in 2001.
Since then, the growth rates of the country’s economy remained impressively high for almost 6 years. However, as we can see in Figure 1, the growth rate falls sharply after 2007. Due to high dependence on external markets, the economic crisis in Kazakhstan began immediately after the start of the U.S. mortgage crisis, that is, the autumn of 2007. As shown in the figure below, after average growth rate of 10% during 2000-2007, GDP growth in 2008 amounted to 3.3%, while in 2009 only to 1.2%. Nevertheless, Kazakhstan is one of the few countries in the world which maintained positive growth rates during the crisis.
3.2 Variables, models, empirical and simulation results of FDI determinants analysis Kazakhstan has attracted significant FDI since independence. By July 2009, foreign investors had invested a total of 97.6 billion USD in Kazakhstan, primarily in the oil and gas sector. Even during economic crisis in 2007-2008, there were still significant FDI inflows in country’s economy in Figure 2.
For FDI determinant analysis, we choose a following model and variables.
FDI = + + GDP +
Natural resources +
Fuel export +
Gross capital formation +
Current account balance +
Economic freedom index +
Corruption perception Index +
Inflation rate + (1)
where,
Dependant variable: FDI is FDI Inflows in million USD, ε - is an error term, which is independent, identically and normally distributed, with mean equal to 0 and constant standard deviation.
Independent variables: GDP – Gross Domestic Product, which serves as a measure of country’s market size, and explains potential economies of scale production.
Natural resources – FDI in CIS countries were mostly in resource extraction and energy transportation infrastructure (Campos and Kinoshita, 2003). As proxy measure for this variable the oil supply data in thousands barrels per day is taken.
Fuel export –Fuel export is explained as a percent of merchandise export, where fuels comprise SITC1) Section3 (mineralfuels).
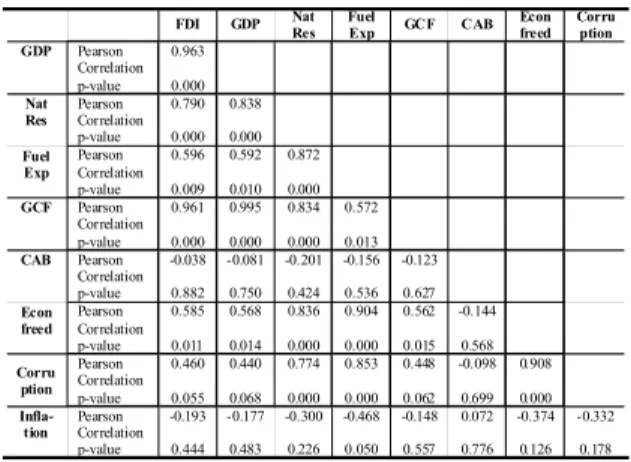
Table 2. Correlation matrix for FDI model
FDI GDP Nat
Res Fuel
Exp GCF CAB Econ freed Corru ption GDP Pearson
Correlation p-value
0.963 0.000 Nat
Res Pearson Correlation p-value
0.790 0.000
0.838 0.000 Fuel
Exp Pearson Correlation p-value
0.596 0.009
0.592 0.010
0.872 0.000 GCF Pearson
Correlation p-value
0.961 0.000
0.995 0.000
0.834 0.000
0.572 0.013 CAB Pearson
Correlation p-value
-0.038 0.882
-0.081 0.750
-0.201 0.424
-0.156 0.536
-0.123 0.627 Econ
freed Pearson Correlation p-value
0.585 0.011
0.568 0.014
0.836 0.000
0.904 0.000
0.562 0.015
-0.144 0.568 Corru
ption Pearson Correlation p-value
0.460 0.055
0.440 0.068
0.774 0.000
0.853 0.000
0.448 0.062
-0.098 0.699
0.908 0.000 Infla-
tion Pearson Correlation p-value
-0.193 0.444
-0.177 0.483
-0.300 0.226
-0.468 0.050
-0.148 0.557
0.072 0.776
-0.374 0.126
-0.332 0.178
Table 3. Multiple linear regression outcomes
Coefficient Standarderror t-stat p-value
(constant) -1642 5456.2 -3.01 0.009
CDP 0.116 0.01029 11.25 0.000
Ecfreed 28.54 14.45 0.67 0.512
* Adjusted R-squared=92.1%.
Table 4. ANOVA Results
Model
S.S.
(Sum of Squares)
D.F.
(Degrees of Freedom)
Mean
Square F-statistic p-value
Regression 333913648 2 166956824 100.15 0.000 Residual 25006737 15 1667116
Total 358920386 17
Gross capital formation - Gross capital formation includes land improvements (fences, ditches, drains, and so on), plant, machinery, and equipment purchases, and the construction of roads, railways, and the like, including schools, offices, hospitals, private residential dwellings, and commercial and industrial buildings, as well as net changes in the level of inventory. Taking this into account, gross fixed capital formation is taken as proxy for infrastructure development of the country (Haile and Aseffa, 2006).
Current account balance - The current account balance of the host country is an indicator of the strength of its currency.
Economic freedom index - is a series of 10 economic measurements created by Heritage Foundation and Wall Street Journal. Its stated objective is to measure the degree of economic freedom in the world's nations.
Corruption perceptions index – measures the perceived level of public sector corruption.
Inflation rate - high rate of inflation indicates internal economic instability and weakness of monetary policy of the government. Multinational companies may avoid investing in countries with high inflation rates because of uncertainty of product and input pricing.
Putting the 18 years data from 1992 to 2009 from World Bank Database to model (1), Table 2 of correlation matrix is obtained.
Table 2 shows that current account balance, corruption, inflation have no linear relationship with dependent variable at 5% significance level. However, it shows that GDP, natural resources, fuel export, gross capital formation, economic freedom index have significant linear correlation with dependent variable at 5% signifi- cance level. When multiple linear regression is considered for modeling, multicollinearity problem should be considered.
In this case, GDP, natural resources, fuel export, and gross capital formation are linearly correlated each other at 1% significance level. Since the focus of the research is on relationship between FDI and economic growth, GDP and economic freedom index are selected as candidate independent variables.
1) Standard International Trade Classification
As the next step we test the following model with the same data as Table 2.
FDI = + GDP +
economic freedom + (2)
The fitted model, regression results and ANOVA results are in the model (3) and Tables 3 and 4, respecti- vely.
FDI = -1642+ 0.116*GDP +
9.7*Economic freedom (3) Though the fitted model (3) is significant at 1%
significance level from Table 4, Table 3 shows that
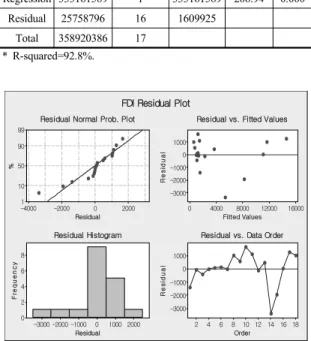
Table 5. ANOVA Results
Model S.S. D.F. Mean
Square F-statistic p-value Regression 333161589 1 333161589 206.94 0.000
Residual 25758796 16 1609925 Total 358920386 17
* R-squared=92.8%.
Residual
%
2000 0 -2000 -4000 99 90 50
10 1
Fitted Values
Residual
16000 12000 8000 4000 0 1000
0 -1000 -2000 -3000
Residual
Frequency
2000 1000 0 -1000 -2000 -3000 8 6 4 2 0
Order
Residual
18 16 14 12 10 8 6 4 2 1000
0 -1000 -2000 -3000
Residual Normal Prob. Plot Residual vs. Fitted Values
Residual Histogram Residual vs. Data Order
FDI Residual Plot
Fig. 3. FDI residual plot
Table 6. Lag selection results
lag D.F. p-value AIC HQIC SBIC
1 4 0.000 28.378 28.3244 28.6387
2 4 0.123 28.4349 28.3456 28.8695
3 4 0.019 28.1411 28.0161 28.7495
4 4 0.000 27.1048* 26.944* 27.8871*
5 4 0.157 27.2106 27.0141 28.1667
only GDP is a statistically significant variable to explain FDI. Therefore the following fitted model and ANOVA results can be obtained with FDI dependent and GDP independent variables.
FDI = -1470+ 0.1197*GDP (4)
Since Table 5 shows that the fitted model (4) is statistically significant and Figure 4 says that the model assumption is satisfied, GDP’s impact on FDI is 119,700 dollars increase in FDI inflow by one million dollar increase in GDP.
In Figure 3, by Kolmogorov-Smirnov test, normality assumption is statistically satisfied at 1% significance level.
With the constructed model (4), we can simulate FDI with prediction interval and confidence interval (Kutner et al., 2005). If the next year’s GDP is estimated as 100,000 million dollars, the 95% prediction interval of FDI is (7,565.06, 13,431.3) million dollars and confidence
interval (9328.48, 11667.9) million dollars.
3.3 Variables, models and empirical results of FDI impact on economic growth To study FDI impact on economic growth Grager causality test is chosen as follows.
1 2
0
1 1
k k
t i t i i t i t
i i
Y α αY− β X − ε
= =
= +
∑
+∑
+ (5)3 4
0
1 1
k k
t i t i i t i t
i i
X γ γ Y− δ X − ϕ
= =
= +
∑
+∑
+ (6)In eq. (5) and (6), X denotes an indicator of economic growth, Y denotes the FDI, subscripts t and t-i denote the current and lagged values, respectively, and and are the error terms. In our model GDP per capita in USD is chosen as X and FDI per capita in USD as Y.
Granger-causality test examines whether lagged values of one variable help to predict another variable (Greene, 2012; Wooldridge, 2009). However, before applying the technique, optimal time lag has to be determined.
Three commonly used techniques to determine optimal time lag are Schwarz’s Bayesian information criterion (SBIC), Akaike’s information criterion (AIC), and Hannan and Quinn information criterion (HQIC) (Torres- Reyna, 2009). STATA statistical package was employed to lag selection procedure.
As data size is limited to 18 years, five years lags are tested and Table 6 shows the results. Table 6 indicates that all information criteria are suggesting four-year lag as optimal.
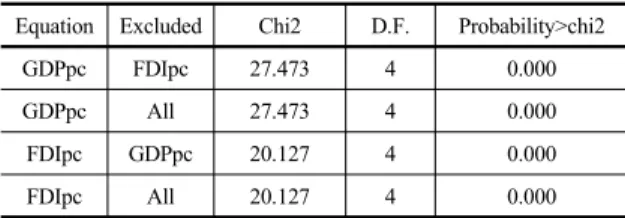
Knowing the optimal lag, Granger-causality test is
Table 7. Granger causality wald test results (4 year lag) Equation Excluded Chi2 D.F. Probability>chi2
GDPpc FDIpc 27.473 4 0.000
GDPpc All 27.473 4 0.000
FDIpc GDPpc 20.127 4 0.000
FDIpc All 20.127 4 0.000
Table 8. ANOVA results
Model S.S. D.F. Mean
Square F-statistic p-value Regression 57633811 1 57633811 26.82 0.000
Residual 25789481 12 2149123 Total 83423292 13
* R-squared=69.1%.
Residual
%
4000 2000 0 -2000 -4000 99 90 50
10 1
Fitted Values
Residual
8000 6000 4000 2000 0 2000
0
-2000
Residual
Frequency
3000 2000 1000 0 -1000 -2000 4 3 2 1
0
Order
Residual
14 13 12 11 10 9 8 7 6 5 4 3 2 1 2000
0
-2000
Residual Normal Prob. Plot Residual vs. Fitted Values
잔차 히스토그램 Residual vs. Data Order
GDPpc Residual Plot
Fig. 4. GDPpc residual plot
applied to see the direction of relationship between GDPpc and FDIpc. Table 7 shows that putting four-year lag, the null hypothesis that “var1 does not Granger-cause var2” is rejected in both cases, which means that bilateral causality exists between GDPpc and FDIpc. (Torres- Reyna, 2009).
Since the focus in this subsection is on FDI impact on economic growth, the following fitted four years lag model (7) is considered.
GDPpc= -31 + 30.4*FDIpc (-4) (7) Table 8 shows the ANOVA results of the fitted model (7) and indicates that the model is significant.
To check the assumption, Figure 4 is created and shows that the violation is not critical. The p-value of Kolmogorov-Smirnov test is 0.109.
4. Conclusions
In this paper, we study the relationship between FDI and economic growth in a country. Specially, we investi- gate the factors that affect FDI inflow to a country and determine the degree of their influence. We then study the impact of FDI per capita on GDP per capita. As a case Kazakhstan’s recent 18 years data from 1992 to 2007 was analyzed.
First, after considering the model (1) and the corre- lation matrix the fitted model (3) is obtained. Based on the model (3), the determinant of FDI is GDP and economic freedom index. If the one million dollar of GDP increases as economic freedom index is fixed, the FDI inflow increases by 116,000 dollars. In the other way, if the one point of economic freedom index increases as holding GDP fixed the FDI inflow increases by 9.7 million dollars. In statistics view, economic freedom index in the fitted model (3) is not statistically signifi- cant. Therefore, the fitted model (4) was obtained and GDP’ s impact on FDI is 119,700 dollars increase in FDI inflow by one million dollar increase in GDP in the model (4).
Second, we study FDI impact on economic growth.
Grager causality test is conducted to examine whether lagged values of FDI per capita help to predict GDP per capita. After obtaining the optimal lagged value of four years based on SBIC, AIC, and HQIC, the fitted model (7) was constructed based on Granger causality test and linear regression. In the model (7), FDI per capita’s impact on GDP per capita is 30.4 dollars increase in GDP per capita by one dollar increase in FDI per capita inflow.
To conduct this kind of research obtaining data is very difficult. If the data is available we recommend that various models and factors is tested and included to investigate the relationship between FDI and economic growth and factors of FDI determinants.
장 병 윤 ([email protected]) 1995 성균관대학교 산업공학과 학사
2000 Georgia Tech. Operations Research 석사 2002 Georgia Tech. Applied Statistics 석사
2004 Georgia Tech. Industrial and Systems Engineering 박사 2004~2006 Georgia Tech. Post Doc.
2006~2009 KT 네트워크 연구소 선임 연구원 2009~현재 아주대학교 경영대학 경영학부 조교수
관심분야 : 정보통신경영, BPM, OR/OM, SCM, Simulation, Applied Statistics
Assel Kassymbekova ([email protected]) 2003 Jurisprudence, Kazakh Humanitarian-Juridical University 2011 MBA in International Business, Ajou University
2011~current Ministry of Foreign Affairs of the Republic of Kazakhstan 관심분야 : FDI, Economic Growth, Econometrics, Applied Statistics
참 고 문 헌
1. Borensztein, E., Gregorio, J. D., and Lee, J.-W. (1998),
“How does foreign direct investment affect economic growth?,” Journal of International Economics, Vol. 45 No. 1, pp. 115-135.
2. Campos, N.F. and Kinoshita, Y. (2003), “Why does FDI go where it goes? New evidence from the transition economies”, IMF Working Paper.
3. Dunning, J. H. and Lundan, S. M. (2008), Multinational Enterprise and the Global Economy, 2nd ed., Edward Elgar Publishing, Cheltenham, UK.
4. Greene, W.H. (2012), Econometic Analysis, 7th ed., Prentice Hall, London, UK.
5. Haile, G and Aseffa, H. (2006), “Determinants of foreign direct investment in Ethiopia: a time series analysis,” The 4thInternational Conference on the Ethiopian Economy.
6. Jones, C.I. (1998), Introduction to Economic Growth, W.W. Norton, London, UK.
7. Kutner, M.H., Nachtsheim, C.J., Neter J., and Li, W.
(2005), Applied Linear Statistical Models, 5thed., McGraw Hill, NewYork.
8. Ledyaeva, S. and Linden, M. (2006), “Foreign direct investment and economic growth: empirical evidence from russian regions”, BOFIT Discussion Papers.
9. Lim, E.G. (2001), “Determinants of, and the relation between, foreign direct investment and growth: a summary of the recent literature”, IMF Working Paper.
10. Mottaleb, K.A. (2007), “Determinants of foreign direct investment and its impact on economic growth in developing countries”, MPRA No. 9457.
11. Romer, P.M. (1986),“Increasing return sand long-run growth”, Journal of Political Economy, Vol. 94 No. 5, pp. 1002-1037.
12. Torres-Reyna, O. (2009), “Time Series.” Princeton University (online).
13. Wooldridge, J.M. (2009), Introductory Econometrics, 4thed., South-Western CENGAGE Learning.