Article
Variability of Surface Water Properties in the Japan/East Sea on Different Time Scales
Vladimir Ponomarev
1*, Natalya Rudykh
1, Elena Dmitrieva
1, and Hajime Ishida
21
V.I. Il’ichev Pacific Oceanological Institute, POI
Far Eastern Branch, Russian Academy of Sciences, Vladivostok 690041, Russia
2
Graduate School of Natural Science and Technology Kanazawa University, Kanazawa 920-1192, Japan
Abstract : This study examined the multi-scale variabilities of sea surface temperature (SST) and salinity in the Japan/East Sea (JES) based on statistical analyses of observational data, with a focus on the north- western part of the sea. The regionality of JES SST variability was estimated for different frequency ranges on semimonthly (11-17 days), monthly to seasonal (30-90 days), quasi-semiannual (157-220 days), and quasi-biennial (1.5-3 years) time scales using cluster analyses of daily gridded SST data for 1996 to 2007 from the Japan Meteorological Agency (JMA). Several significant peaks and regional cores were found in each frequency range of the SST anomaly (SSTA) oscillations. Quasi-semiannual SSTA oscillations with high amplitude were found in the south-southwestern part of the Japan Basin (41-43
oN) and were amplified in the area adjacent to Peter the Great Bay. Oscillations with periods of 79 and 55 days also prevailed over the southwest Japan Basin between the Yamato Rise and the continental slope. A similar method was applied to classify SST and the annual cycle of surface salinity using Generalized Digital Environmental Model (GDEM) gridded data. The Tatarskii Strait and adjacent area showed the most specific annual cycles and variability in salinity on interannual to interdecadal time scales. The most significant inverse rela- tionship between surface salinity in the Tatarskii Strait and southern JES areas was found on the inter- decadal time scale. Linkages of sea water salinity in the Tatarskii Strait with Amur River discharge and wind velocity over Amurskii Liman were also revealed.
Key words : Amur River discharge, interannual, intra-annual, Japan/East Sea, sea surface salinity, SST, variability
1. Introduction
Climate variability of different time scales in the Asian Pacific region impacts the oscillation and change in both the meteorological situation over the Japan/East Sea (JES) and the water properties in its layers. A number of studies have described potential temperature and dissolved oxygen content in the deep layer of the JES (e.g., Kim and Kim 1997; Kim et al. 2001; Ponomarev and Salyuk 1997;
Ponomarev et al. 2000). Various studies of the JES have also revealed oscillations of meteorological, oceanographic, and hydrochemical characteristics on quasi-biennial (Hirose
and Ostrovskii 2000), quasi-El Niño-Southern Oscillation (ENSO; 3-7 years; Watanabe et al. 1986; Isoda 1994; Isoda and Korematsu 1995; Saveliev 1999; Park and Oh 2000), decadal (8-15 years; Watanabe et al. 1986; Isoda and Korematsu 1995; Ponomarev et al. 2000), bi-decadal (16- 25 years; Watanabe et al. 2003), interdecadal (25-45 years), and quasi-semi-centennial (50-70 years; Minobe 1996, 1997) time scales. Yurii Zuenko (personal com- munication 2002) identified oscillation with a period of 7- 8 months in mode-mean subsurface water temperature in a JES section along 132
oE. Park and Chung (1999) and Park and Chu (2006) revealed features of SST variability in JES on intra-annual and interannual time scales, and Park and Chung (1999) identified the prevailing variations
*Corresponding author. E-mail : [email protected]
in JES SST on annual and semi-annual time scales using semi-monthly averaged time series from 1990 through 1995. In addition, Ponomarev et al. (2006) reported on different modes of intra-annual variability in wind velocity, wind stress curl, and volume transport through the central JES, including oscillations with periods of approximately 60-90 days and half a year.
Anomalies in river runoff to the sea are known to influence ice formation and ice extent. The positive relationship between river discharge and ice extent has been explained by the halocline impact on the depth of winter convection and vertical heat flux change (e.g., Hanzlick and Aagaard 1980; Manak and Mysak 1989).
According to Akagawa (1977), Amur River discharge impacted Okhotsk Sea ice extent by a similar physical device in the mid-twentieth century. Using time-series data from 1938 to 1968, Yakunin (1975) found that an increase in Amur River discharge and sea water temperature, as recorded at coastal stations of the Amurskii Liman in summer, are usually associated with early dates of first sea ice formation in the Okhotsk Sea. Sea water temperature increases at coastal stations of the Amurskii Liman can be explained by heat advection with the input of warm fresh water from the Amur River in summer and fall.
Using time-series data from 1971 to 1993, Ogi et al.
(2001) and Ogi and Tachibana (2006) found a negative statistical relationship between Amur River discharge (ARD)/precipitation in the Amur River Basin in summer and Okhotsk sea ice extent (OSI). Ogi et al. (2001) supposed that the increase (decrease) of heat advection with warm fresh water from the Amur River in previous warm seasons resulted in a summer-fall SST rise (reduction) in the northwest Okhotsk Sea and OSI reduction (rise) in following winters. Their study was based on statistical analyses of 1-year moving-average time series, and the relationship found related to oscillation with a period of approximately 6-8 years. Ogi and Tachibana (2006) later explained this relationship as the impact of the Arctic Oscillation.
Ponomarev et al. (2005) demonstrated the changing relationship between the ARD and JES ice extent from positive in the early to mid-twentieth century to negative from the 1960s to recent years on quasi-biennial to bi- decadal time scales. Similar linkages may be found between the ARD and sea surface salinity and sea surface temperature anomaly (SSTA) in the Tatarskii Strait area.
In this study, we focused on SSTA variability in the JES on intra-annual to interannual time scales, as well as
variability of surface salinity in the northwestern JES on interannual to interdecadal time scales.
Our goals were to classify the time series and these spectrums using gridded daily SST to reveal characteristic JES regions with principally different SSTA time series and corresponding features of variability. Corresponding time series of surface salinity were unavailable. Therefore, we simulated the annual cycle of sea surface salinity from Generalized Digital Environmental Model (GDEM) data and classified the results to reveal the characteristic regions and to prepare monthly/seasonal mean time series of observed salinity averaged within these regions. The statistical relationships between the prepared salinity time series and discharge from the Amur and Razdolnaya (Suyfun) rivers were estimated.
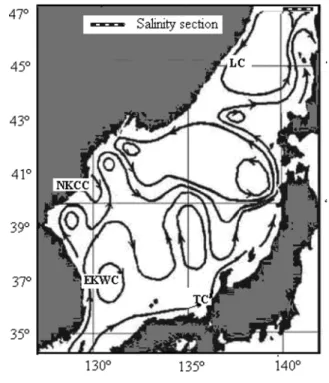
The characteristic regions found by classification of the SSTA and its spectrum could be also related to JES circulation patterns and currents. Therefore, we considered Danchenkov et al.’s (2006) various schemes for the surface current system. The detailed circulation patterns in the northwestern JES (two gyres) and current branching (a belt of salt water along 42-43
oN) presented by Aubrey et al. (2001) and Danchenkov et al. (2003) (Fig. 1) were useful for our regional data analyses.
Fig. 1. Surface current system in the JES from Danchenkov et al. 2003 and Danchenkov et al.
2006. The position of salinity section in the
Tatarskii Strait along 47
oN (Fig. 8) is shown.
2. Data and method
Oceanographic, hydrological, and meteorological time series from observational records over the JES and adjacent areas were included in the statistical data analyses. To analyze the intra-annual and interannual variability of JES SST anomalies, we used daily gridded SST time series with 0.25
ohorizontal resolution from 1996 to 2007 [Japan Meteorology Agency (JMA) data set] and monthly gridded SST time series with 1
ohorizontal resolution from 1900 to 2007 (Hadley Center data set, http://hadobs.metoffice.com/). The annual cycle of climatic monthly mean surface salinity and temperature was analyzed based on the GDEM data set (Version 2.5, 1998, https://128.160.23.42/gdemv/gdemv.html).
To analyze the variability of JES water salinity on interannual to interdecadal time scales, we used vertical temperature and salinity profiles from the Pacific Oceanological Institute (POI) database for observations from 1932 to 2004. We also used monthly mean time series of Amur River discharge at Khabarobsk (1900- 2004) and Razdolnaya/Suyfun River discharge at Terekhovka (1930-2005), as well as wind velocity in the lower troposphere, surface air temperature, precipitation, and evaporation from National Centers for Environmental Prediction/National Center for Atmospheric Research (NCEP/NCAR) reanalyses data.
Correlation, spectral, and cluster analyses were conducted to estimate the regionality and seasonality of multi-scale variability in SST, surface salinity, JES ice extent, and ARD. To analyze daily SSTA time series (1 January 1996-31 December 2007), spectrums of the time series, and annual cycles of the GDEM SST and surface salinity over the JES, we used various methods of cluster analyses, particularly hierarchy (Ward 1963) and k-means (Hartigan and Wong 1979) techniques.
The hierarchical method creates a hierarchy of sets of groups, which are constructed by successively combining two groups into one. In the first step, where each object represents a separate cluster, the distances between the objects are defined by the chosen measure. We used Euclidian distance, which uses the root mean-square distance between objects, based on spatial correlation. For objects to then become combined, a method for associating two clusters must be established. We used Ward’s method to combine groups (Ward 1963). This method is based on dispersive analysis for estimation of the distances between different clusters.
The classical k-means method algorithm (Hartigan and
Wong 1979) is based on a rather simple operations algorithm. This method involves an initial determination of the necessary number of clusters and techniques to define the initial values. The number of clusters can be determined by the hierarchy method, and the initial combination of objects into clusters can be done, for example, by choosing observations that maximize the initial between-cluster distances. The second step involved sorting the distance and taking observations at constant intervals to choose k number of clusters. The calculations were executed with StatSoft (StatSoft Inc. 2001, http://
www.statsoft.com/).
We used the characteristic regions found by cluster analyses to prepare time series of observed salinity and temperature (from the POI data base) averaged within these regions. The statistical relationships of the monthly, seasonal, and annual mean surface salinity in characteristic JES areas with anomalies of Amur River/Razdolnaya River discharge, regional precipitation, and precipitation minus evaporation were estimated using original and filtered time series from 1930 to 1999/2005.
3. SST variability on synoptic to interannual time scales
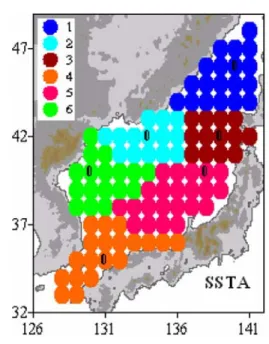
First, cluster analysis was applied to daily gridded SST (JMA, 1996-2007) to study the regionality in JES SST variability in different frequency ranges on meteorological synoptic (5-18 days) to quasi-biennial (1.5-3 years) time scales. To classify SSTA and its spectrum in different JES regions, we used the k-mean method with six major clusters. Fig. 2 shows characteristic regions in terms of the six clusters of daily gridded JES SSTA time series, with the associated climatic zones, sea circulation features, and prevailing factors influenced by multi-scale SSTA variability in different sea areas. The SSTA variability in the area adjacent to the Korea Strait (cluster 4) results from anomalies of the heat advection and circulation of subtropical water transported through the strait from the East China Sea (Isoda and Korematsu 1995; Park and Chung 1999; Teague 2002). Outside the Korea Strait, both anomalies of heat advection and interaction between the sea and the atmosphere control the SSTA variability, which is quite different in the western and eastern and in the subtropical and central transitional-subarctic regions.
The subtropical region is situated south of the polar front
in the JES. The central transitional-subarctic region is
situated north of the polar front in the latitude band of 40-
43
oN. Both the subtropical sea region situated outside the
Korea Strait and the transitional-subarctic sea area in the central JES were divided into western (clusters 6, 2) and eastern (clusters 5, 3) classes associated with different statistical features of the SSTA time series.
The SSTA in the western subtropical area (cluster 6) is controlled by different external meteorological and internal marine factors, resulting in variation in heat transport by the East Korean Warm Current (EKWC), mesoscale eddy dynamics (Lobanov et al. 2001), and heat exchange between the EKWC and cold waters of the North Korean Cold Current (NKCC), as well as net heat flux at the sea surface. Fig. 1 shows the major well-known surface currents in the JES, including the EKWC, NKCC, Tsushima Warm Current (TC), and Liman Current (LC), that are important to this study, and two cores of the JES subarctic gyre; the figure was adopted from Danchenkov et al. (2003, 2006). The SSTA in the eastern subtropical area (cluster 5) is controlled by the variability of baroclinic and barotropic branches (Isoda 1994; Park and Chung 1999; Danchenkov et al. 2006) of the TC. The SSTA in the transitional-subarctic deep sea area adjacent to Peter the Great Bay and the nearest Siberian coast (cluster 2) is substantially affected by winter cooling under strong anomalous winds from the continent (Kawamura and Wu 1998) and deep convection and circulation (Talley et al. 2003; Luneva et al. 2006) in the
southwestern core of the JES subarctic gyre. The SSTA in the eastern transitional-subarctic area (cluster 3) is substantially affected by variability of total heat transport by the EKWC and TC, as well as by variability of the current system in this area including the western (in latitude band 42-43
oN) and northern branches of transformed subtropical water inflowing to the western (cluster 2) and northern (cluster 1) areas.
The SSTA time series in the northern sea area adjacent
Fig. 2. Six domains in the JES (1-6) corresponding to different types of daily SSTA time series (1996- 2007) classified by cluster analyses (‘k-means’
method). The symbol ‘o’ means position of the SSTA time series with the minimum Euclidian distance from the cluster centre.
Fig. 3. Six domains in the JES (a, c, e, g) corresponding
to different types of periodograms (curves 1-6 in
b, d, f, h being typical for domains 1-6) of daily
SSTA time series (1996-2007) within four frequency
ranges of variability: Quazi-biennial (a, b), quazi-
semiannual (c, d 120-283 days), oceanic mesoscale
(e, f 30-90 days), and semi-monthly scale (g, h
11-18 days) classified by cluster analyses (‘k-
means’ method). The symbol ‘o’ means position
of the SSTA time series with the minimum
Euclidian distance from the cluster centre.
to the Tatarskii Strait (cluster 1) mostly differ from those in the area adjacent to the Korea Strait (cluster 4); this finding corresponds to the fact that, among the adjoining areas/clusters, maximal Euclidian distance was found between clusters 1 and 4. If we set more clusters (e.g., seven clusters), the northern area (cluster 1) adjacent to the Tatarskii Strait can also be divided into western and
eastern domains.
Figs. 3-4 shows six domains (Fig. 3a-g) found by the SSTA spectrum classification and time series (Fig. 3b-h) and regional cores of prevailing SSTA oscillations (Fig.
4) in four ranges of periodicities on quasi-biennial, quasi- semiannual (120-283 days), monthly to seasonal (30-90 days), and quasi-semimonthly-weekly (5-18 days) time
Fig. 4. Distribution of different spectral peaks (in terms of power spectrum) of the SSTA oscillations with periods:
(a) 992, (b) 794, (c) 576, (d) 449, (e) 220, (f) 209, (g) 198, (h) 157, (i) 79, (j) 55, (k) 47, (l) 34, (m) 17, (n) 15,
(o) 14, (p) 11 days in four ranges (similar to Fig. 3) of periodicity.
scales. The JES is divided into six areas, related to oscillations with different spectral density and frequency of prevailing peaks inside each range. Different modes of the quasi-biennial (Fig. 4a, b) oscillations are predominant in the latitude band 38-41
oN, with maximal spectral density in the western sea area and prevailing periods of about 992 and 794 days (Fig. 4a, b). An SSTA oscillation with a period of 794 days was also found in the sea area adjacent to Sakhalin Island.
The substantial quasi-semiannual (Fig. 3c, d) SSTA oscillation with a periodicity range of 120-283 days and prevailing spectral peaks at 157, 198, 209, and 220 days (Figs. 3d and 4e-h) occupies mainly the southwestern and central domains of the subarctic gyre including the area adjacent to Peter the Great Bay. For oscillations with a period of 209 days, the second core of the spectral density distribution is situated in the southwestern area of the subtropical gyre and the area adjacent to Peter the Great Bay (Fig. 4f). In the case of 157-day periodicity, both the first and second cores are situated in the latitude band 41- 43
oN. The first core occupies the western area of this band, whereas the second core occupies the eastern area (Fig. 4h). Comparison with previous results (Park and Chung, 1999) reveals the substantial spatial and temporal inhomogeneity of the quasi-semiannual SSTA oscillations.
The oceanic synoptic/mesoscale (Fig. 3e, f; 30-90 days) oscillation in SSTA is also typical for the area north of the Polar Front (40-43
oN), with prevailing periods of 79 and 55 days and maximal spectral density/amplitude over the southwestern Japan Basin (Fig. 4i, j). This scale of SSTA oscillation is associated with variability of the southwestern subarctic gyre and the formation and movement of baroclinic eddies in this area (Lobanov et al. 2001).
Variability was also found with periods of about 14 days (Fig. 4o) along the North Korea continental slope and shelf, about 15 days (Fig. 4n) in the offshore area over the Korean Plateau, and about 17 days (Fig. 4m) in the westward branch of the transformed subtropical water current along 42-43
oN with increased salinity (Aubrey et al. 2001). The periods of the oscillation in this frequency range are higher than the typical meteorological synoptic time scale (8-12 days) (Teague et al. 2002) and the characteristic 3-7 day oscillation of volume transport through the Korea Strait reported by Kim et al. (2005).
SSTA oscillations on the atmospheric synoptic time scale (8-12 days) were also found in the SSTA power spectrum (Fig. 3h).
Similar spectral peaks in each frequency band mentioned above have also been revealed in the hydrodynamic
component of Japan Sea Cable (JASC) submarine cable observations (Ponomarev et al. 2006; Starzhinskiy et al.
2007) in relation to total water transport through the JES between Nakhodka (Russia) and Naoetsu (Japan). A number of studies have estimated the SSTA oscillations associated with ENSO and decadal scales in different JES domains (e.g., Watanabe et al. 1986; Isoda 1994; Isoda and Korematsu 1995; Saveliev 1999; Park and Oh 2000).
Our estimation of low-frequency SSTA variability using long-term monthly mean time series from the Hadley Center (1900-2007) agrees with the results of most of the studies mentioned above.
4. Variability of water salinity on interannual to interdecadal time scales
We did not have enough salinity observations to estimate intra-annual and intraseasonal variability in the whole JES. Therefore, monthly mean GDEM surface salinity fields were analyzed to estimate the regionality of climatological annual cycles of surface salinity with a focus on the northwestern JES.
Five areas with substantially different annual cycles in the northwestern JES were classified by cluster analyses of GDEM data using hierarchy (Ward’s) and k-means
Fig. 5. Domains (1-5) in the Northwest JES classified by
cluster analyses of the surface salinity annual
cycle of the climatological, monthly GDEM data.
methods. These two methods produced results similar to those illustrated in Fig. 5. The annual cycles in the shelf area of the Tatarskii Strait (cluster 4), the western sea area adjacent to the shelf and the Japan Basin slope (cluster 5), adjoining deep sea belts (clusters 3, 2), and the deepest area of the Japan Basin (cluster 1) show minimum and maximum salinity in different months.
Two local salinity minima occur in the annual cycle over the Tatarskii Strait shelf area. The salinity minimum in May is associated with snow and sea ice melting and the spring freshet (including the impact of the Amur River freshet). The second salinity minimum in October in the Tatarskii Strait is associated with the impact of Amur River runoff and precipitation. The salinity maximum occurs in February-March in the Tatarskii Strait shelf area due to brine rejection during sea ice formation. In the adjoining area (cluster 5) and other clusters, the major minimum occurs in August or September, and salinity maximum could be in February, March, or April. The annual salinity cycle in the surface layer of the northwestern JES has maximal amplitude and standard deviation in the Tatarskii Strait and narrow shallow bays, such as Peter the Great Bay and the Olga Bay shallows (based on salinity time series from the POI data set).
Historical observations of surface salinity from 1929 to 2007 averaged within these regions (clusters), months, and seasons were used to estimate the linear trends and statistical relationships between time series of the regional surface salinity and regional precipitation, as well as differences between precipitation and evaporation or Amur and Razdolnaya discharges.
No statistically significant correlation was found between monthly/seasonal mean surface salinity in the Tatarskii Strait and regional precipitation or the difference between precipitation and evaporation using long-term or decadal time series. At the same time, significant relationships of anomalies of surface salinity, SST, ice extent, and ARD were found for some bi-decadal or 30-year periods.
Ponomarev et al. (2005) described the changing relationship between ARD and ice extent in the Tatarskii Strait in the 1960s. Over the last 40-50 years, this relationship has been negative, similar to the relationship between ARD and Okhotsk sea ice extent from the early 1970s found by Ogi et al. (2001).
Fig. 6 shows the statistical relationship between monthly mean time series (1948-2002) of SST (Hadley Center data set) in the Tatarskii Strait and ADR. The highest cross-correlation coefficients were found for July (approximately 0.6; curve 7 in Fig. 6), October (0.5-0.6,
curve 10), and August (0.5, curve 8). Significant relationships were also identified in November, February, March, and June. This relationship could be caused by the direct impact of the fresh and warm anomaly of Amur River water, as well as by remote linkages between SSTA and warm/cold anomalies in the atmosphere related to the Arctic Oscillation, as has been found in the Okhotsk Sea (Ogi and Tachibana 2006).
The relationship between surface salinity in the Tatarskii Strait and ARD is significant only in the same periods of high positive (negative) ARD anomalies and high positive (negative) anomalies of the water transport between Amurskii Liman and the Tatarskii Strait through the shallow Nevelskoi Strait. No regular measurements of water transport through the Nevelskoi Strait exist. Therefore, we analyzed anomalous salinity fields in the northwestern JES and zonal/meridional components of wind velocity over Amurskii Liman, Tataskii Strait, and adjacent land and sea areas. Fig. 7 shows two inverse situations in both the surface salinity distribution and zonal wind components over the southern Amur Basin and Amurskii Liman- Tatarskii Strait area. From 1982-1985, surface salinity in the Tatarskii Strait decreased (Fig. 7b) as zonal wind decreased, northern wind increased, and ARD increased.
In contrast, in 1974-1980, surface salinity in the Tatarskii Strait increased (Fig. 7a) as zonal wind increased and northern wind and ARD decreased. Sometimes, very strong northern wind results in decreased salinity in the Tatarskii Strait that is independent of the ARD anomaly.
In this case, the salinity reflects the impact of Amurskii Liman fresh surface water, which is always affected by
Fig. 6. Cross-correlation coefficient between the monthly
mean time series (1948-2002) of Hadley SST in
the Tatarskii Strait (characteristic time series of
domain 1 in Fig. 2) and Amur River Discharge
(ARD) for each month (1-Jan., 2-Feb., ~12-Dec).
Amur River runoff. For example, when ARD decreased in the mid- to late 1960s, the substantial salinity decrease in the Tatarskii Strait corresponded to very strong northern wind in the area mentioned above.
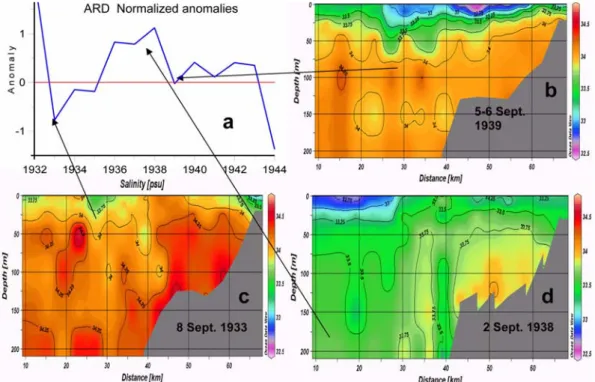
The quasi-decadal anomalies of both ARD and northern
wind could result in salinity anomalies not only in the upper layer but also in the intermediate water (100-300 m). Fig. 8 shows the normal salinity distribution (Fig. 8b) and two inverse anomalous salinity distributions (Fig. 8c, d) in a section along 47
oN in both the upper and
Fig. 7. Surface salinity over the Northwestern JES in Jul-Sep of 1974-1980; (a) when the anomalies of the Amur River Discharge (ARD) were negative, and in Jul-Sep of 1981-1985, (b) when the anomalies of the ARD are positive. The characteristic distribution of the near-surface zonal wind in Jul-Sep in the correspondent years is shown in small figures.
Fig. 8. Normalized anomalies of the Amur River Discharge (a), in warm period of a year (May-Oct) and salinity sec-
tions along 47
oN from 139
oE to 143
oE in the Tatarskii Strait during September (b, c, d) in years 1939, 1933,
and 1938 of normal (b), high negative (c), and high positive (d) Amur River Discharge.
intermediate layers. The position of the salinity section in the eastern area of the Tatarskii Strait is shown at the top of Fig. 1. Salinity was highest in September 1933 (Fig. 8c), when the decadal ARD anomaly was in a negative phase.
The lowest salinity occurred in September 1938 (Fig. 8d), when the ARD anomaly was in a positive phase. We did not find similar agreement between the anomalies of surface salinity in the Tatarskii Strait and precipitation at the coastal meteorological stations in this region. Therefore, we suggest that in some cases (Fig. 8c), salinity rises in this area due to the negative ARD anomaly and the impact of northward salt advection by transformed subtropical water currents.
Note that contrary to the Tatarskii Strait domain, inverse variations of precipitation in Vladivostok and surface water salinity in the deep sea area adjacent to Peter the Great Bay were found (Fig. 9) for the period from 1990 to 2003.
The precipitation in Vladivostok is also well correlated (coefficient of 0.8) with the time series of Razdonlaya (Suyfun) River discharge. Prevailing oscillation of the surface salinity and precipitation for July through September has a periodicity of about 6-7 years that is comparable to the typical periodicity of extreme precipitation events in the long-term time series, as well as with the corresponding scale of the surface air temperature in August (Ponomarev et al. 2000, 2006) and the summer (July-September) SSTA variability in this region.
The inverse link between time series (1930-1999) of annual/seasonal mean surface salinity in the Tatarskii Strait and southern sea areas, including regions over the Ulleung and Yamato basins and areas adjacent to the
Korea Strait and South Korea, is revealed on interannual to interdecadal time scales. Fig. 10 shows a typical inverse link between annual mean surface salinity in the Tatarskii Strait and Korea Strait areas. A similar negative relationship is shown for spring, summer, and fall time series of surface salinity. The absolute value of the correlation coefficient is high (about 0.6-0.7) for the 5- and 11-year moving-average time series. A topic of future studies would be to examine the inverse interdecadal oscillations in surface salinity in the subtropical and subarctic areas of the JES.
5. Concluding remarks
SSTA oscillations with periods related to major spectral peaks in any periodicity range, such as semimonthly (11- 17 days), monthly to seasonal (30-90 days), quasi- semiannual (157-220 days), and quasi-biennial (1.5-3 years) oscillations, prevail in different areas of the JES. Several significant peaks and regional cores were found in each frequency range. Cores of the quasi-biennial SSTA oscillations are situated in the western subtropical area (38-41
oN) and over the Yamato Basin (40
oN), as well as in the northeastern subarctic area adjacent to Sakhalin Island.
At least three significant modes of quasi-semi-annual oscillation prevail in the band from 41-43
oN and are enhanced in the sea area adjacent to Peter the Great Bay.
Oscillations with periods of 79 and 55 days related to mesoscale eddy dynamics prevail in the south-southwestern
Fig. 9. Sum of precipitation (mm) in Vladivostok and surface salinity (psu) in the JES adjacent to the Peter the Great Bay in July-September from 1990 to 2003.
Fig. 10. Time series of surface salinity (‰) in the Korean
Strait (solid top curves 1) and Tatarskii Strait
(dashed bottom curves 2) areas. Original and 5-
year moving average time series are presented by
thin and thick curves, correspondingly.
area of the Japan Basin between the Yamato Rise and the continental slope.
The linkages among anomalies of surface water salinity, precipitation in the south Primorye region (Vladivostok), and Razdolnaya (Suyfun) River discharge (RRD, to Peter the Great Bay) are significant mainly for the adjacent shelf, continental slope, and deep sea area. The surface water salinity, RRD, and precipitation show 6- to 7-year periodicity during the last 19 years of the data analyzed.
The linkages of water salinity in the Tatarskii Strait with anomalies of both ARD and meridional wind velocity over Amurskii Liman were found on interannual to interdecadal time scales.
A negative statistical relationship was revealed between annual/seasonal/monthly mean anomalies of surface salinity in the northern (Tatarskii Strait) and southern sea areas.
This inverse link prevails on interdecadal time scales and differs from the interdecadal variability in the subtropical and subarctic areas of the JES.
Unfortunately, we have no reconstructed long-term time series of the volume transport through the Korea Strait and the salinity of incoming subtropical water with which to estimate the relationship between anomalies of water and salt transport through this strait and surface and intermediate water salinity in the Tatarskii Strait and other domains of the northwest JES. Linkages among anomalies of regional salinity in different areas of the northwestern JES, salt advection, precipitation, and evaporation could be estimated in the future using observational data from different data bases, the JES monitoring system (Kim et al. 2005; Teague et al. 2002), and numerical simulations of the multi-scale variability of JES circulation.
Acknowledgements
The authors thank the organizers of the Korea Ocean Research and Development Institute (KORDI)-Pacific Oceanological Institute-Far Eastern Branch of Russian Academy of Science (POI FEBRAS) workshops held in 2006-2008. We also thank Dr. Chang-Woong Shin for reading an earlier version of this paper. Critical comments and editorial handlings by an anonymous reviewer are also gratefully acknowledged. This research was funded by FEBRAS grant 2007-2008 P3_GrA_C07_Ponomarev_
Dmitrieva.
References
Akagawa M (1977) Relation between flow of the Amur
River and sea ice in the Okhotsk Sea. J Japanese Society Snow and Ice 39:1-6
Aubrey DG, Danchenkov MA, Rizer SC (2001) Belt of salt water in the North Western Sea of Japan. In: Oceanogra- phy of the J apan Sea. Proceedings of the CREAMS 2000 International Symposium, Vladivostok, Russia, 11- Danchenkov MA, Lobanov VB, Riser SC, Kim K, Take-20 matsu M, Yoon J-H (2006) A history of physical ocean- ographic research in the Japan/East Sea. Oceanogr 19(3):18-31
Danchenkov MA, Rizer SC, Yoon J-H (2003) Deep cur- rents in the central Sea of Japan. Pacific Oceanogr 1(1):6-15
Hanzlick D, Aagaard K (1980) Freshwater and Atlantic water in Kara Sea. J Geophys Res 85:4937-4942
Hartigan JA, Wong MA (1979) A k-means clustering algo- rithm. Applied Statistics 28(1):100-108
Hirose N, Ostrovskii AG (2000) Quasi-biennial variability in the Japan Sea. J Geoph Res 105:14011-14027
Isoda Y (1994) Interannual SST variations to the north and south of the Polar front in the Japan Sea. La mer 32:285-293
Isoda Y, Korematsu H (1995) Interannual variation of water temperature, salinity, and oxygen vertical distribution in the Tsushima current region. Umi to Sora 71(2):47-67 Kawamura H, Wu P (1998) Formation mechanism of the
Japan Sea proper water in the flux center off Vladivos- tok. J Geophys Res 99(C12):25081-25091
Kim K, Kim K-R, Min D-H, Volkov Y, Yoon J-H, Take- matsu M (2001) Warming and structural change in the East (Japan Sea): a clue to future change in global oceans? Geophys Res Lett 26(17):3293-3296
Kim K, Kim Y-B, Park J-J, Nam S-H, Park K-A, Chang K-I (2005) Long-term and real-time monitoring system of the East/Japan Sea. Ocean Science J 40(1):25-44
Kim K-R, Kim K (1997) What is happening in the East Sea (Japan Sea)?: recent chemical observations during CREAMS 93-96. J Korean Soc Oceanogr 31:163-170 Lobanov VB, Ponomarev VI, Tishchenko PY, Talley L,
Mosyagina S, Sagalaev SG, Salyuk AN, Sosnin V (2001) Evolution of the anticyclonic eddies in the north- western Japan/East sea. In: Proceedings 11th PAMS/
JECSS Workshop, Cheju Korea, 11-13 April, pp 37-40 Luneva M, Clayson V, Carol A (2006) Connections between
surface fluxes and the deep circulation in the Sea of Japan. Geophys Res Lett 33(24):L24602
Manak DK, Mysak LA (1989) On the relationship between Arctic sea-ice anomalies and fluctuations in northern Canadian air temperature and river discharge. Atmos.
Ocean 27:682-691
Minobe S (1996) Interdecadal temperature variation of deep water in the Japan Sea (East Sea). In: Proceedings Fourth Workshop CREAMS, R/V OKEAN, Vladivos- tok, 12-13 Feb, pp 81-88
Minobe S (1997) A 50-70 year climatic oscillation over the
North Pacific and North America. Geoph Res Lett 24:683-686
Ogi M, Tachibana Y (2006) Influence of the Arctic Oscilla- tion on the negative correlation between Okhotsk Sea Ice and Amur River discharge. Geoph Res Lett 33:L08709, Ogi M, Tachibana Y, Nishio F, Danchenkov MA (2001)1-4 Does the fresh water supply from the Amur River flowing into the Sea of Okhotsk Affect Sea ice formation? J Meteor Soc Japan 79(1):123-129
Park KA, Chung JY (1999) Spatial and temporal scale vari- ations of sea surface temperature in the East Sea using NOAA/AVHRR Data. J Oceanogr 55:271-288
Park S, Chu P (2006) Interannual SST variability in the Japan/East Sea and relationship with environmental vari- ables. J Oceanogr 62(2):115-132
Park WS, Oh IS (2000) Interannual and interdecadal varia- tion of sea surface temperature in the East Asian mar- ginal seas. Progr Oceanogr 47(2-4):191-204
Ponomarev VI, Dyakonova I, Palshin N, Rudykh N, Ishida H (2006) Multiscale Variability of oceanographic and meteorological characteristics in the Japan (East) Sea area. In: Hayakawa K (ed) Past, present and future environments of Pan-Japan Sea region. MARUZEN Co Ltd, Kanazawa, Japan, pp 407-417
Ponomarev VI, Salyuk AN (1997) The climate regime shifts and heat accumulation in the Sea of Japan. In: Proceed- ings of CREAMS Symposium, 26-31 Jan 1997, Fuku- oka, Japan, pp 157-161
Ponomarev VI, Savelieva NI, Rudykh NI, Dmitrieva EV, Makhinov AN (2005) Changing linkages between Amur River discharge and ice extent in the seas of Okhotsk and Japan. Pacific Oceanogr 3(2):145-159
Ponomarev VI, Ustinova EI, Salyuk AN, Kaplunenko DD (2000) Climate variation in the Japan Sea and adjacent area in the 20th century. Izvestiya TINRO (Collection of
papers Trans Pacific Res Fish Center) 127(2):20-36 (In Russian)
Saveliev AV (1999) Japan Sea response to El Nino, FER- HRY special Issue 2. Vladivostok, Dalnauka, pp 54-70 (In Rusian)
Starzhinskiy SS, Nikiforov VM, Ponomarev VI (2007) Use of an underwater telecommunication cable JASC for a research of hydrodynamics of the Japan Sea. Underwa- ter investigation and robotics 2(4):38-45 (In Russian) Talley LD, Lobanov VB, Ponomarev VI, Salyuk AN, Ptish-
chenko Y, Zhabin IA, Riser S (2003) Deep convection and brine rejection in the Japan Sea. Geoph Res Lett 30(4). doi:10.1029/2002GL016451
Teague WJ, Jacobs HT, Perkins HT, Book JW, Chang K-I, Suk M-S (2002) Low- frequency current observation in the Korea/Tsushima Strait. J Phys Oceanogr 32:1621- Ward JH (1963) Hierarchical grouping to optimize an objec-1641
tive function. J Am Stat Assoc 58(301):236-244
Watanabe T, Hanawa K, Toba Y (1986) Analyses of year- to-year variation of water temperature along the coast of Japan Sea. Progr Oceanogr 17:337-357
Watanabe YW, Wakita M, Maeda N, Ono T, Gamo T (2003) Synchronous bidecadal periodic changes of oxy- gen phosphate and temperature between the Japan Sea deep water and the North Pacific intermediate water.
Geoph Res Lett 30(24). doi:10.1029/2003GL018338 Yakunin LP (1975) The Amur River discharge impact on
ice formation in the Amurskii liman. Voprosy geografii dalnevostochnih morei I severnoi chasti Tihogo okeana 50:66-70 (In Russian)
Received Oct. 6, 2008 Revised Nov. 26, 2008 Accepted Apr. 29, 2009