Construction of Total Information Portal Service for Korea Urban Regeneration
Dong-Suk Yang
1and Yeong-Hwa Yu
2(Received February 13, 2012 / Revised July 26, 2012 / Accepted July 27, 2012)
ABSTRACT
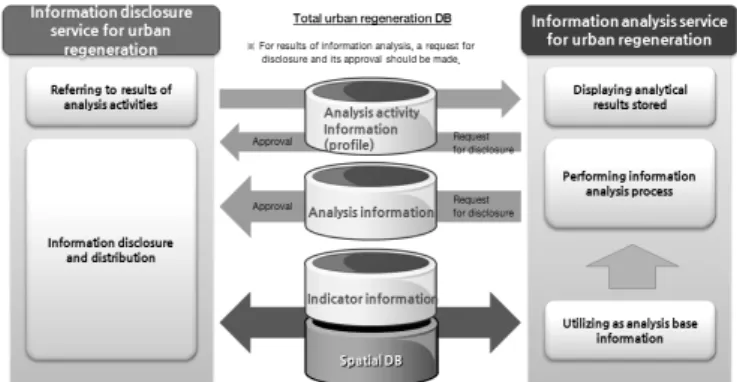
In this study, the total information portal service for urban regeneration was constructed to supply comprehensive information for Korean urban regeneration. The portal service is largely divided into an information analysis service for urban regeneration and an information disclosure service. For total information portal service, the information analysis service constructed a system for making district level decline diagnosis and city and county level potential analysis. Moreover, it can construct and control analyzed information specified at the district level. The information disclosure service consists of functions capable of recycling information, interworking the analysis service and facilitating expert participation. It also supplies data of total information DB in reprocessable format. For revitalization of communities, the information analysis service is constructed to lead experts on urban regeneration to share their opinions.
Key words: Urban Regeneration, Total Information Portal, Decline Diagnosis, Urban Potential, Urban Regeneration Information DB
http://lhi.lh.or.kr
This article is based on the research, ‘Construction of Total Information System for Urban Regeneration’, a high-tech urban development program of Ministry of Land, Transport and Maritime Affairs.
1) Principal Research Engineer, Land & Housing Institute, Korea Land & Housing Corporation (Main author: [email protected]) 2) Research Engineer, Land & Housing Institute, Korea Land & Housing Corporation (Corresponding author: [email protected])
1. Introduction
1.1 Research Background and Purpose
In view of improvement of urban competitiveness, a more rational decision-making system is required to promote urban regeneration projects. In order to construct an urban decline diagnosis system in consideration of diversity and complexity, a total diagnosis system with physical, social, economic and cultural elements should be constructed. Moreover, an increase in demand on various convergence applications of information leads to the necessity to reinforce the connection with the existing information supply systems for urban regeneration and their utilization. The precedent studies show that urban decline diagnosis systems and indicator databases were constructed to monitor the contents and degree of urban decline at the city, county and district levels. This study aims to construct a total information portal service for urban regeneration to implement a total information service for Korean urban regeneration, in terms of district level decline and urban potential diagnosis.
1.2 Research Field and Method
The total information portal service for urban regeneration was largely divided into an information analysis service for urban
regeneration and an information disclosure service. In this study, a system was constructed in consideration of functions for district level decline diagnosis, as well as potential analysis for cities, counties and districts in total information portals.
The information analysis service can construct and control analytical information specified for districts. The information disclosure service has functions to allow recycling of information, connection with analysis service and participation of experts.
Particularly, for indicators built into the database, indicator pools were first prepared according to analysis of internal and external similar indicators. Also, preliminary indicators were set through survey with experts. Among them, the final indicators were selected by way of expert consultation. Accordingly, this study aims to construct a total information portal service for Korean urban regeneration in consideration of extension of the existing urban decline diagnosis system for cities and counties. In particular, it aims to give a description of service construction from a viewpoint of system implementation,
1.3 Existing Research Result
Urban regeneration can be defined as the ‘comprehensive and
integrated vision and act for solving urban problems which can
continuously improve the economic, physical, social, and environ-
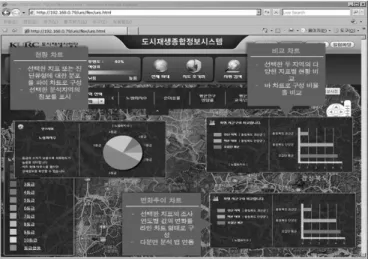
Fig. 1. City and district level decline diagnosis system UI confi- guration
mental status of transforming regions’ according to its existing definition (Roberts, P. and H. Sykes, 2000). Furthermore, as urban regeneration refers to the improvement in economy, society, and culture in addition to the physical environment, the extent of its definition is also expanded from the improvement of deteriorated areas (‘redevelopment’) to overall improvement of the existing city.
In fact, there have been almost no systems for supplying information on urban regeneration, in spite of its gradually increasing importance. KOPSS (Korea planning support systems) has recently developed a system for providing information on urban regeneration, that is restricted to physical information only.
According to previous studies related to this study, the urban decline diagnosis system for cities, counties and districts was constructed (Yang and Yu, 2011). With functions for decline diagnosis and indicator management. It applied OGC (Open Geospatial Consortium) standard map service technology and open API (Application Programming Interface) technology. It also applied RIA (Rich Internet Application)-based web interface technology for improvement of visual expression of analytical results and user accessibility.
Accordingly, for DB construction, with all cities, counties and districts in Korea as the objects, standard DB was constructed by actively using indicator data based on precedent studies, and then meta data were constructed.
1.3.1 System Function and Analysis Process
System functions are indicator management, diagnostic analysis (decline diagnosis for cities, counties and districts), main page, information disclosure and so on.
The system diagnosis function is divided into indicator analysis and diagnostic pattern analysis. In other words, the indicator analysis is a function of indicating results of the analysis of decline diagnosis according to indicators. It sets objects through processes of selecting areas for analysis (i.e., comparison among administrative districts, similar districts, and cities, counties and districts), points of time and indicators. According to the set conditions, an analytical map is displayed on the map screen and a chart dashboard is activated to refer to values according to the current states, comparative analysis (if cities, counties and districts is selected as areas for analysis) and contents on changes on the chart. The chart of changes allows interlocking with a multi-divisional map for visual comparison of the analytical map in two specific points. Under the maintenance of the previously set areas and points of time for analysis, analytical results can be immediately checked by changes in selected indicators.
The diagnostic pattern analysis is a function of making a synthetic analysis of total individual indicators or population · society, industrial economy and physical environments. The selection of objects for analysis is achieved by selecting areas for analysis, diagnostic patterns and points of time times in order.
The diagnostic pattern is selected by setting an analytical pattern from 4 patterns (i.e., total, population·society, industrial economy and physical environment) and selecting a selection indicator, except basic essential indicators. In case of the total pattern, a process of setting weight for 3 subordinary patterns is added.
According to the set conditions, information displayed on the screen is provided the same as results of indicator analysis.
The total information system for urban regeneration is constructed to basically display analytical results on a map and visualize various statistical information on a chart, which is difficult to be displayed on a map. For the chart, items are set differently according to areas and patterns for analysis.
1.3.2 Database Design and Construction
Among the configuration items of the total DB for urban regeneration, indicator information displays indicator research results to proceed to a process for processing and constructing raw data. Basically, a process of re-estimating indicator values included in raw data into relative ranking is undergone.
A list of construction object data consists of indicator data, meta data, code list and administrative district boundary.
1.3.3 System UI Design
The total information system for urban regeneration aims at structural interface design to lead various classes of users to easily utilize their desired functions. In this regard, it made an analysis of similar existing cases, as well as benchmarking.
Moreover, for successful UI (User Interface) design, it designed a
system interface to allow a modular UI design, a preferred user
UI configuration, and data transaction and expression at a UI
level. In the total information system for urban regeneration,
main interface components, as shown in Fig. 1, are a toolbar on
the top of the screen, a chart dashboard showing results, a wizard
form for executing input of conditions by stages, and a button bar
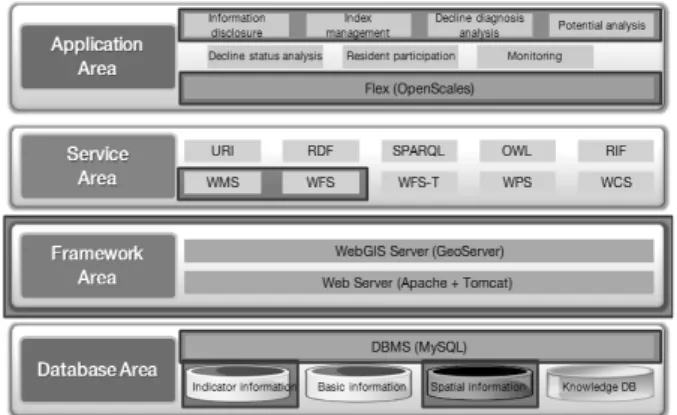
Fig. 2. System architecture configuration
Table 1. Diagnostic patterns by modules
Division
City and District Level Decline
Diagnosis
District Level Decline Diagnosis
Potential Analysis
Diagnostic pattern
Population·Society Industrial economy
Physical environment
Population·Society Industrial economy Physical environment
Human resource base Economic base
Living base Social and cultural base
form with improved accessibility for quickly executing a command.
2. Information Analysis Service For Urban Regeneration
2.1 Construction Background
Based on improvement plans of total information systems for urban regeneration according to previous studies, diverse application plans for information systems were required, in addition to systematic support for the urban regeneration business, to be improved, according to the application of technologies for utilizing spatial information, as well as the trend of urban regeneration, to efficiently supply information services. In this study, therefore, the information analysis service, including the district level decline diagnosis and potential analysis, was implemented, as well as the information disclosure service for smooth establishment of common utilization systems.
2.2 Overview
For an efficient district level
1)decline diagnosis, in connection with Korea’s city and the district level decline diagnosis system that was developed in existing studies, this service established a spatial phase structure in the unit of administrative dong and output area
2)in the relevant city and district. In order to enhance the efficiency of spatial analysis, it also allowed random and multiple selection of real users on their areas of interest (eup, myeon, dong, output area, etc.). Moreover, it was built to connect an extracted area of interest with setting of conditions for multiple indicators. According to the connection of functions of the information analysis service for urban regeneration with Road View API on the common map, it led to the approximate monitoring of the physical status in areas of interest prior to actual field investigation to facilitate improved work efficiency.
It also rated information for analysis by way of reprocessing raw data. In view of connection with the information disclosure service, it managed analysis activities according to the division of users.
The main features of the system architecture are shown in Fig.
2. In other words, construction of platforms with applied spatial information service standards, implementation of RIA appli- cation for effective analytical expressions and construction of whole open source-based SW frameworks are shown.
In the database area, district level decline diagnosis DB and potential analysis indicator DB were constructed. A DBMS
1) The district unit refers to a spatial size smaller than the city/county/district unit of the country, and indicates eup/myeon/
dong unit and output area included in the unit.
2) As the enumeration unit for the National Statistical Office, two or three basic enumeration districts are collected to set an output area, which consists of a minimum population of 10,000 people. (Eup/myeon/dong can consist of about 30 output areas).
(DataBase Management System) used MySQL in consideration of generality and extensibility based on the existing oracle. In the framework area, a web-based spatial information platform was constructed to implement a standard web map service. As for the WebGIS server, GeoSever was used. Moreover, Apache and Tomcat was used as the WebSever.
Service functions are largely divided into decline diagnosis and potential analysis. Decline diagnosis includes city/county/
district level and district level. In particular, the district level is classified into eup/myeon/dong level and output area level.
2.3 Information Analysis Process
In addition to common functions of referring to individual indicators, this information analysis process consists of analysis processes according to diagnostic patterns to lead users to select an indicator and give weight to produce outputs, in case of city/county/district level/district level decline diagnosis and potential analysis.
In the diagnostic pattern analysis process, after selection of a diagnostic pattern, its analytical indicator is selected. When rating is performed according to essential indicators and user-selected indicators, diagnosis map/chart is displayed on map (Fig. 3).
For district level decline diagnosis, a process for extracting
areas of interest was implemented to extract only areas that
correspond to ranges suitable for their conditions, after selection
of multiple indicators, as shown in Fig. 4. This process allows the
Fig. 3. Diagnostic pattern analysis process
Fig. 4. Process for extracting areas of interest
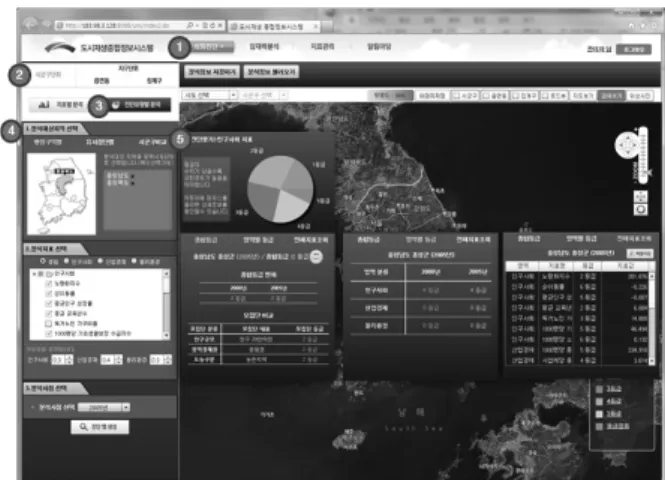
Fig 5. Basic screen configuration
Fig. 6. Decline diagnosis – city and district level indicator analysis
Fig. 7. Decline diagnosis – city and district level diagnostic pattern analysis
relevant area to be displayed on the diagnosis map/chart, when an area is selected at an eup/myeon/dong level or output area level and its analytical indicator.
2.4 Service Functional Configuration
The entire screen configuration for service consists of service menus on the top, dashboard panels for setting analysis and monitoring results on the left, and individual indicator selection areas and map control areas above the map (Fig. 5).
According to the basic screen configuration, as shown in Fig.
5, (1) indicates main menus consisting of decline diagnosis, potential analysis, indicator management and notice board. (2) indicates submenus, detailed settings and output window. (3) shows an indicator setting area and (4) shows a map control area.
In the area, sever l functions are implemented, for example, moving administrative districts, controlling transparency of statistical layers, storing images, controlling thematic map layer on/off, road view on/off, Naver map general/satellite on/off, zoom bar, extension, map initialization and so on.
Fig. 6 depicts a screen showing the performance of city and district level decline diagnosis according to indicators. It consists of analysis settings above the dashboard panel area on the left, chart representation in the middle and information display at the bottom. For potential analysis, same functions are implemented, and results of city and district level potential analysis can be monitored, when (8) View potential results is selected.
As shown in Fig. 7, diagnostic pattern analysis screen is
designed to set conditions by steps on the dashboard. (selection of
areas for analysis-> selection of analysis indicators->selection of
points of time for analysis) The results of the analysis are
displayed on the chart and information inquiry screen.
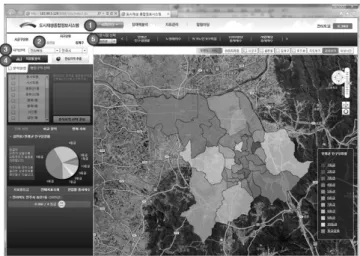
Fig. 8. Decline diagnosis – district level(eup/myeon/dong) indicator analysis
Fig. 9. Decline diagnosis – district level (eup/myeon/dong) area of interest extraction
Fig. 10. Results of areas of interest extraction
As shown in Fig. 8, the district level decline diagnosis function can analyze spatial units, which are subdivided into eup/myeon/
dong and output areas. The indicator analysis has an architecture
similar to that of city and district levels. Moreover, the eup/myeon/
dong level indicator analysis has the same execution process and result pattern as the city and district level analysis.
In the district level decline diagnosis, the function of extracting areas of interest, as shown in Figs. 9 and 10, selects multiple indicators by dragging them on the analysis indicator selection window and sets selection sections corresponding to the indicators to extract areas suitable for the conditions.
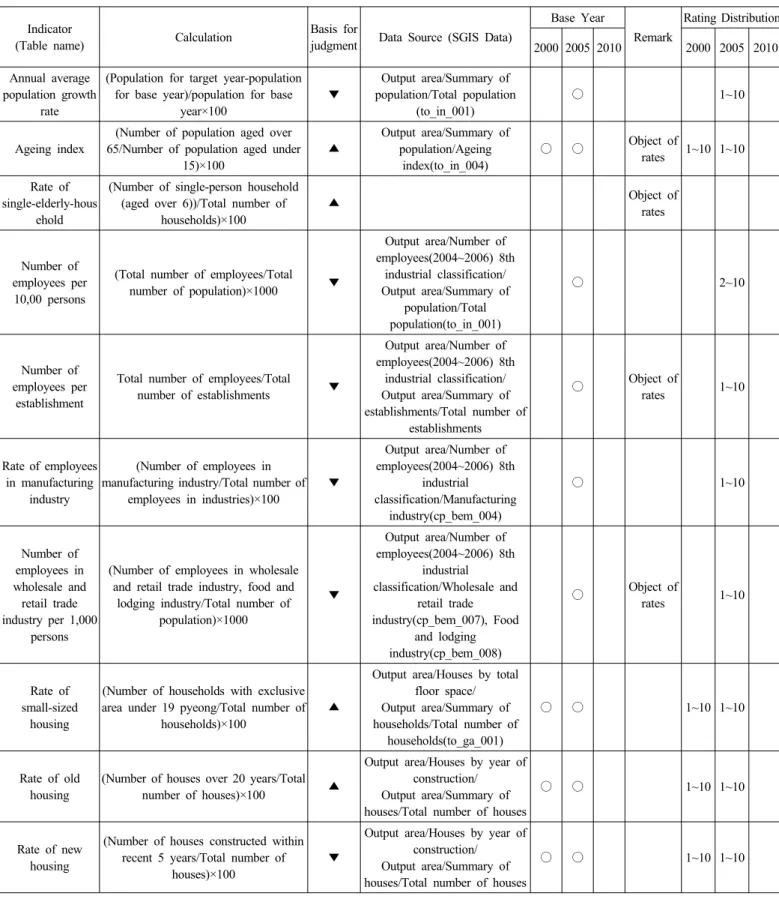
2.5 Construction of Urban Regeneration Integrated DB In this study, decline diagnosis indicators, potential indicators DB and operational spatial information were constructed. Among them, the city and district level decline diagnosis DB was already constructed in precedent studies.
District level indicators were based on output area level statistical data from SGIS of National Statistical Office.
However, some indicators were constructed by using data on the rates of adjacent areas from LH SDW
3), and the serial cadastral map and the use district map from KLIS. For data construction, potential analysis indicators are shown to have various sources and numerous items which require individual input. In this regard, for maintenance and management, a survey input process is required.
2.6 Establishment of Plans for Construction of Spatial Information for Urban Regeneration
In this study, the current status on the construction of data based on spatial information models for urban regeneration, in addition to development plans, was established to construct efficient spatial information. Unlike a central user model, a local user model requires a process of analyzing information on the current status through spatial analysis. Accordingly, data to be quantitatively extended and spatially diversified should be constructed. Moreover, in order to satisfy the demand on 3D information, the collaborative utilization of open platforms of Ministry of Land, Transport and Maritime Affairs and their utilization should be considered.
Instead of construction by collected physical data, spatial reference information is constructed to reduce the maintenance burden in connection with the standard map-based service and secure the freshness of information.
The 3D ‘open platform’ service, supplied by Ministry of Land, Transport & Maritime Affairs which takes the lead in Korea’s spatial information policies, supplies almost all the spatial information that is disclosed according to the recent IT trend. It is now under pilot operation and will continuously facilitate extended operation. It is also judged to implement collaborative applications in the information analysis service for urban regeneration by support of map service API and data API.
3) LH SDW (Spatial Data Warehouse)
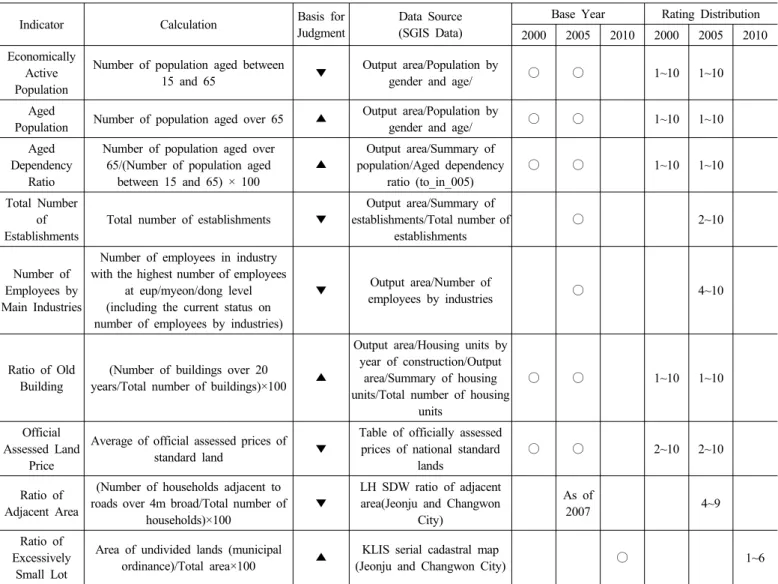
Table 2. Status on construction of (output area level) decline diagnosis indicator DB
Indicator Calculation Basis for
Judgment
Data Source (SGIS Data)
Base Year Rating Distribution 2000 2005 2010 2000 2005 2010 Economically
Active Population
Number of population aged between
15 and 65 ▼ Output area/Population by
gender and age/ ○ ○ 1~10 1~10
Aged
Population Number of population aged over 65 ▲ Output area/Population by
gender and age/ ○ ○ 1~10 1~10
Aged Dependency
Ratio
Number of population aged over 65/(Number of population aged
between 15 and 65) × 100
▲
Output area/Summary of population/Aged dependency
ratio (to_in_005)
○ ○ 1~10 1~10
Total Number of Establishments
Total number of establishments ▼
Output area/Summary of establishments/Total number of
establishments
○ 2~10
Number of Employees by Main Industries
Number of employees in industry with the highest number of employees
at eup/myeon/dong level (including the current status on number of employees by industries)
▼ Output area/Number of
employees by industries ○ 4~10
Ratio of Old Building
(Number of buildings over 20
years/Total number of buildings)×100 ▲
Output area/Housing units by year of construction/Output
area/Summary of housing units/Total number of housing
units
○ ○ 1~10 1~10
Official Assessed Land
Price
Average of official assessed prices of
standard land ▼
Table of officially assessed prices of national standard
lands
○ ○ 2~10 2~10
Ratio of Adjacent Area
(Number of households adjacent to roads over 4m broad/Total number of
households)×100
▼
LH SDW ratio of adjacent area(Jeonju and Changwon
City)
As of
2007 4~9
Ratio of Excessively
Small Lot
Area of undivided lands (municipal
ordinance)/Total area×100 ▲ KLIS serial cadastral map
(Jeonju and Changwon City) ○ 1~6
If local governments require local diagnosis and analysis of the current status on regeneration conditions, the role of spatial information will be considerably extend. Accordingly, it is necessary to consider plans for effective collaborative utilization of information of other organizations, which supply related data and services. Particularly, KOPSS with spatial information analysis module-based service seems to be a highly available system. In this regard, the feasibility of connection on this system and methods were analyzed. For KOPSS, the C/S-based system is now under pilot operation in model local governments (Daegu and Jeju). For its collaborative utilization, OpenAPI service should be implemented, but it has not yet been done. Instead, it will be applied later to additional local governments. As a result, for now, there is no object for collaborative utilization of KOPSS analysis module, which requires continuous monitoring.
For further KOPSS OpenAPI connection, technical plans were considered. The connection method is to implement KOPSS API, a model service that is a set of unit functions specified in domain areas, in client applications of the urban regeneration system. In
other words, according to API, unit functions (WPS, WFS, etc.) of KOPSS are operated, and results are received in GML document format and rendered (Fig. 12). If utilization of connection on analysis modules is achieved through KOPSS, it is judged that it will allow connection on LH SDW data provided with various spatial information and 3D information of the open platform connection. Both of the systems are constructed to support OpenAPI for service-based connection. The connection with other systems has been technically reviewed. However, the current central user model is a diagnostic process based on indicator information, which has low availability in spatial elements. For practical use, it is judged to be utilized for analysis of information on the current status in local user models.
3. Urban Regeneration Information Disclosure Service
This information disclosure service refers to a portal service,
which targets the supplying recyclable information, promoting
communities with a participation function and sharing results of
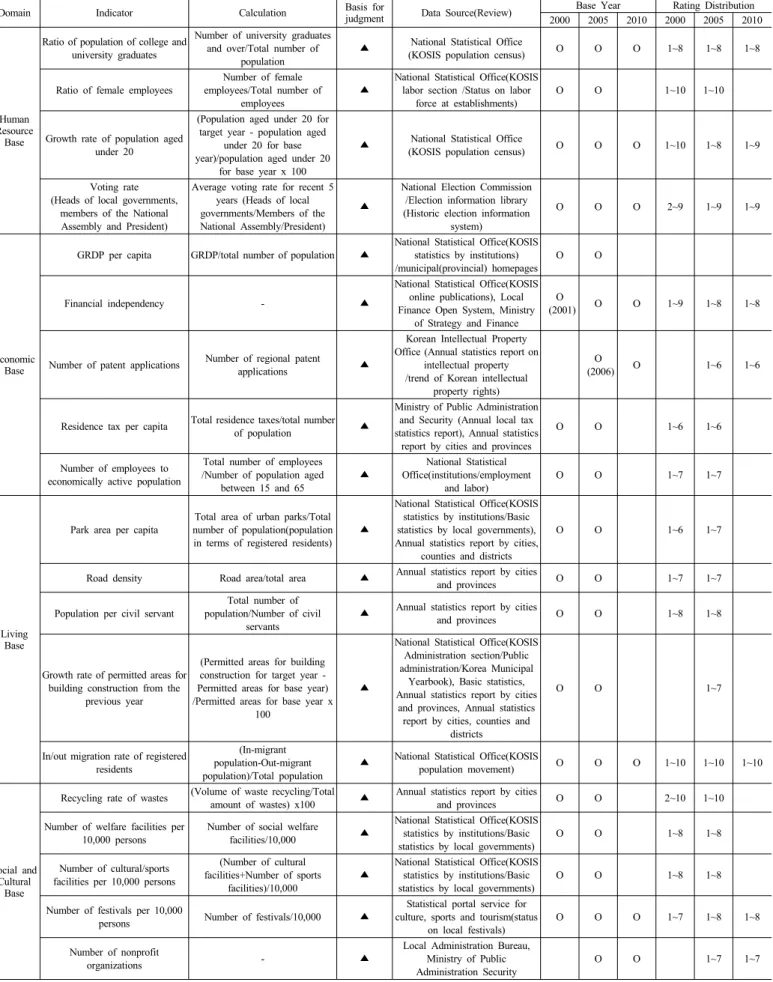
Table 3. Status on construction of (city and district level) potential indicator DB
Domain Indicator Calculation Basis for
judgment Data Source(Review) Base Year Rating Distribution
2000 2005 2010 2000 2005 2010
Human Resource
Base
Ratio of population of college and university graduates
Number of university graduates and over/Total number of
population
▲ National Statistical Office
(KOSIS population census) O O O 1~8 1~8 1~8
Ratio of female employees
Number of female employees/Total number of
employees
▲
National Statistical Office(KOSIS labor section /Status on labor
force at establishments)
O O 1~10 1~10
Growth rate of population aged under 20
(Population aged under 20 for target year - population aged
under 20 for base year)/population aged under 20
for base year x 100
▲ National Statistical Office
(KOSIS population census) O O O 1~10 1~8 1~9
Voting rate (Heads of local governments,
members of the National Assembly and President)
Average voting rate for recent 5 years (Heads of local governments/Members of the National Assembly/President)
▲
National Election Commission /Election information library (Historic election information
system)
O O O 2~9 1~9 1~9
Economic Base
GRDP per capita GRDP/total number of population ▲
National Statistical Office(KOSIS statistics by institutions) /municipal(provincial) homepages
O O
Financial independency - ▲
National Statistical Office(KOSIS online publications), Local Finance Open System, Ministry
of Strategy and Finance O
(2001) O O 1~9 1~8 1~8
Number of patent applications Number of regional patent
applications ▲
Korean Intellectual Property Office (Annual statistics report on
intellectual property /trend of Korean intellectual
property rights)
O
(2006) O 1~6 1~6
Residence tax per capita Total residence taxes/total number
of population ▲
Ministry of Public Administration and Security (Annual local tax statistics report), Annual statistics
report by cities and provinces
O O 1~6 1~6
Number of employees to economically active population
Total number of employees /Number of population aged
between 15 and 65
▲
National Statistical Office(institutions/employment
and labor)
O O 1~7 1~7
Living Base
Park area per capita
Total area of urban parks/Total number of population(population in terms of registered residents)
▲
National Statistical Office(KOSIS statistics by institutions/Basic statistics by local governments), Annual statistics report by cities,
counties and districts
O O 1~6 1~7
Road density Road area/total area ▲ Annual statistics report by cities
and provinces O O 1~7 1~7
Population per civil servant
Total number of population/Number of civil
servants
▲ Annual statistics report by cities
and provinces O O 1~8 1~8
Growth rate of permitted areas for building construction from the
previous year
(Permitted areas for building construction for target year - Permitted areas for base year) /Permitted areas for base year x
100
▲
National Statistical Office(KOSIS Administration section/Public administration/Korea Municipal
Yearbook), Basic statistics, Annual statistics report by cities
and provinces, Annual statistics report by cities, counties and
districts
O O 1~7
In/out migration rate of registered residents
(In-migrant population-Out-migrant population)/Total population
▲ National Statistical Office(KOSIS
population movement) O O O 1~10 1~10 1~10
Social and Cultural
Base
Recycling rate of wastes (Volume of waste recycling/Total
amount of wastes) x100 ▲ Annual statistics report by cities
and provinces O O 2~10 1~10
Number of welfare facilities per 10,000 persons
Number of social welfare
facilities/10,000 ▲
National Statistical Office(KOSIS statistics by institutions/Basic statistics by local governments)
O O 1~8 1~8
Number of cultural/sports facilities per 10,000 persons
(Number of cultural facilities+Number of sports
facilities)/10,000
▲
National Statistical Office(KOSIS statistics by institutions/Basic statistics by local governments)
O O 1~8 1~8
Number of festivals per 10,000
persons Number of festivals/10,000 ▲
Statistical portal service for culture, sports and tourism(status
on local festivals)
O O O 1~7 1~8 1~8
Number of nonprofit
organizations - ▲
Local Administration Bureau, Ministry of Public Administration Security
O O 1~7 1~7