The impact of catheter ablation of atrial fibrillation on the left atrial volume and function: study using three-dimensional echocardiography
Jongmin Hwang
1& Hyoung-Seob Park
1& Seongwook Han
1& Seung-Woon Jun
1& Na-Young Kang
1&
Jin-Hwa Jeon
1& Sang-Woong Choi
1& Cheol Hyun Lee
1& In-Cheol Kim
1& Yun-Kyeong Cho
1&
Hyuck-Jun Yoon
1& Hyungseop Kim
1& Chang-Wook Nam
1& Seung-Ho Hur
1Received: 5 October 2019 / Accepted: 23 December 2019
# The Author(s) 2019
Abstract
Purpose The exact correlation between the baseline left atrial (LA) volume (LAV) and atrial fibrillation (AF) radiofrequency catheter ablation (RFCA) outcomes and changes to the LA after AF RFCA has not yet been fully understood. We sought to evaluate the serial changes in the LAV and LA function after RFCA using 3D echocardiography.
Methods Consecutive patients who received RFCA of paroxysmal (PAF) or persistent AF (PeAF) at our center between January 2013 and March 2016 were included. Real-time 3D apical full-volume images were acquired, and a 3D volumetric assessment was performed using an automated three-beat averaging method. The LAV index (LAVI) was calculated and the LA ejection fraction (LAEF) was calculated as [LAVmax − LAVmin]/LAVmax.
Results Ninety-nine total patients were enrolled, and the mean age was 58.0 ± 8.2 years and 75 (74.7%) were male. There were 59 (59.6%) PAF patients and the remaining 40 (40.4%) had PeAF. AF recurred in 5 of 59 (8.5%) PAF and in 10 of 40 (25%) PeAF patients. The LAVImax increased on 1 day, decreased at 3 months, and then increased again at 1 year but was lower than that at baseline. The LAEF changes were similar to the volume changes but were more prominent in PeAF than PAF patients. The baseline 3D LAVImax was an independent predictor of AF recurrence after RFCA and the cut-off value was 44.13 ml/m
2. Conclusion In our study, even after 3 months of scar formation due to ablation, structural remodeling of the LA continued. The changes were more prominent in the non-recurrent, PeAF patients.
Keywords Atrial fibrillation . Catheter ablation . Left atrium . Atrial remodeling . Three-dimensional echocardiography
1 Introduction
Atrial fibrillation (AF) is common and associated with an elevated risk for strokes and death [1, 2]. The pathogenesis of AF remains incompletely understood. Recent studies re- vealed that triggering events and maintenance substrate with clinical modulating factors such as obesity, tobacco, hyperten- sion, and obstructive sleep apnea are comprising the complex
mechanism of AF [3]. Especially, the initiation and mainte- nance of AF mainly depend on the left atrium (LA). Indeed, many studies have reported the positive association between the occurrence/recurrence of AF and an increased LA size/
impaired LA function [4–6]. Therefore, an accurate evaluation of the LA is important to characterize individuals with or at risk of AF and to evaluate the strategies to treat or prevent AF.
Three-dimensional (3D) echocardiography has shown a close correlation and minimal bias compared with cardiac magnetic resonance imaging for the measurement of the LA volume (LAV) and is superior to two-dimensional (2D) echocardiog- raphy because image foreshortening can be overcome [7, 8].
Radiofrequency catheter ablation (RFCA) of AF is now con- sidered a cornerstone therapy for drug-refractory symptomatic AF. Previous studies have demonstrated a decrease in the LA dimensions and improved LA function after catheter ablation, but the majority of the studies has been based on 2D echocar- diography [9 – 11]. In this study, we evaluated the serial Electronic supplementary material The online version of this article
(https://doi.org/10.1007/s10840-019-00696-8) contains supplementary material, which is available to authorized users.
* Hyoung-Seob Park [email protected]
1
Cardiovascular Center, Keimyung University Dongsan Hospital, 1035, Dalgubeol-daero, Daegu, Dalseo-gu, 42601, South Korea
/ Published online: 30 December 2019
changes in the LA volume and LA function using 3D echo- cardiography to determine how the LA in AF patients changes after catheter ablation. Using this data, we investigated the impact of catheter ablation of AF on the LAVand LA function.
2 Methods
2.1 Study population and protocol
We enrolled consecutive patients who received RFCA for drug-refractory paroxysmal or persistent AF at our hospital from January 2013 to March 2016. Paroxysmal AF (PAF) was defined as the occurrence of two or more episodes of AF during the previous year, all of which terminated sponta- neously within1 week. Persistent AF (PeAF) was defined as continuous AF lasting more than 7 days. Because the purpose of our study was to elucidate the changes in the LAV after AF RFCA, an echocardiographic assessment on the same or pre- vious day of the ablation, and then 1 day/3 months/1 year after the ablation (1 day, 3 months, 1 year), was planned. The ex- clusion criteria were as follows: prior AF ablation, prior car- diac surgery, significant valvular heart disease, severely de- creased left ventricular (LV) ejection fraction (EF) (< 40%), hypertrophic cardiomyopathy, pulmonary disease, thyroid dis- ease, and patients with severe procedural complications re- quiring surgery. Finally, 99 patients were enrolled and com- pleted the follow-up. All patients signed their informed con- sent for the procedure, and the study was approved by the Institutional Review Board of Keimyung University Dongsan Hospital.
2.2 Echocardiographic studies
A comprehensive echocardiographic examination (Siemens ACUSON SC2000, 4Z1c real-time volume imaging transduc- er [2.5 MHz]) was performed in all patients. The investigators were blinded to the study outcomes. The conventional stan- dard echocardiographic parameters were obtained based on the American Society of Echocardiography (ASE) guidelines [12]. As described by the guidelines, the LA diameter was measured at end-systole from the parasternal long-axis view and a 2D volumetric assessment was performed using the biplane area-length method: the LA maximal volume (LAVmax) and LA minimal volume (LAVmin) were mea- sured at the end of ventricular systole and diastole, respective- ly. A 3D volumetric assessment was performed using an au- tomated three-beat averaging method. Real-time 3D apical full-volume images were acquired. All image data were ana- lyzed using eSie analysis software, which is an offline, dedi- cated SC2000 workplace system (Siemens Medical Solution, Mountain View, CA, USA) (detailed method of acquiring 3D LAV are described in supplementary materials). The LA
volume index (LAVI) was calculated as the LAV/body surface area, and the LA ejection fraction (LAEF) was calculated as [LAVmax − LAVmin]/LAVmax. Mainly, the 3D LAVI was used for the volumetric evaluation, and the LAEF was used for the functional evaluation.
2.3 Ablation procedure
Multislice computed tomography (CT) scan was performed 1 day before or the day of the procedure to assess for any structural heart disease. Further, transesophageal echocardiog- raphy (TTE) was performed in all patients to rule out any LA/
LA appendage thrombi. During the TTE, a baseline 2D exam- ination was initially performed, and then a detailed analysis of the LAV was performed using the 2D and 3D examination methods as described above.
The RFCA procedures were performed under a fasting state with conscious sedation after withdrawal from anti-arrhythmic drugs for a period equal to five-times the half-lives of the drugs.
Three multipolar catheters were inserted through the left fem- oral region and placed in the right atrium, coronary sinus, and His bundle. Two 8.5 Fr nonsteerable long sheaths (Swartz ™ Braided Transseptal Guiding Introducer SL1, Abbott, St. Paul, MN) were placed in the right atrium through the right femoral region and inserted into the LA using one or two transseptal punctures. After the transseptal puncture, an activated clotting time of over 350 s was maintained with intermittent boluses of intravenous heparin. The anatomical structure was identified using LA and pulmonary vein (PV) angiography, and a 3D mapping system (CARTO® 3, Biosense Webster, Diamond Bar, CA, USA, or EnSite™ Velocity™, Abbott/St. Jude Medical, St. Paul, MN, USA) was used to map the anatomical structure of the LA and PVs. Then, the prescanned CT and 3D images were merged. Intracardiac electrograms were obtained using a Prucka CardioLab™ Electrophysiology system (General Electric Marquette, Inc., Milwaukee, WI, USA).
Initially, a point-by-point ablation was conducted at the junction between the LA and PVs to achieve a complete four pulmonary vein isolation (PVI) under guidance with a 20-pole circular mapping catheter (LASSO®, Biosense Webster, Inc., Diamond Bar, CA or Inquiry Optima™, Abbott/St. Jude Medical, St. Paul, MN, USA). Then additional lines and/or a non-PV trigger ablation were performed according to the phy- sicians’ discretion. The radiofrequency energy was delivered using an irrigated ablation catheter (THERMOCOOL®
SMARTTOUCH™ catheter, Biosense Webster, Inc., Diamond Bar, CA or M-Curve IBI Therapy CoolFlex ™, Abbott/St. Jude Medical, St. Paul, MN, USA).
2.4 Follow-up
Anti-arrhythmic agents were allowed during the first 3 months
of the blanking period, and the maintenance of AADs after the
blanking period was left to the physicians’ discretion. An ECG and 24-h Holter monitoring were obtained right after the procedure and at 3, 6, and 12 months after the ablation.
ECG and Holter monitoring were also performed whenever the patient had symptoms suggesting an arrhythmia recur- rence. Recurrence of atrial arrhythmias was defined as the detection of AF or an atrial tachycardia lasting more than 30 s on the ECG or 24-h Holter monitoring.
2.5 Statistical analysis
Continuous variables are expressed as the mean value ± stan- dard deviation. Categorical variables are expressed as num- bers and percentages. Differences between the echocardio- graphic data for each patient at the different time points of the assessment were examined with two-tailed paired Student’s t tests. The difference in the serial changes of the LAVI and differences between groups were tested using a repeated measures analysis of variance (RM-ANOVA, Greenhouse and Geisser method was used for corrections based upon the estimates of sphericity). A receiver-operating characteristics (ROC) curve analysis was performed to evalu- ate the optimal cut-off value of the baseline LAVI for the prediction of a recurrence. All statistical analyses were per- formed using the MedCalc software package, version 18.11.3 (MedCalc Software, Mariakerke, Belgium). A p value < 0.05 was considered statistically significant.
3 Results
3.1 Clinical and procedural characteristics
The study population was composed of 99 consecutive drug- refractory AF patients. The mean age was 58.0 ± 8.2 years and 75 (74.7%) were male. There were 59 PAF patients (59.6%), and the remaining 40 (40.4%) had PeAF. The mean CHA
2DS
2-VASc score was 1.0 ± 1.1, mean LV EF, 65.0 ± 6.2%, and two patients had an LVEF below 50% (42 and 44%, respectively). Class I anti-arrhythmic drugs were used in 60 patients (60.6%) and class III anti-arrhythmic drugs were used in 17 patients (17.2%). A successful circumferential four PV isolation was performed in all patients and only a PV isolation was performed in 18 (18.2%, PAF 11, PeAF 7) pa- tients. An additional line creation was performed as follows:
cavotricuspid isthmus ablation in 81 (81.8%, PAF 48, PeAF 33), LA roof ablation in 13 (13.1%, PAF 4, PeAF 9), mitral isthmus ablation in 12 (12.1%, PAF 3, PeAF 9), SVC isolation in 4 (4.0%, PAF 4), and defragmentation of fractionated elec- trograms in 3 (3.0%, PAF 2, PeAF 1). During a 1-year follow- up period, AF or atrial tachycardia recurred in 5 of 59 (8.5%) PAF patients and 10 of 40 (25%) PeAF patients after the blanking period. And 54.5% of patients were using
amiodarone (20,) or class Ic anti-arrhythmic drugs (38,) after the blanking period. The results of the baseline clinical char- acteristics are summarized in Table 1.
3.2 Echocardiographic results
3.2.1 Change in the LA volume after AF ablation
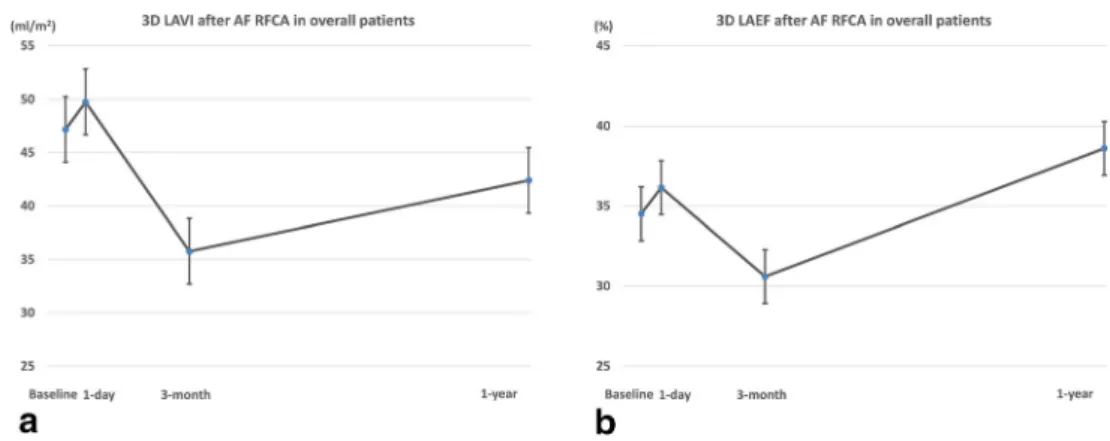
In our measurements, the volume of the LA exhibited a dy- namic change during the year of the post-ablation period.
Compared with the baseline, the LAVImax increased by 1 day, decreased at 3 months, and then increased again at 1 year, but the 1 year LAVImax was lower than that at baseline (3D LAVImax; baseline: 47.2 ± 16.2, 1 day: 49.8 ± 14.7, 3 months: 35.8 ± 10.8, 1 year: 42.4 ± 13.2, Fig. 1a). This changing pattern regarding the time and difference between
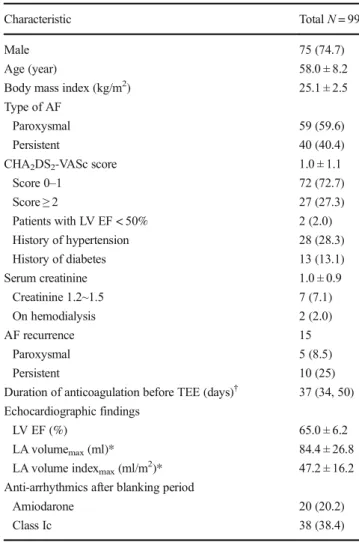
Table 1 Baseline characteristics
Characteristic Total N = 99
Male 75 (74.7)
Age (year) 58.0 ± 8.2
Body mass index (kg/m
2) 25.1 ± 2.5
Type of AF
Paroxysmal 59 (59.6)
Persistent 40 (40.4)
CHA
2DS
2-VASc score 1.0 ± 1.1
Score 0 –1 72 (72.7)
Score ≥ 2 27 (27.3)
Patients with LV EF < 50% 2 (2.0)
History of hypertension 28 (28.3)
History of diabetes 13 (13.1)
Serum creatinine 1.0 ± 0.9
Creatinine 1.2~1.5 7 (7.1)
On hemodialysis 2 (2.0)
AF recurrence 15
Paroxysmal 5 (8.5)
Persistent 10 (25)
Duration of anticoagulation before TEE (days)
†37 (34, 50) Echocardiographic findings
LV EF (%) 65.0 ± 6.2
LA volume
max(ml)* 84.4 ± 26.8
LA volume index
max(ml/m
2)* 47.2 ± 16.2
Anti-arrhythmics after blanking period
Amiodarone 20 (20.2)
Class Ic 38 (38.4)
Values are presented as n (%) or mean ± SD. AF atrial fibrillation, LV left ventricle, EF ejection fraction, TIA transient ischemic attack, LA left atri- um, SEC spontaneous echo contrast, TEE transesophageal echocardiography
†Duration of anticoagulation is presented as median (interquartile range)
*Three-dimensionally measured
the measurements were statistically significant (within subjects P < 0.0001, pairwise comparisons between measurements were all statistically significant. Data are shown in Table 2).
3.2.2 Change in the LAEF after AF ablation
For a functional assessment, the LAEF was calculated and compared. When calculated using 3D volume measurements, the changing pattern in the LAEF in the total patients also exhibited dynamic changes and the pattern was similar to that of the volume change: increased by 1 day, decreased at 3 months, and increased again at 1 year (LA EF; baseline:
34.5 ± 11.4, 1 day: 36.2 ± 9.7, 3 months: 30.6 ± 7.1, 1 year:
38.6 ± 8.8, the changing pattern regarding the time was statis- tically significant, within subjects P < 0.001, Fig. 1b).
3.2.3 Changes in the LA volume and LAEF according to the AF pattern
PAF vs. PeAF The changing patterns in the LAVImax in both the PAF and PeAF patients were similar to those in the overall patients, but the mean value was lower in the PAF patients than PeAF patients. However, the LAEF had a different
pattern. In the PAF patients, the LAEF slightly increased by 1 day, decreased at 3 months, and recovered to the baseline level at 1 year. On the other hand, the LAEF in the PeAF patients slightly increased by 1 day, slightly decreased at 3 months, and then increased much more than that at baseline at 1 year. Especially, the PeAF patients exhibited a nearly continuous increase in the LAEF during the follow-up period.
The mean value of the LAEF was higher in the PAF patients than PeAF patients ( P < 0.001, Fig. 2). An RM-ANOVA anal- ysis revealed a change in the LAVI and LAEF regarding the group, time, and group-time interaction, and it was statistically significant, which meant that the serial change in the LAVI and LAEF was significant, and the changing pattern between the groups also significantly differed (between group: LAVI P < 0.001, LAEF P < 0.001, within group: LAVI P < 0.001, LAEF P < 0.001, group-time interaction: LAVI P = 0.003, LAEF P < 0.001).
Non-recurrent vs. recurrent group In the volume measure- ments, the LAVImax decreased by 3 months and increased by 1 year regardless of a recurrence. Further, also the changing patterns in the LA EF were not related to the recurrence.
However, the absolute values differed (the LAVImax was higher and LAEF lower in the recurrent group than non- Fig. 1 Change in left atrial
volume index (LAVImax) and ejection fraction (EF) of overall patients after atrial fibrillation ab- lation. a Change of LAVImax.
The LAVImax increased by 1 day, decreased at 3 months, and then increased again at 1 year. b Change of LAEF. The changing pattern of in the LAEF was simi- lar to that of the volume change
Table 2 Pairwise comparisons of LA volume indexes between each follow-up points using three- dimensional echocardiography
Factors Mean difference Std. error P value 95% CI
Baseline 1 day − 5.205 1.476 0.0040 − 9.188 to − 1.223
3 months 20.653 1.824 < 0.0001 15.732 to 25.575
1 year 9.756 1.870 < 0.0001 4.713 to 14.800
1 day Baseline 5.205 1.476 0.0040 1.223 to 9.188
3 months 25.859 1.805 < 0.0001 20.988 to 30.729
1 year 14.962 1.872 < 0.0001 9.912 to 20.011
3 months Baseline − 20.653 1.824 < 0.0001 − 25.575 to − 15.732
1 day − 25.859 1.805 < 0.0001 − 30.729 to − 20.988
1 year − 10.897 1.503 < 0.0001 − 14.953 to − 6.842
1 year Baseline − 9.756 1.870 < 0.0001 − 14.800 to − 4.713
1 day − 14.962 1.872 < 0.0001 − 20.011 to − 9.912
3 months 10.897 1.503 < 0.0001 6.842 to 14.953
recurrent group [Fig. 3]). An RM-ANOVA analysis revealed changes in the LAVI and LAEF regarding the group and time was statistically significant, but the group-time interaction was not significant, that is the changing patterns in two groups were similar according to the time (between group LAVI P < 0.001, LAEF P = 0.005, within group LAVI P < 0.001, LAEF P = 0.001, group-time interaction LAVI P = 0.236, LAEF P = 0.419).
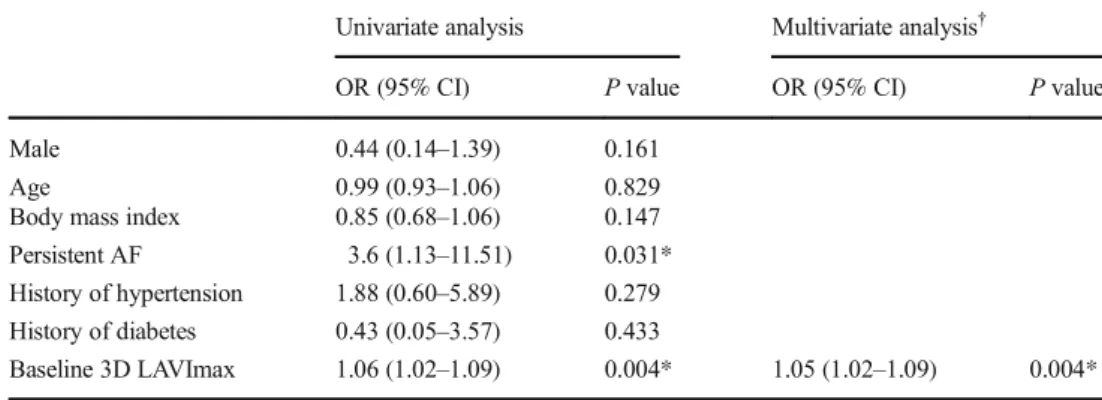
3.3 Baseline factors predicting an AF recurrence
In the univariate analysis, persistent AF and 3D LAVI were predictors of an AF recurrence. The age, gender, body mass index, hypertension, and diabetes did not reach a statistical significance. However, in the multivariate analysis, the base- line 3D LAVImax was confirmed as the only independent predictor of an AF recurrence (P = 0.049, OR = 1.04, 95%
CI 1.00–1.08, Table 3). The ROC curve analysis revealed that the discriminating ability of the 3D LAVImax for an AF re- currence was fair and a cut-off value of 44.13 ml/m
2predicted an AF recurrence with an 80.0% sensitivity and 50.0% spec- ificity (area under the curve = 0.697, 95% CI 0.596–0.785, Youden index J = 0.3; P = 0.007, Fig.4).
4 Discussion 4.1 Main findings
In the present study, we used the 3D echocardiographic method to assess the LAVand LA function after RFCA of AF. The major findings of this study were as follows: (1) The LAVI in the AF patients exhibited dynamic changes after RFCA. Compared with the baseline, the LAVI slightly increased by 1 day, de- creased at 3 months, and then increased again at 1 year, but was lower than that at baseline. (2) For the LAVI, the changing patterns in each subgroup were similar to that in the overall patients regardless of the type (PAV vs. PeAF) or recurrence.
However, the mean value was higher in the PeAF/recurrent patients than in the PAF/non-recurrent patients (Fig. 5a). (3) The overall pattern of the LAEF changes was similar to that of the LAVI, but a subgroup analysis showed a different pattern. In the PeAF patients, the LAEF continuously increased after RFCA and the patients without recurrence had a more dramatic change. On the other hand, in the PAF patients, the LAEF was markedly decreased at 3 months and returned to the baseline level at 1 year. The mean values were higher in the non- recurrent group than in the recurrent group (Fig. 5b). (4) In the Fig. 2 Comparisons of change in left atrial volume index (LAVImax) and
ejection fraction (EF) after atrial fibrillation (AF) ablation between par- oxysmal (PAF) and persistent AF (PeAF) patients. a Change of LAVImax. The changing patterns in the LAVImax in both the PAF and PeAF patients were similar to those in the overall patients, but the mean
value was lower in the PAF patients than PeAF patients. b Change of LAEF. The LAEF in the PeAF patients slightly increased by 1 day, slight- ly decreased at 3 months, and then increased much more than that at baseline at 1 year
Fig. 3 Comparisons of change in left atrial volume index (LAVImax) and ejection fraction (EF) after atrial fibrillation abla- tion between recurrent and non- recurrent patients. a Change of LAVImax. The LAVImax de- creased by 3 months and in- creased by 1 year regardless of a recurrence. b Change of LAEF.
The changing patterns in the
LAEF were also not related to the
recurrence
multivariate analysis, the baseline 3D LAVImax was an inde- pendent predictor of an AF recurrence after RFCA and a cut-off value of 44.13 ml/m
2yielding the best discrimination.
4.2 LA volume and AF, AF RFCA
A large body of evidence indicates that a large LA size/
volume is associated with new-onset AF and a poor outcome of AF RFCA [6, 13, 14]. However, the exact correlation be- tween the baseline LA size/volume and AF RFCA outcome and the serial changes in the LA after AF RFCA has not yet been fully established. Our study confirmed that the average LA volume during the follow-up period was lower in PAF patients and non-recurrent patients than in those patients with- out, as in the previous studies (Fig. 4) [6].
One of the unique features of our study was the observation that the LA volume was constantly changing during the 1-year follow-up period. Although there was a difference in the de- gree of the changes according to the subgroup, the LA volume increased immediately after the procedure but decreased at 3 months and then increased again at 1 year. In particular, an increase in the LA volume on the day after the procedure was observed, which was not revealed in the previous studies. The transient atrial contractile dysfunction following cardiover- sion, also known as atrial “stunning,” may mainly contribute to this phenomenon but this transient increase in LA volume was also observed in PAF patients. Hence, a tissue edema/
inflammation, effect of autonomic nerve modulation, increase in the circulating volume due to the use of irrigated ablation catheters, or another unknown mechanism may also contrib- ute to this. In addition, the maximal LA volume/size changes were achieved at 3 months, and then LA remodeling proceeded after that in our study. This phenomenon also has not been well described in the previous studies, and after 3 months of scar formation, structural remodeling of the LA continued regardless of the subgroup, indicating that AF is a
progressive disease. Therefore, it is necessary to monitor the patient continuously after the 3-month blanking period from the RFCA, and a careful judgment is needed, especially for anticoagulation therapy and anti-arrhythmic agent use.
4.3 Impact of AF RFCA on the LA size and function
In almost all studies, a decrease in the LA volume after AF RFCA has been confirmed, but it is still under investigation as to whether this leads to an increase in the LA function and whether the reduction in the volume is the result of reverse remodeling or scar formation [15]. Recently, several reports have been published showing that patients who underwent Table 3 Multivariate analysis for
the baseline characteristics which predict recurrence of AF after RFCA
Univariate analysis Multivariate analysis
†OR (95% CI) P value OR (95% CI) P value
Male 0.44 (0.14–1.39) 0.161
Age 0.99 (0.93 –1.06) 0.829
Body mass index 0.85 (0.68–1.06) 0.147
Persistent AF 3.6 (1.13 –11.51) 0.031*
History of hypertension 1.88 (0.60 –5.89) 0.279 History of diabetes 0.43 (0.05 –3.57) 0.433
Baseline 3D LAVImax 1.06 (1.02 –1.09) 0.004* 1.05 (1.02 –1.09) 0.004*
AF atrial fibrillation, RFCA radiofrequency catheter ablation, OR odds ratio, CI confidence interval, 3D LAVImax three-dimensional (3D) echocardiographic measurement of left atrial volume index
†