제32권 제1호(통권 제106호)
Economic Resources and Child Health:
An Assessment of Certain Mechanisms
Wankyo Chung
(Associate Research Fellow, Korea Development Institute)
가계 내 경제적 자원이 자녀의 건강에 미치는 영향에 대한 실증분석
정 완 교
(한국개발연구원 부연구위원)
* 정완교: (e-mail) wankyo@kdi.re.kr, (address) 49 Hoegiro, Dongdaemun-gu Seoul 130-740, Korea
•
Key Word: Economic Resources(경제적 자원), Health(건강), Sanitation(위생)
•
JEL code: I12, I11
•
Received: 2009. 10. 14
•Referee Process Started: 2009. 10. 19
•
Referee Reports Completed: 2009. 10. 30
child health and household economic resources, and find that economic resources as measured by equivalized expenditure have a statistically significant positive effect on child health and protect children from acute health conditions. We make additional use of the data (where extensive data on children’s nutrition, household sanitation, the utilization of medical care, and family health status are available) to assess the mechanisms through which economic resources may affect child health. We find evidence that economic resources have a sizable and significant effect on these potential intermediary factors, and that they, particularly household sanitation, partly explain the protective role of economic resources in child health
.
본 연구는 가계 내 경제적 자원이 자녀의 건강에 미치는 영향을 분석한다. 경제적 자원 과 건강 간의 관계는 두 변수 상호 간의 영향 으로 인해 분석이 용이하지 않다. 그러나 성 인의 건강이 노동공급 등을 통해 경제적 자원 에 영향을 미치는 것과는 달리, 자녀의 건강 은 경제적 자원에 미치는 영향이 적으므로 가 계의 경제적 자원이 자녀의 건강에 미치는 영 향은 분석이 상대적으로 용이하다. 인도네시 아 자료(Indonesian Family Life Survey)를 이용하여 분석한 결과, 가계의 경제적 자원이
자녀의 건강에 통계적으로 유의한 수준에 서 긍정적인 영향을 끼치는 것으로 나타났 다. 또한 경제적 자원이 자녀의 건강에 영 향을 끼치는 경로는 영양상태, 의료서비 스의 이용, 가계의 위생상태 등인 것으로 나타났다. 따라서 저소득 가구 자녀의 건 강증진을 위해서는 의료서비스의 이용 증대뿐만 아니라 가구의 위생상태 등을 개선하는 정책 또한 중요한 것으로 판단 된다.
I . Introduction
The positive association between economic resources and health has been extensively reported in the literature. However, the direction of causation remains unclear, particularly as to whether it is economic resources that affect health or vice versa (Smith 2004). Pritchett and Summers (1996) and Ettner (1996) used instrumental variables estimation and found the positive income effect on health to be causal and structural. However, Smith (1998, 1999), Meer et al. (2003), and Adams et al. (2003) cast considerable doubt on the robustness of these results.
Driven by the assumption that children’s health is less likely to affect their socioeconomic status because they do not contribute to family income,1 Case et al.
(2002) and Currie and Stabile (2003) used data from the U.S. and Canada, respectively, to show that the relationship between income and adult health status has antecedents in childhood. Case et al. examined insurance, health at birth, the genetic tie between parents and children, and a number of types of health behavior, such as whether a child has a regular bedtime, to identify the mechanisms that underlie the relationship between income and child health. Currie and Stabile found that the health of children with low socioeconomic status worsens with age, because they are subject to more health shocks, and argued that it is important to understand the reasons that there are more health shocks among children who live in low- income families.
We use data from the Indonesian Family Life Survey (IFLS) to examine the relationship between economic resources and child health in Indonesia, and find that economic resources as measured by equivalized expenditure have a statistically significant positive effect on child health and protect children from acute health conditions. We make additional use of the data (where extensive data on children’s nutrition, household sanitation, the utilization of medical care, and family health status are available) to assess the mechanisms through which economic resources affect child health. We find evidence that economic resources have a sizable and significant effect on these potential intermediary factors, and that they, particularly household sanitation, partly explain the protective role of economic resources in child health. It is important to understand the mechanisms that underlie the relationship between economic resources and child health, because poor health is likely to affect the future socioeconomic status of children through its effect on their future health and educational attainment (Case et al. 2002; Case et al. 2003; Currie and Stabile 2003).
The remainder of this paper is organized as follows. Section II describes in detail the data that is used in the study. Section III presents the empirical results, which show a positive association between economic resources and child health, and examines the mechanisms that underlie this relationship. Section IV concludes the paper.
1Children’s health, however, may reduce the parental labor supply and thus family income, but Case et al. (2002) found no supporting evidence that children’s health at birth affects the maternal labor supply.
Ⅱ
. Data and Descriptive Statistics
Data from the third wave of the Indonesian Family Life Survey (IFLS3) (collected from June to November in 2000) is used in the empirical analysis.2 More than 30,000 individuals in 7,224 households, representing about 83% of the Indonesian population living in 13 of the nation’s 26 provinces, were originally sampled and then followed up in a large-scale socioeconomic and health survey (Strauss et al.
2004a; Strauss et al. 2004b).3
One of the key variables for the empirical analysis is household expenditure as a measure of economic status. Household expenditure is less prone to measurement error than is wealth or income, and it is more likely to provide an accurate picture of economic well-being (Frankenberg et al. 1999; Strauss et al. 2004a). Household expenditure for 37 food and 19 non-food items, including housing expenses, was cumulated and converted to a monthly equivalent, as in Frankenberg et al. (1999). It was then divided by the square root of the total number of people in the household to equivalize household expenditure. This equivalized expenditure captures the amount of economic resources that are available to each household member, taking into account the fact that people in a larger household are worse off than those in a smaller household, conditional on the same level of household economic resources (Deaton 2001).4
Another key variable in the analysis is that which measures child health status.
The IFLS3 contains a rich array of data on child health. Self-reported child health, either self-rated by older children or rated by a household member (most likely, at 72.2%, the child’s parent), are measured on a four-point scale from “unhealthy” (1),
“somewhat unhealthy” (2) and “somewhat healthy” (3) to “healthy” (4). We also use the number of days of activities that are missed due to poor health in the past four weeks, and the child’s health change in the past year,5 transformed into a five-point scale from “much worse” (-2), “somewhat worse” (-1), “about the same” (0) and
“somewhat better” (1) to “much better” (2).
2Although the IFLS is longitudinal, the current analysis relies solely on the 2000 data because some of the key variables for this study - for example, parental information and nurse-assessed child health - are not available for 1993 and 1997. On the other hand, Gertler and Zeitlin (2002) used the 1993 data to study the relationship between education and adult health.
3The provinces are four from Sumatra (North Sumatra, West Sumatra, South Sumatra, and Lampung), all five of the Javanese provinces (DKI Jakarta, West Java, Central Java, DI Yogyakarta, and East Java), and four from the remaining major island groups (Bali, West Nusa Tenggara, South Kalimantan, and South Sulawesi).
4Thus, equivalized expenditure is household expenditure/(household size)1/2 . Note that the standard per capita household expenditure divides household expenditure by household size itself, not the number of equivalent adults as calculated in this paper by the square root of household size. Non-parametric kernel density estimates of log of equivalized expenditure appear to support the normality assumption.
5Children less than one year old are excluded from the health change measure.
As the drawbacks of all self-reported measure of health status have been well explained (Strauss and Thomas 1998; Baker et al 2001), our primary measure is nurse-assessed health status, which is measured on a nine-point scale from “the most unhealthy” (1) to “the most healthy” (9). Therefore, the use of a more objective health measure, such as nurse-assessed individual health status, will provide us with assured and robust empirical evidence.6
Table 1 presents the descriptive statistics for the estimation sample. The sample used in the analysis comprises 10,411 children aged 14 and below, with non-missing data on key covariates. In the sample, 10.4% reported poor health, which is either
“somewhat unhealthy” or “unhealthy,” with a mean self-reported heath status of 3.35, whereas 38.2% were assessed by a nurse to be unhealthy (the evaluation scale
<=5), with a mean value of 6.432.7 The average household monthly expenditure was 1,179.15 (in thousands of Rupiahs), and the average equivalized expenditure was 519.18 (in thousands of Rupiahs).
Of the sample, 54% are female, and 46.9% live in urban areas. In terms of household sanitation, 25% live in households that drink either bottled or piped water, 47.3% in households that use their own toilet with a septic tank, and more than half (55.1%) live in households that use a flowing drainage ditch. Only 22.8% live in households that dispose of garbage in trash cans that are collected by a sanitation service, and 13.8% live in households that store perishable food in a refrigerator.
Finally, 9.3% live in households that participate in the Dana Sehat (health fund) program, which is a unique, community-managed health insurance scheme in Indonesia.8
Ⅲ
. Economic Resources and Health
1. Evidence on the Relationship between Economic Resources and Child Health
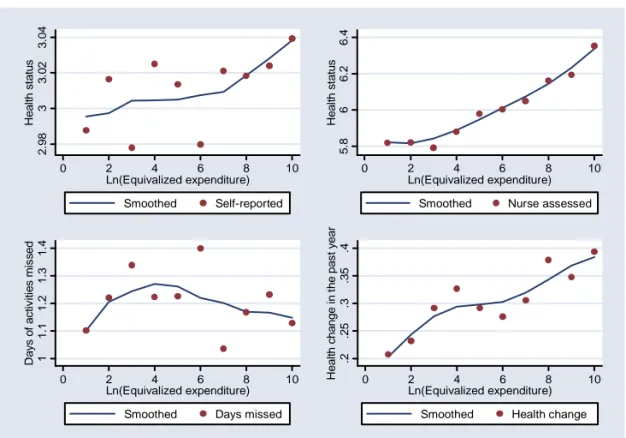
Figure 1 first looks at the relationship between economic resources as measured
6The use of child height and weight can be another solution to the drawbacks of all self-reported measures of child health. However, it will require strafying the sample more finely by age groups with different growth pattern and hinder the results from being compared with those in studies by Case et al.
(2002) and Currie and Stabile (2003), which all used self-reported measures of child health. The specific question for our nurse-assessed child health measure was, “How does the health of this person compare, in general, to the health status of other people of the same age and sex?”
7Looking more closely into the distribution shows that, whereas about 91% of the sample reported that they were either “somewhat healthy” or “healthy,” about 92% were assessed to be 5, 6, or 7 on the scale by a nurse.
8This program is “in fact a framework within which the community, community leaders and health staff can work together” to “develop a pre-paid health care scheme, to raise income, to improve living conditions and to increase community’s understanding about health and its relation to nutrition and environment” (www.healthdevelopment.org).
<Table 1> Descriptive Statistics
Variable Description Mean Std. Dev.
Self-reported health status (1-4) The scale is from 1 (unhealthy) to 4 (healthy) 3.350 1.601 Self-reported poor health =1 if somewhat unhealthy or unhealthy 0.104 0.356 Nurse-assessed health status (1-9) The scale is from 1 (the most unhealthy) to 9
(the most healthy) 6.432 2.983
Nurse-assessed poor health (<=5) =1 if evaluation <=5 0.382 0.606 Household expenditure
(in thousands of Rupiahs) 1179.15 1572.40
Equivalized expenditure (in thousands of Rupiahs)
=household expenditure/(household
size)1/2 519.18 731.71
Age 7.84 6.56
Female =1 if female 0.540 0.645
Urban =1 if living in urban area 0.469 0.639
Drinking water =1 if living in household drinking bottled or
piped water 0.250 0.494
Own toilet =1 if living in household using own toilet
with a septic tank 0.473 0.638
Sewage =1 if living in household using a flowing
drainage ditch 0.551 0.661
Garbage disposal
=1 if living in household disposing garbage in trash cans, collected by a sanitation service
0.228 0.501
Store perishable food in a refrigerator
=1 if living in household storing perishable
food in a refrigerator 0.138 0.403
Health fund =1 if living in household participating in the
health fund (Dana Sehat program) 0.093 0.351 No. of Obs. (10,411)
Notes: Nurse assessment of child health is reported by a nurse who collects physical assessments. Estimates are weighted using individual sampling weights.
Source: Third wave of Indonesian Family Life Survey, 2000.
by equivalized expenditure and child health. The upper half of Figure 1 shows the relationship between child health, as measured by both self-reported (the left panel) and nurse-assessed general health status (the right panel), and log of equivalized expenditure. The bottom half uses the number of days of activities that were missed due to poor health in the past four weeks (the left panel) and the child’s health change in the past year (the right panel) for other health measures. The mean values of each health measure for each 10 equidistant intervals of the log of equivalized expenditure are overlaid with conditional expectations of them as a function of the log of equivalized expenditure, using a locally weighted regression smoother. The positive relationship between log of equivalized expenditure and child health is
[Figure 1] Equivalized Expenditure and Child Health
evident from the figure. Children were reported to be (or reported themselves to be) healthier, were assessed to be healthier by a nurse, missed fewer days of activities due to poor health, and experienced improvement in their health when they lived in a family with more economic resources.
Table 2 presents ordered probit estimates to examine the relationship between child health and log of equivalized expenditure while controlling for other confounding individual and parental health risk factors.9 A mother’s educational level of junior high school or high school or higher and a dummy variable for having two parents are used for child-specific parental characteristics. The other variables included in the regressions are dummy variables for the child’s age, sex, urban location, and the relationship between the survey respondent and the child and
9See Currie (2000) for the economic model of the child health production function. Child health as measured by self-reported health status and nurse-assessed health status is an ordinal measure. Thus, the relationship between child health and log of equivalized expenditure is estimated using ordered probits. In ordered probit, the probability of observing health outcome (y=) i is the probability that the estimated linear function, plus random error, is within the range of the cutpoints estimated for the outcome:
) Pr(
)
|
Pr( y = i x = k
i−1< x
β+ e ≤ k
i where e is assumed to be normally distributed. β together with a set of cutpoints k are estimated while k0 is taken as− ∞
and kI as∞
where I is the number of possible outcomes. x is a set of individual and parental health risk factors.2.9833.023.04Health status
0 2 4 6 8 10
Ln(Equivalized expenditure) Smoothed Self-reported
5.866.26.4Health status
0 2 4 6 8 10
Ln(Equivalized expenditure) Smoothed Nurse assessed
11.11.21.31.4Days of activities missed
0 2 4 6 8 10
Ln(Equivalized expenditure) Smoothed Days missed
.2.25.3.35.4Health change in the past year
0 2 4 6 8 10
Ln(Equivalized expenditure) Smoothed Health change
<Table 2> Economic Resources and Child Health
Ordered Probits OLS Ordered Probits OLS Self-
reported health status
Nurse- assesse d health
status
Change in general
health
Days of activities missed
Self- reported
health status
Nurse- assessed
health status
Change in general
health
Days of activities
missed
Ln(Equivalized expenditure)
0.071 0.2 0.076 -0.099 0.044 0.136 0.049 -0.066 (2.77)** (6.08)** (3.55)** (2.00)* (1.65) (4.09)** (2.10)* (1.27) Mother's education
Junior high school 0.003 0.25 0.104 -0.037
(0.06) (4.87)** (2.36)* (0.29)
High school or more 0.107 0.275 0.097 -0.152
(2.35)* (4.57)** (2.25)* (1.58)
Two parent family 0.052 0.041 -0.016 -0.032
(1.06) (0.81) (0.37) (0.34)
Constant 2.894 2.756
(8.26)** (7.53)**
No. of Obs. 10,411 10,411 9,772 10,411 10,108 10,108 9,473 10,108 Notes: Other variables included in the regressions are: dummy variables for age, sex, living in urban area,
and the relationship between the survey respondent and the child and thirteen provincial dummies, with Jakarta as the omitted category. A dummy variable for missing maternal education is also included in the regressions when child-specific parental characteristics are added to the estimation model. Estimates are weighted using individual sampling weights. Absolute values of robust t- statistics (OLS) and z-statistics (Ordered Probits) are reported, taking into account the clustering of observations by community area. * significant at 5%; ** significant at 1%.
Source: Third wave of Indonesian Family Life Survey, 2000.
thirteen provincial dummies, with Jakarta as the omitted category. Throughout this paper, unless otherwise specified, all of the estimation models include all of the variables above. They also correct for the clustering (not-independent sampling) of observations at the community area for more conservative standard errors than are corrected for clustering within households. Furthermore, estimates are weighted using individual sampling weights to handle random samples where the probability of being sampled varies.
The first two columns of Table 2 show that a doubling of equivalized expenditure is associated with 0.071 points (self-reported) and 0.2 points (nurse-assessed) of improvement in child health.10 Similarly, we find significant effects of log of
10Although not directly comparable, it is worthwhile to note that the estimates of log of equivalized expenditure in the model of nurse-assessed health status are comparable in size to those in Case et al.
(2002). Note also that the direction of the effect in the ordered probit model is unambiguously determined by the sign of the coefficient estimates for the first and last outcomes but not always for the intermediate outcomes (Wooldridge 2002). Furthermore, “the magnitude of the ordered probit coefficient does not have
equivalized expenditure on the child’s health change in the past year and the number of days of activities missed due to poor health in the past four weeks. When variables for child-specific parental characteristics are additionally controlled for, the estimated coefficients for log of equivalized expenditure decline, but are still statistically significant at less than 10% significance levels, except for the number of days of activities missed due to poor health.11 The coefficients on mother’s education are large and statistically significant, either because education may serve as a proxy for the longer-run measure of economic status or because education makes mothers more adept at protecting their children’s health (Case et al. 2002; Currie and Moretti 2003).
Case et al. (2002) argue that the positive relationship between household income and children’s health can be explained by the arrival and impact of chronic health conditions in childhood.12 Currie and Stabile (2003) argue that a new chronic health condition has a much greater effect on child health than does an older condition and that income mitigates the effect of the new chronic health condition. Table 3 examines this using the child’s acute health conditions (these include headache, runny nose, cough, difficulty in breathing, fever, stomach ache, nausea/vomiting, diarrhea, skin infection, eye infection, and toothache) in the past four weeks for which the IFLS had collected information. These acute health conditions appear not to be rare and chronic in the sense that the fraction of children who have them increases with age; thus, these acute conditions are different from such chronic conditions as asthma, heart disease, bronchitis, epilepsy, kidney troubles, mental troubles, etc., that were used in the previous studies mentioned above. For example, about 72.5% of the children in the IFLS3 have at least one of these conditions, and the fraction of children with any one of them declines up to age nine and increases
a simple interpretation, but its sign and statistical significance agree with the linear regression results.”
11These estimates are certainly biased downward to the extent that equivalized expenditure has a measurement error. However, this downward bias will be counterbalanced by the potential reverse causality that runs from health to economic resources. If anything, when the log of average equivalized expenditure, using data from the 1997 and 2000 IFLS, is used instead to reduce its measurement error, ordered probit estimations of nurse-assessed health status show that the coefficient estimates increase from 0.2 to 0.224 when variables for child-specific parental characteristics are not controlled for and from 0.136 to 0.172 when they are controlled for. On the other hand, when the log of equivalized expenditure using data from the 1997 IFLS alone is used, the coefficient estimates are 0.170 (std. err. 0.035) and 0.128 (std. err.
0.036), respectively.
12They also showed that the relationship between household income and children’s health becomes more pronounced as children grow older. When our sample is divided into two age groups, one aged 0 to 6 (4,944 observations) and the other aged 7 to 14 (5,467 observations), the coefficient for log of equivalized expenditure increases similarly from 0.168 to 0.231 for older children, and both are statistically significant (1%) in the estimation model of nurse-assessed health status. When variables for child-specific parental characteristics are added to the estimation model, the coefficient still increases from 0.091 (4,884 observations) and 0.176 (5,224 observations) for older children. Furthermore, the main results in Table 5 remains the same when the sample is divided into two age groups. For example, as for younger children, the coefficient for log of equivalized expenditure declines the most from 0.091 to 0.066 when the variables on household sanitation are controlled for and, as for older children, from 0.176 to 0.131.
<Table 3> Economic Resources and Acute Health Conditions Ordered Probits Nurse-assessed health status
Ln(Equivalized expenditure) 0.136
(4.09)** 0.068
(1.38)
Has condition 0.024
(0.65) -0.512
(1.76)
Ln(Equivalized expenditure)*has condition 0.092
(1.85) Mother's education
Junior high school 0.25
(4.87)** 0.251
(4.90)**
High school or more 0.275
(4.57)** 0.274
(4.57)**
No. of Obs. 10,108 10,108
Notes: “Has condition” equals 1 if the child has at least one of the following conditions: headache, runny nose, cough, difficulty in breathing, fever, stomach ache, nausea/vomiting, diarrhea, skin infection, eye infection, and toothache. Other variables included in the regressions are: dummy variables for age, sex, living in urban area, whether the child has two parents in the household, missing maternal education, and the relationship between the survey respondent and the child and thirteen provincial dummies, with Jakarta as the omitted category. Estimates are weighted using individual sampling weights. Absolute values of robust z-statistics are reported, taking into account the clustering of observations by community area. * significant at 5%; ** significant at 1%.
Source: Third wave of Indonesian Family Life Survey, 2000.
thereafter.13 Nonetheless, they are transformed into a binary indicator of having at least one of the 11 acute health conditions and used to examine whether they have any impact on children’s health, and, if they do, whether household economic resources protect children from them. Due to the drawbacks of all of the reported measures of health status, hereafter we focus on results that are based on children’s nurse-assessed health status.
First of all, the binary indicator for having at least one of the acute health conditions shows an unexpected positive sign and is not statistically significant, as shown in the first column of Table 3. Also, its inclusion in the model has no effect on the other coefficients of interest. However, when the acute health conditions are limited to serious ones that require a visit to a hospital, health center, clinic, or doctor’s practice, the indicator shows a statistically significant negative effect on children’s health with the coefficient of (-0.08). Unfortunately, however, these limited serious conditions as defined above have to be highly correlated (r = 0.992) with their
13The most common acute health condition is runny nose (51.2%), followed by cough (38.8%) and fever (34.3%), whereas the rarest condition is difficulty in breathing (4%), followed by eye infection (4.6%) and nausea/vomiting (8.3%). In Currie and Stabile (2003), 19% of the children reported suffering from asthma, and 26 percent reported having some chronic condition in 1994.
interaction variable with log of equivalized expenditure, because they entail more household expenditure. Thus, when the original binary indicator for having at least one of the 11 acute health conditions is added to the model, together with its interaction variable with log of equivalized expenditure, the binary indicator shows a negative sign and the interaction variable a positive sign (both are statistically significant at the 10% significance level), as shown in the second column of Table 3.
This conforms to the results in Currie and Stabile (2003). Therefore, household economic resources appear to protect children from acute health conditions
2. Explanation on the Relationship between Economic Resources and Child Health
This protective income effect may reflect better nutrition, better household sanitation, and/or more utilization of medical care among the children who live in a family with more economic resources. Case (2001) provides supporting evidence for the argument that better nutrition and sanitation are important mechanisms through which income affects adult health. Barker (1997) emphasizes that a limited supply of nutrients in the prenatal period may be the origin of a number of diseases in later life.
Currie and Gruber (1996) show that Medicaid (public health insurance in the U.S. for poor women and children) expansion to low-income children increases the utilization of medical care and is associated with a significant reduction in child mortality.
Econometric estimates that quantify the impact of economic resources, as measured by equivalized expenditure, on nutrition are provided in the first column of Table 4. A negative answer to the question - “Did the child eat the listed item last week?” - is coded “1” and then summed over all of the food items (these include sweet potatoes, eggs, fish, meat/poultry, milk, vegetables, bananas, papayas, carrots, and mangoes). The OLS results show that log of equivalized expenditure reduces the number of food items that were missed in the past week by 0.74, which is a 16.7%
decline relative to the mean value of 4.42.14
Another way by which economic resources may influence child health is household sanitation. We take advantage of the extensive IFLS3 data on household sanitation. In previous studies, the health effect of household sanitation was captured using the household income variable when variables for household sanitation were not available. The second and third columns of Table 4 show that a doubling of equivalized expenditure increases the probability of living in a household that drinks bottled or piped water by 6.5 percentage points and the probability of living in a household that uses its own toilet with a septic tank by 19.9 percentage points, which are increases of 26% and 42.1%, respectively, relative to the baseline probabilities. The fourth and fifth columns of Table 4 show that a doubling of equivalized expenditure increases the probability of living in a household that uses a flowing drainage ditch by 7.2 percentage points and the probability of living
14About 18% of the children had missed four food items in the past week, and 16.5% and 16% had missed three and five food items, respectively.
<Table 4> Economic Resources, Nutrition, Household Sanitation, and the Utilization of Medical Care
OLS Probits
No. of food items missed
Drinking water
Own
toilet Sewage Garbage disposal
Store perishable
food in a refrigerator Ln(Equivalized
expenditure)
-0.74 (14.59)**
0.065 (5.50)**
0.199 (11.39)**
0.072 (4.64)**
0.059 (6.99)**
0.086 (14.58)**
Mother's education
Junior high school -0.28 (3.65)**
0.032 (1.48)
0.166 (6.29)**
0.065 (2.32)*
0.095 (5.45)**
0.059 (4.22)**
High school or more -0.374 (5.11)**
0.086 (3.71)**
0.307 (12.19)**
0.119 (4.84)**
0.125 (7.26)**
0.138 (10.66)**
Constant 12.845
(39.26)**
No. of Obs. 10,108 10,108 10,108 10,108 10,108 10,108
Probits
Outpatient
(4 weeks)
Inpatient (1 year)
Health fund
Ln(Equivalized expenditure)
0.038 (4.78)**
0.004 (4.44)**
0.019 (3.65)**
Mother's education
Junior high school 0.025
(1.98)*
0.001 (0.45)
0.009 (0.88)
High school or more 0.035
(2.56)*
0.004 (2.16)*
0.001 (0.11) Constant
No. of Obs. 10,107 10,049 10,108
Notes: Food items include sweet potatoes, eggs, fish, meat/poultry, milk, vegetables, bananas, papayas, carrots, and mangoes. Other variables included in the regressions are: dummy variables for age, sex, living in urban area, whether the child has two parents in the household, missing maternal education, and the relationship between the survey respondent and the child and thirteen provincial dummies, with Jakarta as the omitted category. Estimates are weighted using individual sampling weights. Absolute values of robust t-statistics (OLS) and z-statistics (Probits) are reported, taking into account the clustering of observations by community area. Marginal effects are calculated by multiplying the probit coefficient by the value of the standard normal probability density function evaluated at the mean of all explanatory variables. * significant at 5%; ** significant at 1%.
Source: Third wave of Indonesian Family Life Survey, 2000.
in a household that disposes of its garbage in a trash can by 5.9 percentage points, which are increases of 13.1% and 25.9%, respectively, relative to the baseline probabilities. The last column shows that a doubling of equivalized expenditure increases the probability of living in a household that stores perishable food in a refrigerator by 8.6 percentage points, which is a significant 62.3% increase relative to the baseline probability.
The bottom panel of Table 4 examines the impact of economic resources, as measured by equivalized expenditure, on the utilization of medical care. Answers to the two questions - “In the past four weeks, did the child visit a hospital, health center, clinic, or doctor’s practice, or was the child visited by a health worker?” and “In the past twelve months, did the child receive inpatient care (hospitalization)?” - are used to measure the probability of having had a doctor’s visit in the past four weeks and the probability of having had hospitalization in the past year, respectively. If anything, a doubling of equivalized expenditure increases the former by 3.8 percentage points and the latter by 0.4 percentage points, which are increases of 21.1% and 30.8%, respectively, relative to the baseline probabilities of 18% and 1.3%.
To the extent that these measures of medical care utilization are affected by morbidity, their uses as a measure of access to medical care are vulnerable to the potential confounding problem of morbidity (Currie and Gruber 1996).15 Therefore, to surmount this problem, this paper uses another measure of access to medical care that is less likely to be affected by morbidity. This is the health fund (the Dana Seha program). The uninsured are known to receive less health care than the insured, and, in Indonesia, the health fund is a unique community-managed health insurance scheme. The last column in the bottom panel of Table 4 shows that a doubling of equivalized expenditure is associated with a 1.9 percentage point increase in health fund coverage, which is a sizable 25.7% increase relative to the baseline probability.
Thus, economic resources, as measured by equivalized expenditure, have a sizable positive effect on children’s nutrition, household sanitation, and the utilization of medical care.
Table 5 directly examines how much of the protective role of economics resources can be explained by nutrition, household sanitation, and the utilization of medical care, and which one of these plays the most important role. The first column of Table 5 is the result shown in Table 2. In the second column of Table 5, the coefficient of log of equivalized expenditure declines slightly from 0.136 to 0.134 when the number of food items that were missed in the past week is additionally controlled for. The coefficient on the number of food items that were missed in the past week is negative, but not statistically significant. The third column of Table 5 shows the corresponding decline from 0.136 to 0.133 in the coefficient of log of equivalized expenditure when the variable for the health fund program is additionally controlled for. Note that the
15When expenditure on medical costs is deducted from household expenditure, and an equivalized expenditure based on this is instead used to reduce the above mentioned confounding problem of utilization of medical care with morbidity, a slightly smaller, but still positive (statistically significant), effect on the utilization of medical care is shown (the respective coefficients are 0.036 and 0.0036), even though the results are not presented in the table. This may be partly due to quite a small medical cost, which is less than two percent of household expenditure on average.
<Table 5> Economic Resources and Child Health Taking into Account Some Mechanisms Ordered Probits
Nurse-assessed health status
Ln(Equivalized expenditure) 0.136 (4.09)**
0.134 (4.30)**
0.133 (4.02)**
0.1 (2.87)**
0.096 (2.88)**
0.096 (2.87)**
Mother's education
Junior high school 0.25
(4.87)**
0.25 (4.87)**
0.249 (4.87)**
0.221 (4.52)**
0.219 (4.49)**
0.219 (4.49)**
High school or more 0.275
(4.57)**
0.274 (4.52)**
0.275 (4.58)**
0.206 (3.72)**
0.206 (3.66)**
0.206 (3.67)**
No. of food items missed -0.003
(0.30)
-0.002 (0.16)
-0.002 (0.15)
Health fund 0.141
(2.31)*
0.14 (2.27)*
0.137 (2.23)*
Household sanitation
Drinking water -0.029
(0.40)
-0.029 (0.41)
-0.029 (0.40)
Own toilet 0.061
(1.18)
0.062 (1.20)
0.063 (1.22)
Sewage -0.119
(2.34)*
-0.118 (2.32)*
-0.119 (2.33)*
Garbage disposal 0.302
(3.39)**
0.302 (3.39)**
0.303 (3.40)**
Store perishable food in a refrigerator 0.117
(1.41)
0.118 (1.42)
0.118 (1.43)
Family death 0.07
(0.96)
No. of Obs. 10,108 10,108 10,108 10,108 10,108 10,108
Notes: Food items include sweet potatoes, eggs, fish, meat/poultry, milk, vegetables, bananas, papayas, carrots, and mangoes. “Family death” equals 1 if a householder or other family member died over the past five years. Other variables included in the regressions are: dummy variables for age, sex, living in urban area, whether the child has two parents in the household, missing maternal education, and the relationship between the survey respondent and the child and thirteen provincial dummies, with Jakarta as the omitted category. Estimates are weighted using individual sampling weights. Absolute values of robust z-statistics are reported, taking into account the clustering of observations by community area. * significant at 5%; ** significant at 1%.
Source: Third wave of Indonesian Family Life Survey, 2000.
protective effect of health fund coverage is statistically significant at the 5% level.16
16To the extent that morbidity increases the demand for the health fund, its coefficient is downward biased. The positive and significant health fund coverage impact is consistent with the results of Currie
Likewise, controlling for the variables on household sanitation reduces the coefficient of log of equivalized expenditure from 0.136 to 0.1. They are, taken as a whole, statistically significant at less than the 1% level.17 Finally, when all of the variables for children’s nutrition, household sanitation, and the utilization of medical care are controlled for, the coefficient on the log of equivalized expenditure declines from 0.136 to 0.096 in the fifth column of Table 5. Therefore, although both nutrition and the utilization of medical care help to explain the protective role of economic resources, it is household sanitation that explains the greater part.
Nevertheless, a still positive and statistically significant coefficient of log of equivalized expenditure when all of the variables above are controlled for indicates that there still remain other unmeasured factors.18 The last column of Table 5 examines another potential intermediary factor, which is family health status.
Children’s health may be affected by family health due to shared living environmental factors and/or a genetic tie between parents and children (Case et al.
2002). We use answers to the IFLS3 question on the death of a householder or other family member over the past five years. The variable of family death equals 1 if a householder or a family member died over the past five years and 0 otherwise.19 However, the coefficient on the family death shows a positive sign and is not statistically significant. Also, its inclusion in the model has no effect on other coefficients of interest.
Ⅳ
. Conclusions
Case et al. (2002) showed with U.S. data that the relationship between income and adult health has antecedents in childhood. Currie and Stabile (2003) showed with Canadian data that the health of children with a low socioeconomic status worsens with age because they are subject to more health shocks. We used data from the Indonesian Family Life Survey to show that economic resources as measured by equivalized expenditure have a statistically significant positive effect on child health and protect children from acute health conditions in Indonesia.
Case et al. examined insurance, health at birth, the genetic tie between parents and children, and a number of health behaviors to identify the mechanisms that underlie the relationship between income and child health. Currie and Stabile
and Gruber (1996), but not with those of Newhouse (1993).
17Note that the coefficient on sewage shows an unexpected (statistically significant) negative sign. This may be due to the plausible correlation among the household sanitation variables, because it seems unlikely that living in a household that uses a flowing drainage ditch has a negative effect on children’s health. When the sewage variable alone is included in the estimation, apart from all other household sanitation variables, its coefficient still keeps its negative sign but becomes statistically insignificant.
18Note that provincial dummies are included in all of the estimations. Mellor and Milyo (2002) argue that these dummies control for regional variations in access to health services, practice patterns of health care suppliers, environmental and behavioral risk factors, or social norms regarding diet and exercise.
19About 6.5% of the children live in a household in which the householder died over the past five years.
argued that it is important to understand the reasons that there are more health shocks among children who live in low-income families. We examined children’s nutrition, household sanitation, the utilization of medical care, and family health status to this purpose. Consequently, economic resources are found to have a sizable and significant effect on these potential intermediary factors, and that they, particularly household sanitation, partly explain the protective role of economic resources in child health. Therefore, the results indicate that health policy for children in poor households should focus on improving household sanitation as well as on increasing access to medical care. Nonetheless, it remains important to investigate other unexamined factors that underlie the relationship between income and child health, as there still remains a positive and statistically significant (although smaller) effect of economic resources on child health even when all of the factors above are controlled for.