• 검색 결과가 없습니다.

Factors Associated or Related to with Pathological Severity of Nonalcoholic Fatty Liver Disease

N/A
N/A
Protected

Academic year: 2021

Share "Factors Associated or Related to with Pathological Severity of Nonalcoholic Fatty Liver Disease"

Copied!
8
0
0

로드 중.... (전체 텍스트 보기)

전체 글

(1)

INTRODUCTION

Nonalcolic fatty liver disease (NAFLD) is a disorder of a wide spectrum of symptoms including those of simple steatosis without any inflammation or fibrosis, steatosis with nonspecific inflammation, and steatosis accompanied by inflammation and fibrosis, namely nonalcoholic steatohepatitis (NASH)

1-3)

. NASH is a kind of hepatitis with pathologic findings similar to those of alcoholic hepatitis in nonalcoholics

1, 2)

. Since Ludwig and collea-

gues for the first time described this disease in 1980

4)

, the seriousness of this disorder has been being increasingly recogni- zed, because it may progress to cirrhosis, hepatic failure, and even hepatocellular carcinoma

5-8)

. Several conditions such as an advanced age, obesity, DM or insulin resistance, hyperlipidemia, and female gender have been reported as predisposing factors in this disorder

1, 4, 9-12)

. And in several articles

3, 6, 13-15)

, a few conditions, such as an advanced age, type II DM, obesity, and increased AST/ALT ratio have been reported to be the

Factors Associated or Related to with Pathological Severity of Nonalcoholic Fatty Liver Disease

Kyung Sik Park, M.D., Yeong Seok Lee, M.D., Heo Won Park, M.D., Sang Hyuck Seo, M.D., Byung Guk Jang, M.D., Jun Young Hwang, M.D.,

Kwang Bum Cho, M.D., Jae Seok Hwang, M.D., Sung Hoon Ahn, M.D., Yu Na Kang, M.D.* and Gap Chul Kim, M.D.

Departments of Internal Medicine, Pathology* and Diagnostic Radiology

, Keimyung University School of Medicine, Daegu, Korea

Background : Nonalcoholic fatty liver disease (NAFLD) has been more and more often regarded as a serious disorder, because nonalcoholic steatohepatitis (NASH), a part of NAFLD, may progress to the end stage of liver disease. Though an advanced age, obesity, diabetes mellitus (DM) etc. being not infrequent conditions in Korea, are known to exacerbate the severity of this disease, there are only a few Korean reports on this subject. The purpose of this study is to identify possible factors that might add up to the pathological severity of this disorder in Korean patients.

Methods : Of 60 patients with steatosis found at liver biopsy, 43 NAFLD patients were reviewed retrospectively after exclusion of other liver diseases.

Results : The cases of steatosis were mild, moderate, and severe in 9, 10, and 24 patients, respectively.

The degree of necroinflammatory activity was mild, moderate, and severe in 33, 9, and 1 patients, respectively. There were no established factors directly related to these classes. As to fibrosis, the cases were classified as none, mild, moderate, severe, and cirrhotic in 9, 11, 16, 7, and 0 patients, respectively.

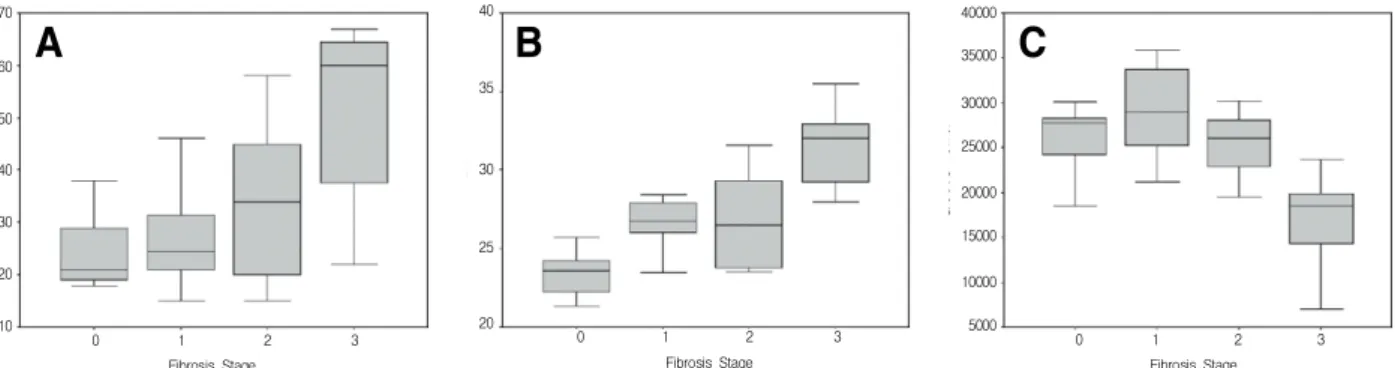
The stage of fibrosis correlated with the age (p<0.001), BMI (body mass index) (p=0.032), and the platelet count (p=0.009), but the presence of NASH was associated only with BMI (p=0.002) and obesity (p=0.001).

Conclusion : It seems that there are no factors that are directly related to the degree of steatosis or necroinflammatory activity. BMI seems to be a unique factor directly related to both the severity of fibrosis and the presence of NASH. The age and the platelet count are factors that are directly related to the degree of fibrosis but not to the presence of NASH.

Key Words : Fatty liver, Hepatitis, Fibrosis

∙Received : August 25, 2003

∙Accepted : November 13, 2003

∙Correspondence to : Kyung Sik Park, M.D., Department of Internal Medicine, Dongsan Medical Center, 194, Dongsan-dong, Jung-gu, Daegu, 700-712, Korea Tel : 82-53-250-7088, FAX : 82-53-250-7434, E-mail : [email protected]

(2)

conditions that can lead to the development of severe fibrosis.

There have been only few Korean reports

16, 17)

on this subject, and the results are not fully consistent with those of other reports. The aim of this study was to identify possible factors that may influence the pathological severity, such as steatosis, inflammation, and fibrosis in Korean NAFLD patients.

MATERIALS AND METHODS

1. Patient Population

Reports of 933 liver biopsies which were done between year 1998 and 2002 were analysed retrospectively. Different degrees of steatosis were found in 60 patients at microscopic examination, and, finally, 43 patients with NAFLD were reviewed after clinical exclusion of liver diseases, such as alcoholic liver disease, viral hepatitis, autoimmune hepatitis, drug-induced hepatitis, primary biliary cirrhosis, Wilson's disease, hemochromatosis, biliary obstruction, secondary nonalcoholic steatohepatitis, etc. The alcohol intake below 40 g/week was applied as a criterion for exclusion of alcoholic liver disease. Patients who had experien- ced gastrointestinal surgery or taken drugs

1, 3)

which may in- duce hepatic steatosis, such as corticosteroids, estrogens, metho- trexate, tetracycline, calcium channel blockers, or amiodarone were excluded.

2. Methods

Liver biopsy was done with employment of ultrasonography in all patients, stained with hematoxylin-eosin and Masson's trichrome. All biopsy specimens were reviewed again by one pathologist. The grading and staging system proposed by Brunt and et al.

18)

was used to classify the severity of the disease;

i.e., the degree of steatosis was graded as 1 (mild), 2 (moderate), and 3 (severe), based on the percent of hepatocytes in the given biopsy specimen. The necroinflammatory activity was also graded as 1 (mild), 2 (moderate), and 3 (severe).

Because there was only one patient whose necroinflammatory activity was graded 3 in this study, the comparison was done between two groups, "grade 1" and "grade 2 or more," for the purpose of the statistical processing. Fibrosis was classified into stages 0 (none), 1 (pericellular or perisinusoidal), 2 (periportal), 3 (bridging), and 4 (cirrhosis). The disease entity "NASH" was considered only when, at least, minimal fibrosis was present, and other cases were considered as "simple steatosis"

regardless of the necroinflammatory activity. Presence of Mallory's hyaline was reported in all specimen. Age, gender, body mass index (BMI), presence of DM or hypertension, serum or blood tests, such as the white blood cell count (WBC), hemoglobin (Hb), platelets, total protein, albumin, total and direct bilirubin, alkaline phosphatase (ALP), aspartate

transaminase (AST), alanine transaminase (ALT), AST/ALT ratio, triglyceride (TG), cholesterol, high density lipoprotein (HDL), low density lipoprotein (LDL), prothrombin time (PT) prolongation, partial thromboplastin time (PTT), type IV collagen, and hyaluronic acid level were reviewed. The patient was considered obese when BMI exceeded 25 and DM case, if there was a documented administration of oral hypoglycemic agents or insulin, with the fasting glucose level exceeding 125 mg/dL on 2 occasions, or random glucose level exceeding 200 mg/dL. Hypertension was considered when the patient had been taking antihypertensive medicine or when diastolic blood pressure exceeding 90 mmHg or systolic blood pressure excee- ding 140 mmHg was noted more than on 2 separate days.

3. Statistical analysis

The SPSS statistical package 11.0 (SPSS Inc., Chicago, IL., U.S.A.) was used for the statistical analysis. All the data were summarized by mean±SD (standard deviation) for continuous variables and by frequency or percentage for categorical variables. The values of the variables were compared among each grades of steatosis and the necroinflammatory activity.

The comparison was also done in respect of each stage of fibrosis and between the groups of simple steatosis and NASH.

The univariate analysis was performed using Mann-Whitney test for comparison of two groups and Kruscal-Wallis test for more than two groups. Chi-square test was used for comparison of the frequency data. Values of p less than 0.05 were considered as "significant" and values of p between 0.05 to 0.1 were considered as "tending to significant" statistically.

The multiple regression analysis was used to identify the independent effects of significant variables on steatosis, the necroinflammatory activity, and fibrosis.

RESULTS

1. Patients' demographic and basic laboratory data The main clinical and laboratory data of the patients of the study are summarized in Table 1. Thirty four (79.1%) patients were male. The mean age was 32.9 years. Mean BMI was 26.8, and the obese patients, whose BMI exceed 25.0, were thirty (69.8%). Three (7.0%) patients had DM and six (14.0%) patients had hypertension. Only three (7.0%) patients had AST/ALT ratio above 1.

2. Histologic findings

The biopsy findings are summarized in Table 2. The grades

of steatosis were 1 in 9 (20.9%), 2 in 10 (23.3%), and 3 in 24

(55.8%) patients, respectively. The grades of the necroin-

flammatory activity were 1, 2, and 3 in 33 (76.8%), 9 (20.9%),

(3)

and 1 (2.3%) patients, respectively. There were 9 (20.9%) sim- ple steatosis and 34 (79.1%) NASH patients. The ostages of fibrosis were 0 in 9 (20.9%), 1 in 11 (25.6%), 2 in 16 (37.2%), and 3 in 7 (16.3%) patients, respectively. There were no patients with fibrosis stage 4. Mallory bodies were found in 7 (16.3%) patients.

3. Factors associated with the degree of steatosis, necroinflammatory activity, and fibrosis

In the univariate analysis (Table 3), there was a significant difference in the direct bilirubin concentration among the 3 grades groups of steatosis (p=0.025), but the mean levels were within the normal range. The degree of steatosis by DM (p=0.076), total bilirubin concentration (p=0.055), AST (p=0.057), and serum cholesterol level (p=0.064). None of these variables were significant independently in the multivariate analysis.

Though the patients of the advanced age (p=0.082) and low hemoglobin concentration (p=0.056) showed a tendency to have Figure 1. The distribution of age (A), BMI (B), and platelet count (C) according to the stage of fibrosis. In all three above variables, the statistically significant differences were taken from radically different values of the stage 3 group.

0 1 2 3

Fibrosis Stage 10

20 30 40 50 60 70

0 1 2 3

Fibrosis Stage 20

25 30 35 40

0 1 2 3

Fibrosis Stage 5000

10000 15000 20000 25000 30000 35000 40000

A B C

Table 1. Patient demographics and basic laboratory data (n=43)

Variables Value/Number

Age (years) Gender (Male) BMI

Obesity (BMI>25) Diabetes mellitus (+) Hypertension (+) WBC (/mm3) Hb (g/dL)

Platelet (X1000/mm

3

) Protein (g/dL) Albumin (g/dL) T-Bilirubin (mg/dL) D-Bilirubin (mg/dL) ALP (IU/L) AST (IU/L) ALT (IU/L) AST/ALT ratio (>1) TG (mg/dL) Chol (mg/dL) HDL (mg/dL) LDL (mg/dL)

Type IV collagen (ng/mL)*

Hyaluronic acid (ng/mL)*

32.9±15.8 34 (79.1%) 26.8±3.5 30 (69.8%)

3 (7.0%) 6 (14.0%) 7206±1437

14.7±1.4 255±63

7.5±0.6 4.7±0.4 0.9±0.4 0.3±0.2 93.8±51.8 72.6±39.4 133.8±71.4 3 (7.0%) 190.8±93.7 189.3±31.6 41.4±8.1 134.6±34.7

4.3±1.6 25.6±5.2

All values are described as mean±SD. BMI, body mass index;

WBC, white blood cell; Hb, hemoglobin; ALP, alkaline phospha- tase; AST, aspartate aminotransferase; ALT, alanine aminotrans- ferase; TG, triglyceride; Chol, cholesterol; HDL, high density li- poprotein; LDL, low density lipoprotein

*Total number of subject is 18.

Figure 2. ROC curve for diagnosis of NASH with BMI. Cut-off BMI value of 26.0 was relevant for theto diagnosis of NASH, with sensitivity and specificity of 76% and 89%, respectively (BMI : body mass index).

1-Specificity BMI score of 28.0 is cut-off value

0.00 .25 .50 .75 1.00

0.00 .25 .50 .75 1.00

ROC Curve

(4)

a more severe activity, there were no independent factors which could be regarded as directly associated with the degree of the necroinflammatory activity (Table 4).

Age (p=0.034), BMI (p<0.001), obesity (p=0.011), and the platelet count (p=0.001) showed a significant correlation with the stage of fibrosis in the univariate analysis (Table 5). Of them, age (p=0.032), BMI (p<0.001), and the platelet count (p=0.009) also showed a significant correlation with the stage of fibrosis in the multivariate analysis (Table 6). The significant difference results from the different values of the stage 3 group by the different values of the stage 3 group (Figure 1).

4. Factors associated with NASH

When compared by the presence of NASH, BMI (p=0.002) and obesity (p=0.001) were related to the presence of it in the univariate analysis (Table 7). With the cut-055 BMI value of 26.0 in diagnosing NASH, the sensitivity and specificity was 76% and 89%, respectively (Figure 2).

Table 2. Histologic data of the study group (n=43)

Number of Patients Grade of steatosis

1 2 3

Grade of necroinflammatory activity 1

2 3

Stage of fibrosis 0

1 2 3 4

Mallory bodies

9 (20.9%) 10 (23.3%) 24 (55.8%)

33 (76.8%) 9 (20.9%) 1 (2.3%)

9 (20.9%) 16 (37.2%) 11 (25.6%) 7 (16.3%) 0 (0.0%) 7 (16.3%)

Table 3. Univariate comparison among groups according to the degree of steatosis

Grade of steatosis

1 2 3 p value

N

Age (years) Gender (Male) BMI

Obesity (BMI>25) Diabetes mellitus (+) Hypertension (+) WBC (/mm3) Hb (g/dL)

Platelet (X1000/mm3) Protein (g/dL) Albumin (g/dL) T-Bilirubin (mg/dL) D-Bilirubin (mg/dL) ALP (IU/L) AST (IU/L) ALT (IU/L) AST/ALT ratio (>1) TG (mg/dL) Chol (mg/dL) HDL (mg/dL) LDL (mg/dL)

Type IV collagen (ng/mL)*

Hyaluronic acid (ng/mL)*

Necroinflammatory grade Fibrosis stage

Mallory body (+)

9 42.7±18.7 7 (77.8%) 25.7±2.7 5 (55.6%) 2 (22.2%) 1 (11.1%) 7054±1799

14.1±1.2 243±77.4

7.8±0.8 4.5±0.4 0.9±0.4 0.3±0.2 86.8±30.6 72.6±49.0 126.2±71.1 0 (0%) 169.2±73.8 192.2±38.5 42.2±2.9 135.9±44.3

3.4±0.8 28.3±5.7 1.33±0.71 1.44±1.13 4 (25%)

10 31.7±16.8 8 (80.0%) 27.1±5.2 6 (60.0%) 1 (10.0%) 0 (0%) 7397±1345

14.8±1.5 244±68.1

7.5±0.7 4.6±0.4 1.1±0.5 0.4±0.2 107.6±90.9

57.0±37.7 125.1±85.3 0 (0%) 168.2±100.9 169.6±28.5

40.1±7.4 117.2±34.2

4.4±1.1 26.8±1.8 1.20±0.42 1.40±1.08 1 (9.1%)

24 29.7±13.2 19 (79.2%) 27.1±2.9 19 (79.2%)

0 (14.3%) 5 (20.8%) 7184±1382

14.9±1.4 264±55.3

7.5±0.5 4.7±0.4 0.8±0.2 0.3±0.1 90.6±35.0 92.1±51.3 140.3±67.8 3 (12.5%) 205.6±97.0 196.5±27.6 41.8±9.5 141.2±31.2

4.6±2.1 24.0±6.4 1.25±0.44 1.33±0.96 2 (28.6%)

0.176 0.993 0.668 0.314 0.076 0.269 0.838 0.317 0.822 0.555 0.145 0.056 0.025 0.555 0.057 0.760 0.279 0.460 0.064 0.901 0.361 0.262 0.588 0.952 0.972 0.769 All values are described as mean±SD. BMI, body mass index; WBC, white blood cell; Hb, hemoglobin; ALP, alkaline phosphatase;

AST, aspartate aminotransferase; ALT, alanine aminotransferase; TG, triglyceride; Chol, cholesterol; HDL, high density lipoprotein;

LDL, low density lipoprotein

*Total number of subject is 18.

(5)

DISCUSSION

The pathologic findings of NASH are similar to those in alcoholic hepatitis

1)

, but there are some inconsistencies in the diagnosis of this disease due to different diagnostic criteria applied in the studies, on which the reports have been pub- lished. Although some studies used expanded criteria, which require only nonspecific inflammation combined with steatosis, to diagnose NASH

3, 5, 11, 19, 20)

, other studies used criteria which impose strictly specific conditions, such as hepatocyte balloo- ning degeneration, fibrosis, and neutrophilic infiltration with or without Mallory hyaline

2, 4, 6, 9, 10)

. In previously published two Korean studies

16, 17)

, the expanded criteria were used to diagnose NASH. In this study, we used only strictly specific criteria to diagnose NASH, because recent studies report that the prognosis of NAFLD patients differs considerably in respect to the presence of fibrosis

1-3)

. We considered three factors proposed by the Brunt et al.

18)

to describe the histology of NAFLD as variables representing the severity of this disease.

They are the grades of steatosis, the grades of the necroin-

flammatory activity, and the stage of fibrosis. Then several clinical and laboratory factors which effect the degree of each variable were analyzed.

In general, several conditions, such as obesity, DM or insulin resistance, hyperlipidemia, hypertension, and other metabolic disorders have been known as causes of steatosis

1, 4, 9-12, 22, 23)

. But in this retrospective study, the influence of the above factors on the development of steatosis couldn't be analyzed, because there was no control group.

Although in many published articles

23-25)

, the serum transa- minase level, such as AST or ALT, has been reported to strongly correlate with the degree of the necroinflammatory activity in liver diseases, but report with different also exist

26)

. In several reports, the correlation between the serum transami- nase level and the necroinflammatory activity was poor or absent

18, 27)

. Our study also shows no statistically significant fac- tors, which effect the degree of the necroinflammatory activity.

Several conditions, such as obesity, type 2 DM or insulin resistance, an advanced age, and an increased AST/ALT ratio have been identified as risk factors of the development and pro-

Table 4. Univariate comparison among groups according to the degree of necroinflammatory activity

Grade of necroinflammatory activity

1 Above 2 p value

N

Age (years) Gender (Male) BMI

Obesity (BMI>25) Diabetes mellitus (+) Hypertension (+) WBC (/mm

3

) Hb (g/dL)

Platelet (X1000/mm

3

) Protein (g/dL) Albumin (g/dL) T-Bilirubin (mg/dL) ALP (IU/L) AST (IU/L) ALT (IU/L) AST/ALT ratio (>1) TG (mg/dL) Chol (mg/dL) HDL (mg/dL) LDL (mg/dL)

Type IV collagen (ng/mL)*

Hyaluronic acid (ng/mL)*

Steatosis grade Fibrosis stage Mallory body (+)

33 30.1±13.8 28 (84.8%) 26.6±3.6 22 (66.7%)

1 (3.0%) 4 (12.1%) 7110±1309

14.9±1.4 257±57.6

7.6±0.6 4.7±0.4 0.9±0.4 87.6±37.6 69.3±38.2 137.5±75.6 2 (6.1%) 194.8±98.1 189.5±30.4 40.1±7.2 137.0±32.7

4.6±1.4 26.5±2.6 2.33±0.82 1.21±0.99 4 (12.1%)

10 42.0±19.0 5 (15.2%)

27.7±3.0 8 (80.0%) 2 (20.0%) 2 (20.0%) 7523±1842

14.0±1.4 247±80.0

7.3±0.5 4.6±0.3 0.8±0.2 114.2±82.9

83.3±43.5 121.6±56.9 1 (10.0%) 177.3±81.0 188.6±36.9 45.9±9.5 126.8±42.2

3.4±2.4 22.6±10.4 2.40±0.84 1.90±0.88 3 (30.0%)

0.082 0.177 0.249 0.696 0.130 0.611 0.561 0.056 0.561 0.286 0.944 0.452 0.341 0.273 0.640 0.558 0.862 0.854 0.120 0.307 0.382 0.645 0.832 0.072 0.325

All values are described as mean±SD. BMI, body mass index; WBC, white blood cell; Hb, hemoglobin; ALP, alkaline phosphatase; AST, aspartate aminotransferase; ALT, alanine aminotransferase; TG, triglyceride; Chol, cholesterol; HDL, high density lipoprotein; LDL, low density lipoprotein

*Total number of subject is 18.

(6)

gression of fibrosis in a number of previous reports

3, 6, 13-15, 28, 29)

. In Korea, BMI was reported as a unique factor, which was associated with the development of fibrosis in both two previous reports,

16, 17)

and a low ALT level, besides BMI, was reported to add up to the severity of fibrosis in one report

16)

. Our results are consistent with those of previous Korean reports in the stipulation that BMI is a unique factor, which influences the development of fibrosis. The cut-off BMI value of 26.0 was relevant for the diagnosis of NASH with the sensitivity and specificity of 76% and 89%, respectively. In terms of the severity of fibrosis, our results are not consistent with previous Korean reports in respect of age, platelet count, and ALT level.

Though a low platelet count appeared to be related to the seventy of fibrosis, only one patient with severe fibrosis showed thrombocytopenia in our study. As the disease progresses from mild fibrosis to cirrhosis, the platelet count is known to decre- ase due to the disturbed thrombopoietin synthesis in viral hepatitis

30)

. Further studies seems to be needed to assess the application of this phenomenon in NAFLD or NASH. The two laboratory variables, which are known to strongly correlate with the degree of fibrosis, type IV collagen and hyaluronic acid, were examined only in 18 patients. Being not statistically significant as they are, the values of these variables tend to be high in the fibrosis stage 3 group.

Table 5. Univariate comparison among groups according to the degree of fibrosis

Stage of Flbrosis

0 1 2 3 p value

N

Age (years) Gender (Male) BMI

Obesity (BMI>25) DM (+)

Hypertension (+) WBC (/mm3) Hb (g/dL)

Platelet (X1000/mm

3

) Protein (g/dL) Albumin (g/dL) T-Bilirubin (mg/dL) ALP (IU/L) AST (IU/L) ALT (IU/L) AST/ALT ratio (>1) TG (mg/dL) Chol (mg/dL) HDL (mg/dL) LDL (mg/dL)

Type IV collagen (ng/mL)*

Hyaluronic acid (ng/mL)*

Steatosis grade Necroinflammatory grade Mallory body (+)

9 27.1±12.6 8 (88.9%) 23.5±3.3 2 (22.2%) 0 (0%) 1 (11.1%) 7775±876 15.3±1.0

263±55.7 7.6±0.6 4.7±0.3 0.9±0.5 99.0±41.1 54.8±14.4 136±73 1 (11.1%)

218±116 193±36 41.0±6.4

142±42 3.9±1.8 26.6±2.1 2.33±0.87 1.00±0.00 0 (0%)

16 27.5±9.9 14 (87.5%)

26.6±1.6 14 (87.5%)

1 (6.3%) 2 (12.5%) 6966±1164

14.9±1.5 290±46.5

7.5±0.7 4.6±0.4 1.0±0.4 91.2±67.1 72.5±44.0 125±67 2 (12.5%)

158±80 180±30 39.1±7.7

132±36 3.9±2.0 25.0±6.9 2.37±0.81 1.25±0.45 4 (25%)

11 34.2±16.0 8 (72.7%) 26.9±3.0 7 (63.6%) 1 (9.1%)

0 (0%) 7719±1586

14.3±1.4 252±37.5

7.4±0.7 4.7±0.4 0.8±0.1 95.5±51.1 74.8±36.3 142±65

0 (0%) 210±96 207±28 45.6±9.8

146±27 5.0±0.5 25.6±1.1 2.45±0.82 1.27±0.47 1 (9.1%)

7 50.4±19.2 4 (57.1%) 31.4±2.7 7 (100%) 1 (14.3%) 3 (42.9%) 6219±1892

14.2±1.7 168±57.3

7.5±0.6 4.6±0.4 0.9±0.3 90.3±28.3 92.1±51.3 137±101

0 (0%) 192±93 179±29 40.4±7.1

113±30 5.2 30.1 2.14±0.90 1.57±0.79 2 (28.6%)

0.034 0.087 0.000 0.011 0.263 0.306 0.102 0.170 0.001 0.901 0.603 0.787 0.526 0.559 0.867 0.196 0.485 0.122 0.385 0.178 0.566 0.420 0.872 0.207 0.354 All values are described as mean±SD. BMI, body mass index; WBC, white blood cell; Hb, hemoglobin; ALP, alkaline phosphatase;

AST, aspartate aminotransferase; ALT, alanine aminotransferase; TG, triglyceride; Chol, cholesterol; HDL, high density lipoprotein;

LDL, low density lipoprotein

*Total number of subject is 18.

Table 6. Multiple regression analysis about the association between the degree of fibrosis and related variables

value Regression Coefficient SE of Regression Coefficient F value Significance

BMI Age Platlet R

2

0.536 0.241 -0.300 0.583

0.030 0.007 0.000

26.978 4.920 7.640

0.000

0.032

0.009

(7)

CONCLUSION

No significant factors related to the severity of steatosis and the necroinflammatory activity seem to have been found, but BMI, age, and platelet count may have a certain value for the prognosis of the development and progress of fibrosis.

REFERENCES

1) Feldm an M , Friedm an LS, S leisenger M H . S leisenger & Fordtran's gastrointestinaland liver disease. 7th ed. p.1393, Philadelphia, S aun- ders, 2002

2) S chiff E R , O rrellM F, M addrey W C .S chiff's diseases of the liver.9th ed. p.1261, P hiladelphia, Lippincott W illiam s & W ilkins, 2003 3) A ngulo P , Keach JC , Batts K P ,Lindor KD .Independent predictors of

liver fibrosis in patients w ith nonalcoholic steatohepatitis. H epatology 30:1356-1362, 1999

4) Ludw ig J, Viggiano TR , M cG illD B, O h BJ.N onalcoholic steatohepa- titis: M ayo C linic experiences w ith a hitherto unnam ed disease. M ayo C lin P roc 55:434-438, 1980

5) Bacon B R , Farahvash M J, Janny C G , N euschw ander-Tetri BA . N onalcoholic steatohepatitis: an expanded clinical entity. G astroen- terology 107:1103-1109, 1994

6) M atteoni C A, Younossi ZM , G ram lich T, Boparai N , Liu YC , M c- C ullough AJ. N onalcoholic fatty liver disease: a spectrum of clinical and pathological severity. G astroenterology 116:1413-1419, 1999 7) M arrero JA , Fontana R J, S u G L, C onjeevaram H S, E m ick D M , Lok

AS . N AFLD m ay be a com m on underlying liver disease in patients w ith hepatocellular carcinom a in the U nited States. H epatology 36:

1349-1354, 2002

8) Bugianesi E , Leone N , V anni E , M archesini G , Brunello F, C arucci P, M usso A , de P aolis P , C apussotti L, S alizzoni M , R izzetto M . Expanding the natural history of nonalcoholic steatohepatitis: from cryptogenic cirrhosis to hepatocellular carcinom a. G astroenterology 123:134-140, 2002

9) D iehl AM , G oodm an Z, Ishak KG . Alcohollike liver disease in nonalcoholics:a clinicaland histologic com parison w ith alcohol-induc- ed liver injury. G astroenterology 95:1056-1062, 1988

10) Lee R G . N onalcoholic steatohepatitis: a study of 49 patients. H um P athol 20:594-598, 1989

11) P ow ellE E , C ooksley W G , H anson R , S earle J, H alliday JW , P ow ell LW . The natural history of nonalcoholic steatohepatitis: a follow -up study of forty-tw o patients for up to 21 years. H epatology 11:74-80, Table 7. Univariate comparison between groups according to the presence of fibrosis

Presence of fibrosis

- + p value

N

Age (years) Gender (Male) BMI

Obesity (BMI>25) Diabetes mellitus (+) Hypertension (+) WBC (/mm3) Hb (g/dL)

Platelet (X1000/mm

3

) Protein (g/dL) Albumin (g/dL) T-Bilirubin (mg/dL) ALP (IU/L) AST (IU/L) ALT (IU/L) AST/ALT ratio (>1) TG (mg/dL) Chol (mg/dL) HDL (mg/dL) LDL (mg/dL)

Type IV collagen (ng/mL)*

Hyaluronic acid (ng/mL)*

Steatosis grade

Necroinflammatory activity Mallory body (+)

9 27.1±12.6

8 (88.9%) 23.5±3.3 2 (22.2%) 0 (0.0%) 1 (11.1%) 7775±876 15.3±1.0

263±55.7 7.6±0.6 4.7±0.3 0.9±0.5 99.0±41.1 54.8±14.4 135.8±72.8 1 (11.1%) 217.7±116.5 192.9±35.6

41.0±6.4 142.7±42.2

3.9±1.8 26.6±2.1 2.33±0.87 1.00±0.00 0 (0.0%)

34 34.4±16.3 26 (76.5%)

27.7±3.0 28 (82.4%) 3 (8.8%) 5 (14.7%) 7056±1526

14.6±1.5 253±64.9

7.5±0.6 4.6±0.4 0.9±0.3 92.4±54.7 77.3±42.6 133.3±72.1 2 (5.9%) 184.1±88.3 188.4±31.0 41.5±8.6 132.5±33.2

4.4±1.7 25.5±5.5 2.35±0.81 1.32±0.54 7 (16.3%)

0.164 0.657 0.001 0.001 1.000 1.000 0.114 0.066 0.687 0.491 0.641 0.751 0.269 0.256 0.731 0.515 0.509 0.698 0.983 0.537 0.778 0.779 0.960 0.067 0.314

All values are described as mean±SD. BMI, body mass index; WBC, white blood cell; Hb, hemoglobin; ALP, alkaline phosphatase;

AST, aspartate aminotransferase; ALT, alanine aminotransferase; TG, triglyceride; Chol, cholesterol; HDL, high density lipoprotein;

LDL, low density lipoprotein

*Total number of subject is 18.

(8)

1990

12) Itoh S , Yougel T, K aw agoe K . C om parison betw een nonalcoholic steatohepatitis and alcoholic hepatitis.Am J G astroenterol82:650-654, 1987

13) R atziu V, G iral P, C harlotte F, Bruckert E , Thibault V , Theodorou I, KhalilL, Turpin G , O polon P , P oynard T. Liver fibrosis in overw eight patients. G astroenterology 118:1117-1123, 2000

14) D ay C P , Jam es O F. S teatohepatitis: a tale of tw o "hits"? G astroen- terology 114:842-845, 1998

15) Sorbi D , Boynton J, Lindor K D . The ratio of aspartate am inotrans- ferase to alanine am inotransferase: potential value in differentiating nonalcoholic steatohepatitis from alcoholic liver disease. Am J G astroenterol 94:1018-1022, 1999

16) Kim SJ, P ark JW , K im M G , K im H J, H ong YH , H an SH , Kim JG , Yoo BC ,P ark S M . C linicalpredictors reflecting the pathologic severity of nonalcoholic steatohepatitis in patients w ith nonalcoholic fatty liver.

Korean J G astroenterol 36:782-792, 2000

17) Lee D S , K w eon K T, C ho C M , Tak W Y , Kw eon YO , K im SK , C hoi YH , Bae H I. Predictive factors for the diagnosis of nonalcoholic steatohepatitis (N A SH ) and the degree of liver fibrosis in nonalcoholic fatty liver disease (N AFLD ). Korran J H epatol 9(Suppl 3):S 14, 2003 18) Brunt E M , Janney C G , di B isceglie A M , N euschw ander-Tetri B A,

Bacon B R . N onalcoholic steatohepatitis: a proposal for grading and staging the histological lesions. Am J G astroenterol 94:2467-2474, 1999

19) Bonkovsky H L, Jaw aid Q ,TortorelliK ,le C lair P ,C obb J, Lam brecht R W , Banner BF. N on-alcoholic steatohepatitis and iron: increased prevalence of m utations of the H FE gene in non-alcoholic steato- hepatitis. J H epatol 31:421-429, 1999

20) G eorge D K, G oldw urm S, M acD onald G A, C ow ley LL, W alker N I, W ard P J, Jazw inska E C , P ow ell LW . Increased hepatic iron con- centration in nonalcoholic steatohepatitis is associated w ith increased fibrosis. G astroenterology 114:311-318, 1998

21) Adler M , S chaffner F. Fatty liver hepatitis and cirrhosis in obese patients. Am J M ed 67:811-816, 1979

22) B atm an P A , Scheuer PJ. D iabetic hepatitis preceding the onset of glucose intolerance. H istopathology 9:237-243, 1985

23) C ahen D L, van Leeuw en D J, ten Kate FJ, Blok A P , O osting J, C ham uleau R A . D o serum ALAT values reflect the inflam m atory activity in the liver of patients w ith chronic viral hepatitis? Liver 16:105-109, 1996

24) P az M O , B renes F, K arayiannis P , Jow ett TP , S cheuer P J, Thom as H C . C hronic hepatitis B virus infection: viral replication and patterns of inflam m atoryactivity: serological, clinical and histological correla- tions. J H epatol 3:371-377, 1986

25) Luo JC ,H w ang SJ,LaiC R ,Lu C L, LiC P ,Tsay S H , W u JC ,C hang FY, Lee SD . R elationships betw een serum am inotransferase levels, liver histologies and virologicalstatus in patients w ith chronic hepatitis C in Taiw an. J G astroenterol H epatol 13:685-690, 1998

26) H aber M M , W est AB , H aber A D , R euben A . R elationship of am ino- transferases to liver histological status in chronic hepatitis C . Am J G astroenterol 90:1250-1257, 1995

27) S onsuz A , Basaranoglu M , O zbay G . R elationship betw een am ino- transferase levels and histopathological findings in patients w ith nonalcoholic steatohepatitis. Am J G astroenterol 95:1370-1371, 2000 28) P agano G , P acini G , M usso G , G am bino R , M ecca F, D epetris N ,

C assader M , D avid E , C avallo-P erin P , R izzetto M . N onalcoholic steatohepatitis, insulin resistance, and m etabolic syndrom e: further evidence for an etiologic association. H epatology 35:367-372, 2002 29) C hitturiS,Abeygunasekera S ,FarrellG C ,H olm es-W alker J,H uiJM ,

Fung C , K arim R , Lin R , Sam arasinghe D , Liddle C , W eltm an M , G eorge J. N ASH and insulin resistance: Insulin hypersecretion and specific association w ith the insulin resistance syndrom e. H epatology 35:373-379, 2002

30) K aw asaki T, Takeshita A , Souda K, K obayashi Y, Kikuyam a M ,

S uzuki F, Kageyam a F, S asada Y, S him izu E , M urohisa G , Koide

S , Yoshim iT, N akam ura H , O hno R .Serum throm bopoietin levels in

patients w ith chronic hepatitis and liver cirrhosis. Am J G astroenterol

94:1918-1922, 1999

수치

Table 1. Patient demographics and basic laboratory data (n=43)
Table 3. Univariate comparison among groups according to the degree of steatosis
Table 4. Univariate comparison among groups according to the degree of necroinflammatory activity
Table 5. Univariate comparison among groups according to the degree of fibrosis

참조

관련 문서

The objectives of this study is to find that whether student’s planned behaviors such as albeit, internship, getting some certification are to be related

The antagonist SH-1 was somewhat effective to control common scab in the potato field with low occurrence of the disease... acidiscabies로

The purpose of this study was to identify the frequency and related factors of advanced airway management for patients with cardiac arrest by the

The associations of hepatic steatosis and fibrosis using fatty liver index and BARD score with cardiovascular outcomes and mortality in patients with new‑onset type 2

Background: Incidence of complications related extracorporeal membrane oxygenation (ECMO) support as a bridge to lung transplantation (BTT) and its association with the

□ The least-upper-bound property (sometimes called completeness or supremum property) is a fundamental property of the real number system. The least-upper-bound

□ The least-upper-bound property (sometimes called completeness or supremum property) is a fundamental property of the real number system. The least-upper-bound

이것은 가 위로 유계가 아니라는 문제의 가정에 모순이다... 유리수의