Investigation of Aerosol Number Concentration at Gosan Site in Jeju, Korea
Chang-Hee Kang, Chul-Goo Hu
1)*Department of Chemistry, Jeju National University, Jeju 690-756, Korea
1)
Department of Environmental Engineering, Jeju National University, Jeju 690-756, Korea (Manuscript received 12 December, 2011; revised 20 December, 2011; accepted 25 January, 2012)
Abstract
The aerosol number concentration have measured with an aerodynamic particle sizer spectrometer(APS) at Gosan site in Jeju, Korea, from March 2010 to March 2011. And then the atmospheric aerosol number concentration, the temporal variation and the size distribution of aerosol number concentration have been investigated.
The aerosol number concentration varies significantly from 748 particles/㎝3 to zero particles/㎝3. The average number concentration in small size ranges are very higher than those in large size ranges. The number concentrations in the size range 0.25∼0.28 ㎛, 0.40∼0.45 ㎛ and 2.0∼2.5 ㎛ are about 84 particles/㎝3, 2 particles/㎝3 and 0.4 particles/㎝3, respectively. The number concentrations inrange of larger than 7.5 ㎛ are below 0.001 particles/㎝3.
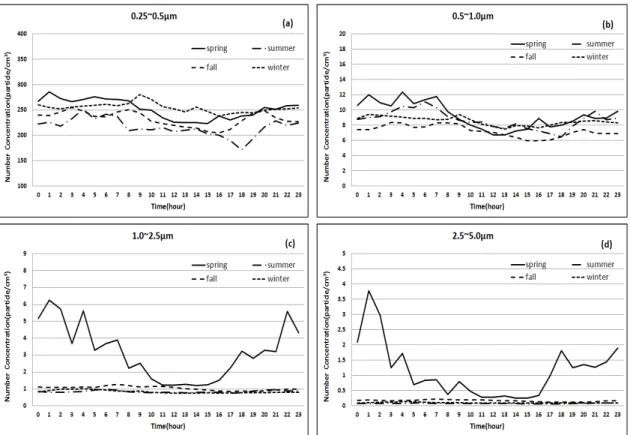
The seasonal variations in the number concentration for smaller particle(<1.0 ㎛) are not much, but the variations for larger particle are very evident. And strong amplitudes of diurnal variations of entire averaged aerosol number concentration are not observed.
Size-fractioned aerosol number concentrations are dramatically decreased with increased particle size. The size-fractioned aerosol number concentrations in size range 0.8∼4.0 ㎛ during nighttime are evidently higher than during daytime, but similar levels are appeared in other size range. The seasonal differences in the size-fractioned number concentrations for smaller size range(<0.7 ㎛) are not observed, however, the remarkable seasonal differences are observed for larger size than 0.7 ㎛.
Key Words : Aerosol, Number concentration, Seasonal variation, Diurnal variation Size-fractioned concentration, Gosan site
1)
1. Introduction
Atmospheric aerosols are emitted from a large variety of sources, thus they have various sizes, shapes and made up of hundreds of different chemicals. Aerosols have an important influence on the atmospheric visibility, irradiation balance and they also act as cloud condensation nuclei and affect precipitation patterns. Therefore atmospheric aerosols
*Corresponding author : Chul-Goo Hu, Department of Environ- mental Engineering, Jeju National University, Jeju 690-756, Korea
Phone: +82-64-754-3443 E-mail: [email protected]
play an important role in the variation of weather and climate. There is growing concern related to the human health effects of atmospheric aerosols, because of the epidemiological studies that the adverse health effects of atmospheric aerosols include respiratory irritation and changes in pulmonary function. (Vyziene and Girgzdys, 2009; Sharma et al., 2003)
The size distribution, composition, sources and
sinks of atmospheric aerosols are important parameters
in understanding and managing aerosol effects on
health, visibility and climate. The size distribution
and composition of atmospheric aerosols , especially,
are key factors in assessing these effects. Recently, there has been an increased interest in the relative health effects of particles of smaller sizes. Several researchers have also reported that the health effects of aerosols, for a given mass concentration, are larger for smaller particles.(Buzorius et al., 1999:
Stanier et al., 2004; Bigi and Ghermandi, 2011) The number concentration of small size aerosol is usually very high, but its mass concentration is relatively low. Several researches have also shown that the health effects of aerosols may be more sensitive to the number than mass concentration. (Yan et al., 2004) In spite of these facts, most of the air quality managements so far have been based on aerosol mass concentration.
Recently, a large number of observational studies on aerosol number concentrations have been performed.
The features and temporal and/or spatial variations of atmospheric aerosol number concentrations have been investigated.(Vyziene and Girgzdys, 2009;
Sharma et al., 2003; Stanier et al., 2004; Buzorius et al., 1999; Choi et al., 2005) Many studies on the relationship of aerosol number concentration and mass concentration have been performed.(Yan et al., 2004; Bigi and Ghermandi, 2011) A lot of studies on the aerosol number concentrations during Asian dust storm have been done.(Watanabe et al., 2005; Zhang et al., 2008; Chun et al., 1999) And the meteorological dependences of aerosol number concentration have been analyzed.(Paatero et al., 2005; Hussein et al., 2006) Also the number concentrations of atmospheric ultrafine aerosol have been studied.(Sharma et al., 2011; Longly et al., 2005; Minoura and Takekawa, 2005) However, few continuous measurements have been made of size-separated number concentration of atmospheric aerosol in Jeju, Korea.
In this study, we have continuously measured the aerosol number concentration with an aerodynamic particle sizer spectrometer(APS) measuring from
0.25 to 32.0㎛ from March 2010 to March 2011 at Gosan in Jeju. The temporal variation of size-separated number concentration of atmospheric aerosol and the size distribution of aerosol number concentration have been studied.
2. Materials and Methods
2.1. Monitoring site
The monitoring site, Gosan(33˚17'N, 126˚10'E), is located at the western tip of Jeju Island. The site, shown in Fig. 1, is one of the background sites in Korean Peninsula. Jeju Island is a volcanic island with peak elevation of ∼2000 m and is a major resort area with no large industrial sources. The island is located in the East China Sea, ∼100 km south of the Korea mainland, ∼250 km west of Kyshu, Japan, ∼ 500 km east-northeast of Shanghai, China. The site is about 70 m above sea and adjacent to the seashore.
Fig. 1. Location of the monitoring site and surrounding
region.2.2. Instruments and measurements
In the present research, an aerodynamic particle
sizer spectrometer(APS, GRIMM Aerosol Technik
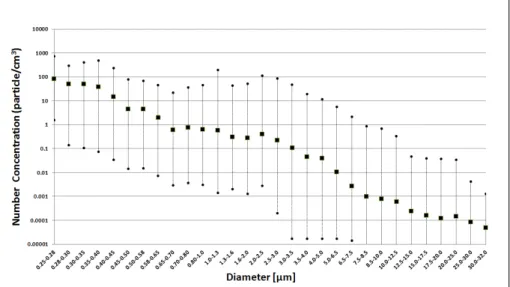
Fig. 2. The grand average aerosol number concentration measured separately in the 30 size ranges.
GmbH & Co., Model #179), which uses light scattering method, has been installed at Gosan site.
This instrument measures atmospheric aerosol number concentration in 30-channel of different size range from 0.25∼0.28 ㎛ to 30.0∼32.0 ㎛.
Atmospheric aerosols have been sampled at 3 m from the ground level and the number concentration have been measured after having removed moisture.
The measurement of the aerosol number concentration has been performed every 5 minute, from March 2010 to March 2011. The number concentration of aerosol particles have been measured separately in the 30 size ranges, such as 11-channel in range of 0.25∼1.0 ㎛, 4-channel in range of 1.0∼2.5 ㎛, 8-channel in range of 2.5∼10.0 ㎛, 7-channel in range of 10.0∼32.0 ㎛. The 1-hour averaged data of the number concentration of aerosol obtained every 5-minute from APS have been used in this study.
3. Results and Discussions
3.1. Overview of aerosol number concentration The grand average aerosol number concentrations measured separately in the 30 size ranges during the experimental period are shown in Fig. 2. From these
results, it is found that the aerosol number concentration varies significantly with particle size from 748 particles/㎝
3to zero particles/㎝
3. The average number concentrations in small size ranges are higher greatly than those in large size ranges. The average concentration is about 84 particles/㎝
3in the smallest size range (0.25∼0.28 ㎛), 15 particles/㎝
3in the size range 0.40∼0.45 ㎛, 2 particles/㎝
3in the size range 0.58∼0.65 ㎛, 0.4 particles/㎝
3in the size range 2.0∼2.5 ㎛. On the other hand, the average number concentrations of larger particles(≥7.5 ㎛) are lower than 0.001 particles/㎝
3.
The values of overall aerosol number concentrations have large differences according to measurement methods, in particular, lower limit measuring size range. In general, the values of overall aerosol number concentrations are greatly more than 10,000particles/
㎝
3in case of using the method which can measure ultrafine particles(≤100 ㎚).(Sharma et al., 2011;
Longly et al., 2005; Minoura and Takekawa, 2005)
However, in this study, the overall aerosol number
concentration in excess of 1000 particles/㎝
3has
never observed because the lower limit measuring
size range(0.25∼0.28 ㎛) is large, relatively.
The aerosol number concentrations measured in this study are low in comparison with other previous researches performed in urban area. For example, Sharma et al. has reported that the aerosol number concentrations measured in Roorkee, India, in the size range 0.3-0.5 ㎛, 1.0-2.0 ㎛ and 2.0-5.0 ㎛ are 1.5×10
4-2×10
5particles/ℓ, 1×10
3-5.6×10
3particles/
ℓ and 50-300 particles/ℓ, respectively.(Sharma et al., 2003) Also, Park et al. has reported that the aerosol number concentrations measured in Seoul, in the size range 0.3-0.5 ㎛, 0.82-2.23 ㎛, 2.23-6.06 ㎛ and 6.06-10.0 ㎛ are 32.3 particles/㎝
3, 8.5 particles/
㎝
3, 1.6 particles/㎝
3and 0.008 particles/㎝
3, respectively.(Park et al., 2001)
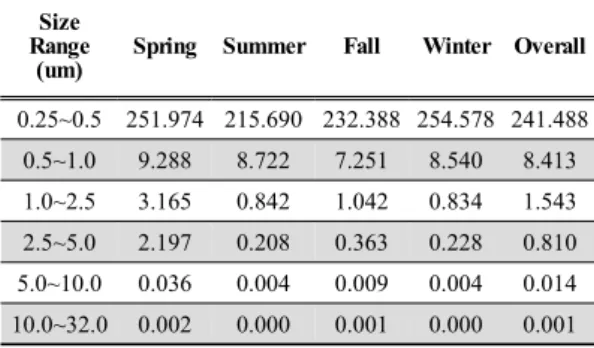
Table 1. shows the basic statistics of the number concentration in the five wide size ranges without larger range(>10 ㎛) having very low concentration.
The average concentration is about 241 particles/㎝
3in the size range 0.25∼0.5 ㎛, but the average concentration for larger particles(>0.5 ㎛) are decreased severely to lower than 10 particles/㎝
3. We can see, from these results, that the number concentration in the size range 0.25∼0.5 ㎛ has more than 96% of the number concentration of PM2.5 and/or PM10. It is well known that number concentration of particles larger than 0.5 ㎛ is very low compared to particles smaller than 0.5
㎛.(Buzorius et al., 1999) The standard deviation of the number concentration data for small particles (<0.5 ㎛) is less than the mean value of the data, on the other hand, the standard deviation for large particles(>2.5 ㎛) is greater than ten times the mean value. These results show that the number concentration for smaller particles have higher values and less variation amplitude than larger particles, relatively.
Atmospheric aerosols have size distribution from few nanometers to 100 ㎛. The aerosols of various sizes are generated by different sources, such as, coarse particles(〉2.5 ㎛) are generated from blowing
and excavation etc., but fine particles(〈2.5 ㎛) are mainly generated from traffic, combustion and secondary formation in atmosphere.(Buzorius et al., 1999; Sharma et al., 2011) In addition, aerosol number concentrations are influenced by regional and local sources and meteorological conditions. It has been assumed that the number concentration for fine mode particles have less variation than coarse particles due to the feature of measurement site with no large anthropogenic sources.
Table 1. The basic statistics of the aerosol number
concentration data in the five wide size ranges(particle/cm3)