INTRODUCTION
Marine algae inhabit about 2% of the seafloor. The presence of benthic seaweeds defines the inner continental shelf, where the marine community largely depends on the food and protection that seaweeds provide (Karleskint et al. 2006).
Marine macroalgae have also been studied to monitor and detect water pollution (Jayasekera and Rossbach 1996; Or- fanidis et al. 2001; Ballesteros et al. 2007), and they have been studied as a possible way to resolve the greenhouse
gas problem.
Many scientists and policymakers have called for adopting an entirely new approach to managing and sustaining marine biodiversity as well as the important ecological and econo- mic services provided by the seas. The primary objective of this ecosystem-based approach is to protect and sustain whole marine ecosystems for current and future generations instead of focusing primarily on protecting individual species (Miller and Spoolman 2009).
Yack Jun Chyung (Chyung 1991) was the first to initiate natural historical studies of the Southwest coast of Korea in 1814. He reported 38 algal species of Heuksan island of Wando. Kang (1966) studied the geographical distribution
─
─ 31 ─ ─
Marine Algal Flora on Goheung Coast, Korea
Bin Sun, Tae-Ho Seo, Jae Kwon Cho
1, Dae Kwon Kim
1, Soon-Ki Yun, Hyun-Soo Shin, Han Sol Lee and Jong-Ahm Shin*
Aquaculture Program, College of Fisheries and Ocean Sciences, Chonnam National University, Yeosu 550-749, Korea
1
National Fisheries Research & Development, South-west Sea Fisheries Research Institution, Yeosu 556-823, Korea
Abstract - - To understand the marine algal flora on Goheung coast, Korea, marine algae at 8 points were collected from November 2008 to February 2009 and from April to June 2009. Thirty-seven species (2 species of angiosperms, 5 chlorophytes, 12 phaeophytes, and 18 rhodophytes) occurred from fall to winter and 52 species (2 species of angiosperms, 9 chlorophytes, 18 phaeophytes, and 23 rhodophytes) occurred from spring to summer. Commonly occurring species were Ulva pertusa, Sargassum thunbergii, Hizikia fuziformis, and Gelidium amansii, and dominant species at most points were Ulva pertusa, Sargassum thunbergii, and Gelidium amansii. The average of the ratio of total rhodophytes and chlorophytes to phaeophytes ((R + + C)/P) was 1.61 in fall to winter and 1.69 in spring to summer, and the average Laminariales/Fucales/Dictyotales (LFD) ratio was 1.14 in fall to winter and 1.18 in spring to summer. These results show that the marine algal flora of Gohe- ung could be considered as temperate. The LFD ratio was fit for showing a feature of algal flora of Goheung. Species diversity index was high at Points 4~ ~6 while low at Points 1 and 8. Detrend- ed correspondence analysis (DCA) showed that the similarity of occurring species at Points 3 and 4 was higher than the other points from fall to winter, whereas the occurred species at Points 1~ ~4 were similar from spring to summer. The average values of ecological evaluation index (EEI) of the investigation points were 6.8 from fall to winter and 6.3 from spring to summer, which means that the ecological environment of the investigation points were middle class and the EEI values of outer sea points were higher than the inner bay points.
Key words : marine algal flora, intertidal zone, subtidal zone, seasonal changes
* Corresponding author: Jong-Ahm Shin, Tel. 061-659-7164,
Fax. 061-659-3169, E-mail. [email protected]
of algae in Korea. The algae and especially the Porphyra cultivation industries of Goheung are very developed, but the algal flora of this location have not been well studied.
MATERIALS AND METHODS
In order to study the resources and ecological characteris- tics of marine algae in Goheung, marine algae were collected from fall to winter (November 2008 to February 2009) and from spring to summer (April to June 2009) at 8 points on the Goheung coast (Fig. 1). The investigations of algal flora were carried out at the intertidal zone as well as the high and low parts of the subtidal zone by SCUBA diving, and a 50×50 cm quadrat was used to collect the marine algae samples (Saito and Atobe 1970; Saito et al. 1971). After the samples were transported to the lab and washed thoroughly, parts of the samples were made into dry specimens and their photos taken. The species were identified based on the information in published papers (Kang 1968; Okamura 1974;
Tseng 1983; Chihara 2004; Tanaka and Nakamura 2004;
Ohba and Miyata 2007; Lee 2008). The biomass was calcu- lated based on the wet weight (g wet weight) of the samples per unit area (m
2).
1. Relative coverage (RC), relative frequency (RF) and seasonal important value (IV)
The IV was calculated based on the RC and RF to identify the dominant species, and the formulas followed Muller-
Dombios (1974) and Yoo (1980).
Coverage (C)= =[area of the species (i)/area of the quadrat]
×100
Frequency (F)= =[the little quadrat numbers which taken by species (i)/the total subdivision of the quadrat]×100
RC= =(total C of species i/total C of all species)×100 RF= =(total F of species i/total F of all species)×100 IV= =(RC + + RF)/2
2. R/P, C/P, (R + + C)/P, L/F, LFD
The ratio of rhodophytes to phaeophytes (R/P), the ratio of chlorophytes to phaeophytes (C/P), and the ratio of total rhodophytes and chlorophytes to phaeophytes [(R + + C)/P]
were calculated to determine the characteristics of the algal flora (Feldmann 1938; Cheney 1977). If the value of (R + + C) /P is less than 3, the algal flora should be a warm or cold water type, if the value is 6 or higher, the algal flora should be a hot water type, and if the value is between 3 and 6, the algal flora should be a mixed type.
The ratio of the number of species of Laminariales to the number of species of Fucales was also calculated (Arasaki 1976). When the L/F ratio falls in the range of 0 and 0.1, the algal flora is a hot water type; when in the range of 0.2 and 0.7, the algal flora should be a warm water type; and when the ratio was higher than 0.7, the algal flora should be a cold water type. The formula of L/F was showed as follows:
L/F= =species of Laminariales numbers/species of Fucales numbers
Members of Laminariales, Fucales, and Dictyotales of brown algae can be separated into two or three groups based on their distributions. In Laminariales (L), cold and warm species groups are separated at the rank of family or genus, in Fucales (F), cold, warm, and hot water species groups at the rank of genus or subgenus, and in Dictyotales (D), warm and hot water species groups at the rank of genus (Tanaka 1997). Based on the number of species belonging to these groups, LFD was calculated for the investigation points.
The LFD index ranged between 0 and 2, since LFD was positively correlated with the water temperature; as the value of LFD approached 2, the algal flora more closely resembled a hot water algal flora. The formula of LFD was as follows:
LFD= =(C×0 + + W×1 + + H×2)/(C + + W + + H) Fig. 1. Locations of investigation points.
127� 10 ′ 127� 20 ′ 127� 30 ′
34 � 40 ′
34 � 30 ′
34� 20 ′
Goheung
1
2 3
4 6 5
7
8
where C is the number of cold water species; W is the num- ber of warm water species; H is the number of hot water species.
3. Species diversity index (H ′′ index)
The H ′ index was calculated using the Shannon-Wiener index,
H ′= = »P
iln (P
i)
where P
iis the probability of macroalgae species ‘i’ occurr- ing in the assemblage.
For this study, P
iwas equal to RB
i, which is the relative
biomass of species i (Wilhm 1968; Masson and Greig 1988;
Zhuang et al. 2004).
Table 1. Marine algae occurring from fall to winter (2008~2009)
Category Species 1 2 3 4 5 6 7 8
Halophila nipponica
++Angiospermae Phyllospadix japonicus
++ ++Total 2 0 0 0 1 0 1 1 0
Caulerpa okamurae
++Cladophora sakaii
++Chlorophyta Codium contractum
++ ++ ++Codium fragile
++ ++Ulva pertusa
++ ++ ++ ++ ++Total 5 1 1 2 2 1 1 3 1
Dictyta divaricata
++Ecklonia cava
++ ++Hizikia fusiformis
++ ++ ++ ++ ++ ++ ++Ishige okamurae
++ ++ ++ ++Ishige foliacea
++ ++Myagropsis myagroides
++ ++ ++Phaeophyta Sargassum coreanum
++Sargassum horneri
++ ++ ++ ++ ++ ++Sargassum macrocarpum
++ ++Sargassum pallidum
++ ++Sargassum thunbergii
++ ++ ++ ++ ++Sargassum yendoi
++ ++ ++ ++Total 12 4 4 6 6 5 7 5 2
Acrosorium polyneurum
++Amphiroa anceps
++ ++ ++Amphiroa beauvoisii
++ ++ ++ ++ ++Bangia atropurpurea
++Carpopeltis affinis
++ ++Chondracanthus tenellus
++ ++ ++ ++Chondria crassicaulis
++Chondrus ocellatus
++ ++ ++Chondrus pinnulatus
++ ++ ++Rhodophyta Corallina officinalis
++ ++ ++ ++Gelidium amansii
++ ++ ++ ++ ++ ++ ++ ++Gelidium pacificum
++ ++Grateloupia turuturu
++ ++ ++Peyssonnelia caulifera
++ ++Phacelocarpus japonicus
++ ++ ++Plocamium telfairiae
++ ++ ++Prionitis cornea
++Rhodymenia intricata
++Total 18 4 7 4 6 9 10 8 2
Table 2. Marine algae occurring from spring to summer (2009)
Category Species 1 2 3 4 5 6 7 8
Halophila nipponica
++Angiospermae Phyllospadix japonicus
++ ++Total 2 0 0 0 1 0 1 1 0
Caulerpa okamurae
++Cladophora japonica
++Cladophora sacaii
++Cladophora wrightiana
++Chlorophyta Codium contractum
++ ++ ++Codium fragile
++ ++Collinsiella japonica
++ ++Microdictyon nigresceus
++Ulva pertusa
++ ++ ++ ++ ++Total 9 2 1 4 2 1 1 3 3
Dictyopteris prolifera
++Dictyta divaricata
++Ecklonia cava
++ ++Ectocarpus siliculosus
++ ++Hizikia fusiformis
++ ++ ++ ++ ++ ++ ++Ishige okamurae
++ ++ ++ ++Ishige foliacea
++ ++Leathesia difformis
++ ++ ++Myagropsis myagroides
++ ++ ++Phaeophyta Padina arborescens
++Padina crassa
++Sargassum coreanum
++Sargassum horneri
++ ++ ++ ++ ++ ++Sargassum macrocarpum
++ ++Sargassum pallidum
++ ++Sargassum thunbergii
++ ++ ++ ++ ++Sargassum yendoi
++ ++ ++ ++Sphacelaria califoraica
++Total 18 5 4 7 7 7 9 6 3
Acanthopeltis sp.
++ ++Acrosorium polyneurum
++Amphiroa anceps
++ ++ ++Amphiroa beauvoisii
++ ++ ++ ++ ++Bangia atropurpurea
++Carpopeltis affinis
++ ++Chondracanthus tenellus
++ ++ ++Chondria crassicaulis
++ ++ ++Chondrus ocellatus
++ ++ ++Chondrus pinnulatus
++ ++Corallina officinalis
++ ++ ++ ++ ++Rhodophyta Gelidium amansii
++ ++ ++ ++ ++ ++ ++ ++Gelidium pacificum
++ ++Grateloupia chiangii
++Grateloupia turuturu
++ ++ ++Heterosiphonia japonica
++Lithophyllum okamurae
++ ++Peyssonnelia caulifera
++ ++Phacelocarpus japonicus
++ ++ ++Plocamium telfairiae
++ ++ ++Polysiphonia morrowii
++ ++Prionitis cornea
++ ++Rhodymenia intricata
++Total 23 4 11 4 8 10 11 10 2
4. Detrended correspondence analysis (DCA)
The program CANOCO was used to ordinate the studied points (Lepˇs and ˇSmilauer 2003). DCA was carried out as an indirect ordination method (Hill 1973; Hill and Gauch 1980;
Ter Braak 1986, 1987; Palmer 1993; Bolton et al. 2004).
5. Ecological evaluation index (EEI)
The EEI was designed to estimate the ecological status of transitional and coastal waters. Marine benthic macrophytes (marine algae, seagrasses) were used as bioindicators of ecosystem shifts due to anthropogenic stress, from the pris- tine state with late-successional species [high ecological status class (ESC)] to the degraded state with opportunistic species (bad ESC). Shifts in marine ecosystem structure and function were evaluated by classifying marine benthic macro- phytes into two ecological state groups (ESG I, II) (Orfanidis et al. 2001). The absolute abundance (%) of each ESG was estimated by coverage (%) in each sample. To evaluate the ecological status of the samples, the mean absolute abun- dance (%) of ESGs I and II was non-linearly corresponded to five different ESCs (‹2, Bad; 2⁄ to ›4, Low; ‹6 to
¤4, Moderate; ‹8 to ¤6, Good; ‹10 to ¤8, High) (Orfan-
dids et al. 2001, 2003).
RESULTS
1. Communities of marine algae
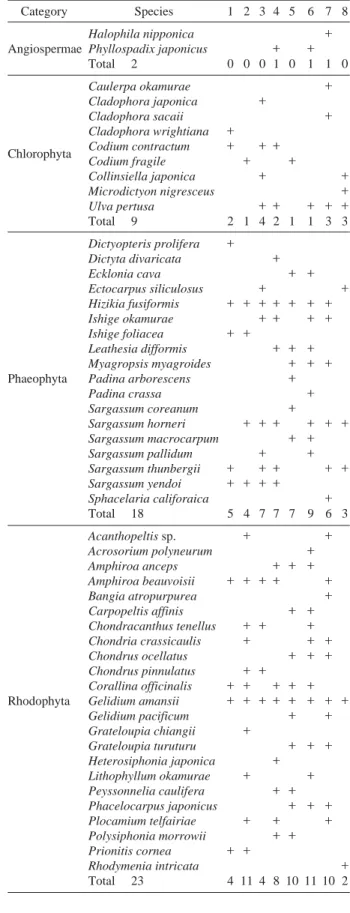
Thirty-seven species (2 species of angiosperms, 5 chloro- phytes, 12 phaeophytes, and 18 rhodophytes) occurred from fall to winter, and 52 species (2 species of angiosperms, 9 chlorophytes, 18 phaeophytes, and 23 rhodophytes) occurred from spring to summer (Tables 1 and 2).
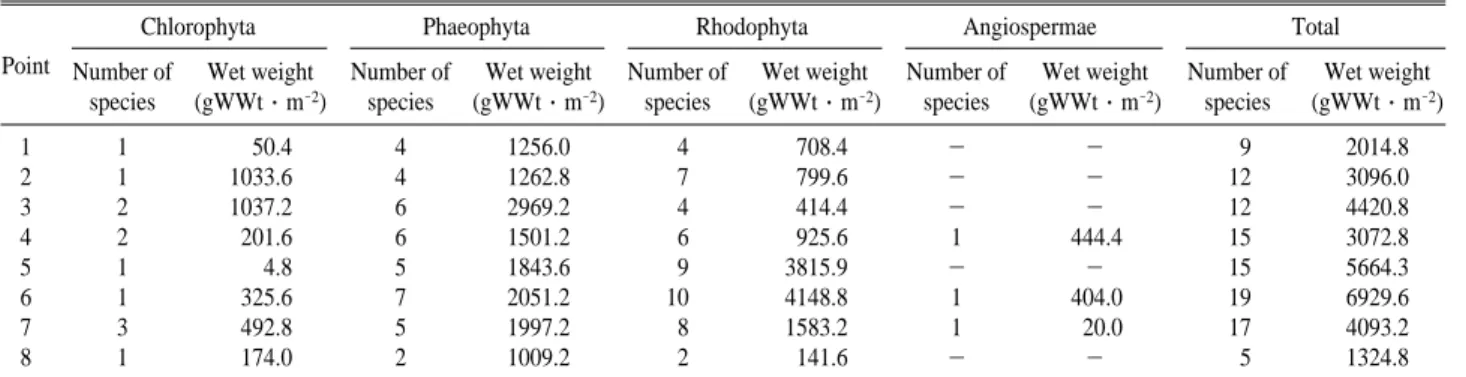
From fall to winter, the occurred species were plentiful at Point 6 (19 species) and Point 7 (17 species). The biomasses of the investigation points were 1324.8 to 6929.6 gWWt∙
m
-2at 8 investigation points, and the high-biomass species were phaeophytes such as Sargassum thunbergii and Hizikia fusiformis (Table 3).
From spring to summer, the points with more occurred species, which were Point 6 (22 species) and Point 7 (20 species), were the same from fall to winter. Biomasses were 1592.3 to 7922.8 gWWt∙m
-2, and the high-biomass species were as same from fall to winter (Table 4).
Table 3. Number of species and wet weight of marine algae from fall to winter (2008~2009)
Point
Chlorophyta Phaeophyta Rhodophyta Angiospermae Total
Number of Wet weight Number of Wet weight Number of Wet weight Number of Wet weight Number of Wet weight species (gWWt∙m
-2) species (gWWt∙m
-2) species (gWWt∙m
-2) species (gWWt∙m
-2) species (gWWt∙m
-2)
1 1 50.4 4 1256.0 4 708.4 - - 9 2014.8
2 1 1033.6 4 1262.8 7 799.6 - - 12 3096.0
3 2 1037.2 6 2969.2 4 414.4 - - 12 4420.8
4 2 201.6 6 1501.2 6 925.6 1 444.4 15 3072.8
5 1 4.8 5 1843.6 9 3815.9 - - 15 5664.3
6 1 325.6 7 2051.2 10 4148.8 1 404.0 19 6929.6
7 3 492.8 5 1997.2 8 1583.2 1 20.0 17 4093.2
8 1 174.0 2 1009.2 2 141.6 - - 5 1324.8
Table 4. Number of species and wet weight of marine algae from spring to summer (2009)
Point
Chlorophyta Phaeophyta Rhodophyta Angiospermae Total
Number of Wet weight Number of Wet weight Number of Wet weight Number of Wet weight Number of Wet weight species (gWWt∙m
-2) species (gWWt∙m
-2) species (gWWt∙m
-2) species (gWWt∙m
-2) species (gWWt∙m
-2)
1 2 147.6 5 1551.2 4 829.4 - - 11 2528.2
2 1 1188.6 4 1452.2 11 1194.6 - - 16 3835.4
3 4 1304.8 7 3473.4 4 620.1 - - 15 5398.3
4 2 231.8 7 1775.2 8 1154.5 1 511.1 18 3672.6
5 1 5.5 7 2148.1 10 4412.9 - - 18 6566.5
6 1 374.4 9 2389.1 11 4694.7 1 464.6 22 7922.8
7 3 566.7 6 2315.9 10 1695.2 1 23.0 20 4600.8
8 3 233.3 3 1196.2 2 162.8 - - 8 1592.3
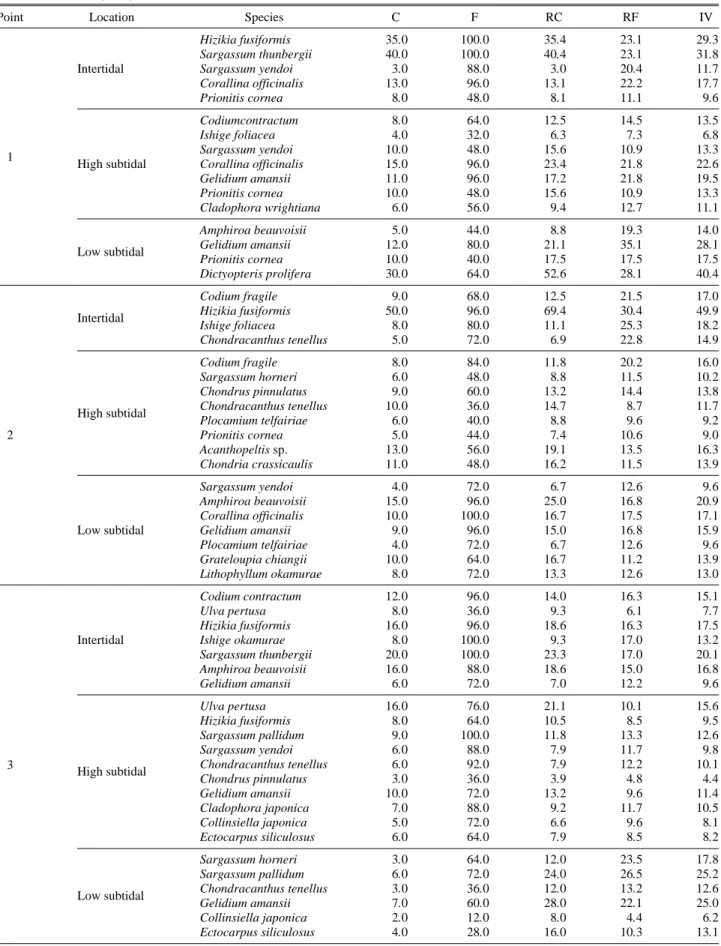
Table 5. Coverage (C), frequency (F), relative coverage (RC), relative frequency (RF), and important value (IV) of marine algae from fall to winter (2008~2009)
Point Location Species C F RC RF IV
Hizikia fusiformis 14.0 100.0 25.0 26.0 25.5
Sargassum thunbergii 26.0 100.0 46.4 26.0 36.2
Intertidal Sargassum yendoi 5.0 64.0 8.9 16.7 12.8
Corallina officinalis 9.0 88.0 16.1 22.9 19.5
Prionitis cornea 2.0 32.0 3.6 8.3 6.0
Codiumcontractum 4.0 36.0 12.1 12.7 12.4
1 Ishige foliacea 3.0 12.0 9.1 4.2 6.7
High subtidal Sargassum yendoi 5.0 40.0 15.2 14.1 14.6
Corallina officinalis 11.0 88.0 33.3 31.0 32.2
Gelidium amansii 6.0 80.0 18.2 28.2 23.2
Prionitis cornea 4.0 28.0 12.1 9.9 11.0
Amphiroa beauvoisii 3.0 64.0 21.4 32.7 27.0
Low subtidal Gelidium amansii 7.0 92.0 50.0 46.9 48.5
Prionitis cornea 4.0 40.0 28.6 20.4 24.5
Codium fragile 9.0 44.0 21.4 16.7 19.0
Intertidal Hizikia fusiformis 20.0 100.0 47.6 37.9 42.7
Ishige foliacea 8.0 60.0 19.0 22.7 20.9
Chondracanthus tenellus 5.0 60.0 11.9 22.7 17.3
Codium fragile 6.0 64.0 28.6 21.6 25.1
Sargassum horneri 4.0 60.0 19.0 20.3 19.7
High subtidal Chondrus pinnulatus 3.0 44.0 14.3 14.9 14.6
2 Chondracanthus tenellus 4.0 36.0 19.0 12.2 15.6
Plocamium telfairiae 2.0 52.0 9.5 17.6 13.5
Prionitis cornea 2.0 40.0 9.5 13.5 11.5
Sargassum yendoi 3.0 68.0 12.0 16.2 14.1
Amphiroa beauvoisii 4.0 100.0 16.0 23.8 19.9
Low subtidal Corallina officinalis 8.0 100.0 32.0 23.8 27.9
Gelidium amansii 6.0 92.0 24.0 21.9 23.0
Plocamium telfairiae 4.0 60.0 16.0 14.3 15.1
Codium contractum 10.0 88.0 16.9 15.8 16.4
Ulva pertusa 4.0 44.0 6.8 7.9 7.3
Hizikia fusiformis 10.0 96.0 16.9 17.3 17.1
Intertidal Ishige okamurae 9.0 100.0 15.3 18.0 16.6
Sargassum thunbergii 16.0 100.0 27.1 18.0 22.6
Amphiroa beauvoisii 6.0 88.0 10.2 15.8 13.0
Gelidium amansii 4.0 40.0 6.8 7.2 7.0
Ulva pertusa 6.0 68.0 18.8 18.5 18.6
3 Hizikia fusiformis 7.0 56.0 21.9 15.2 18.5
Sargassum pallidum 7.0 64.0 21.9 17.4 19.6
High subtidal Sargassum yendoi 4.0 60.0 12.5 16.3 14.4
Chondracanthus tenellus 2.0 60.0 6.3 16.3 11.3
Chondrus pinnulatus 1.0 8.0 3.1 2.2 2.6
Gelidium amansii 5.0 52.0 15.6 14.1 14.9
Sargassum horneri 2.0 40.0 12.5 24.4 18.4
Low subtidal Sargassum pallidum 5.0 40.0 31.3 24.4 27.8
Chondracanthus tenellus 3.0 36.0 18.8 22.0 20.4
Gelidium amansii 6.0 48.0 37.5 29.3 33.4
Phyllospadix japonicus 14.0 64.0 18.9 20.3 19.6
Ulva pertusa 4.0 12.0 5.4 3.8 4.6
Intertidal Hizikia fusiformis 19.0 60.0 25.7 19.0 22.3
Ishige okamurae 12.0 80.0 16.2 25.3 20.8
Sargassum thunbergii 25.0 100.0 33.8 31.6 32.7
4 Hizikia fusiformis 10.0 56.0 13.7 13.5 13.6
Sargassum horneri 3.0 40.0 4.1 9.6 6.9
High subtidal Sargassum yendoi 6.0 40.0 8.2 9.6 8.9
Amphiroa anceps 15.0 92.0 20.5 22.1 21.3
Amphiroa beauvoisii 31.0 100.0 42.5 24.0 33.3
Gelidium amansii 8.0 88.0 11.0 21.2 16.1
Table 5. Continued
Point Location Species C F RC RF IV
Codiumcontractum 8.0 40.0 9.1 8.4 8.7
Ulva pertusa 17.0 88.0 19.3 18.5 18.9
Dictyta divaricata 4.0 44.0 4.5 9.2 6.9
4 Low subtidal Sargassum yendoi 5.0 68.0 5.7 14.3 10.0
Corallina officinalis 40.0 100.0 45.5 21.0 33.2
Gelidium amansii 6.0 76.0 6.8 16.0 11.4
Peyssonnelia caulifera 3.0 12.0 3.4 2.5 3.0
Plocamium telfairiae 5.0 48.0 5.7 10.1 7.9
Codium fragile 1.0 32.0 1.3 5.8 3.5
Hizikia fusiformis 1.0 8.0 1.3 1.4 1.4
Myagropsis myagroides 3.0 36.0 3.8 6.5 5.2
Sargassum coreanum 1.0 32.0 1.3 5.8 3.5
Intertidal Sargassum macrocarpum 5.0 60.0 6.4 10.9 8.6
Amphiroa anceps 37.0 100.0 47.4 18.1 32.8
Chondrus ocellatus 8.0 60.0 10.3 10.9 10.6
Corallina officinalis 9.0 92.0 11.5 16.7 14.1
Gelidium amansii 8.0 68.0 10.3 12.3 11.3
Peyssonnelia caulifera 5.0 64.0 6.4 11.6 9.0
5 Ecklonia cava 10.0 40.0 16.4 6.4 11.4
Myagropsis myagroides 5.0 44.0 8.2 7.0 7.6
Phacelocarpus japonicus 3.0 48.0 4.9 7.6 6.3
Sargassum macrocarpum 4.0 36.0 6.6 5.7 6.1
High subtidal Amphiroa anceps 13.0 92.0 21.3 14.6 18.0
Carpopeltis affinis 6.0 88.0 9.8 14.0 11.9
Chondrus ocellatus 2.0 48.0 3.3 7.6 5.5
Gelidium amansii 5.0 80.0 8.2 12.7 10.5
Gelidium pacificum 7.0 92.0 11.5 14.6 13.1
Grateloupia turuturu 6.0 60.0 9.8 9.6 9.7
Low subtidal Amphiroa anceps 46.0 100.0 90.2 69.4 79.8
Gelidium amansii 5.0 44.0 9.8 30.6 20.2
Ulva pertusa 33.0 96.0 47.8 18.6 33.2
Ecklonia cava 5.0 20.0 7.2 3.9 5.6
Hizikia fusiformis 10.0 60.0 14.5 11.6 13.1
Intertidal Ishige okamurae 4.0 64.0 5.8 12.4 9.1
Chondria crassicaulis 3.0 40.0 4.3 7.8 6.0
Chondrus ocellatus 6.0 68.0 8.7 13.2 10.9
Gelidium amansii 3.0 92.0 4.3 17.8 11.1
Grateloupia turuturu 5.0 76.0 7.2 14.7 11.0
Ulva pertusa 15.0 84.0 21.1 12.4 16.8
Myagropsis myagroides 6.0 96.0 8.5 14.2 11.3
Phacelocarpus japonicus 4.0 56.0 5.6 8.3 7.0
Acrosorium polyneurum 2.0 64.0 2.8 9.5 6.1
High subtidal Carpopeltis affinis 4.0 60.0 5.6 8.9 7.3
Chondracanthus tenellus 3.0 56.0 4.2 8.3 6.3
Chondria crassicaulis 3.0 76.0 4.2 11.2 7.7
6 Chondrus ocellatus 4.0 52.0 5.6 7.7 6.7
Corallina officinalis 25.0 88.0 35.2 13.0 24.1
Gelidium amansii 5.0 44.0 7.0 6.5 6.8
Phyllospadix japonicus 10.0 60.0 10.6 7.9 9.3
Ulva pertusa 21.0 100.0 22.3 13.2 17.7
Ecklonia cava 10.0 28.0 10.6 3.7 7.2
Hizikia fusiformis 3.0 44.0 3.2 5.8 4.5
Myagropsis myagroides 2.0 68.0 2.1 8.9 5.5
Phacelocarpus japonicus 6.0 52.0 6.4 6.8 6.6
Low subtidal Sargassum horneri 2.0 36.0 2.1 4.7 3.4
Sargassum macrocarpum 3.0 32.0 3.2 4.2 3.7
Sargassum pallidum 3.0 28.0 3.2 3.7 3.4
Amphiroa anceps 10.0 72.0 10.6 9.5 10.1
Carpopeltis affinis 9.0 68.0 9.6 8.9 9.3
Gelidium amansii 7.0 76.0 7.4 10.0 8.7
Grateloupia turuturu 8.0 96.0 8.5 12.6 10.6
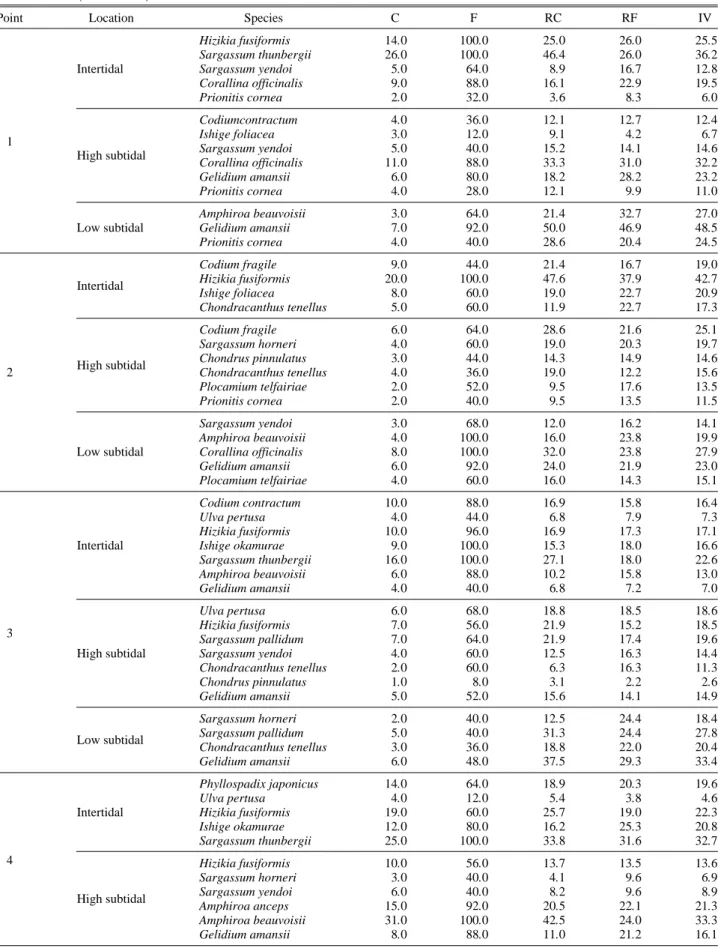
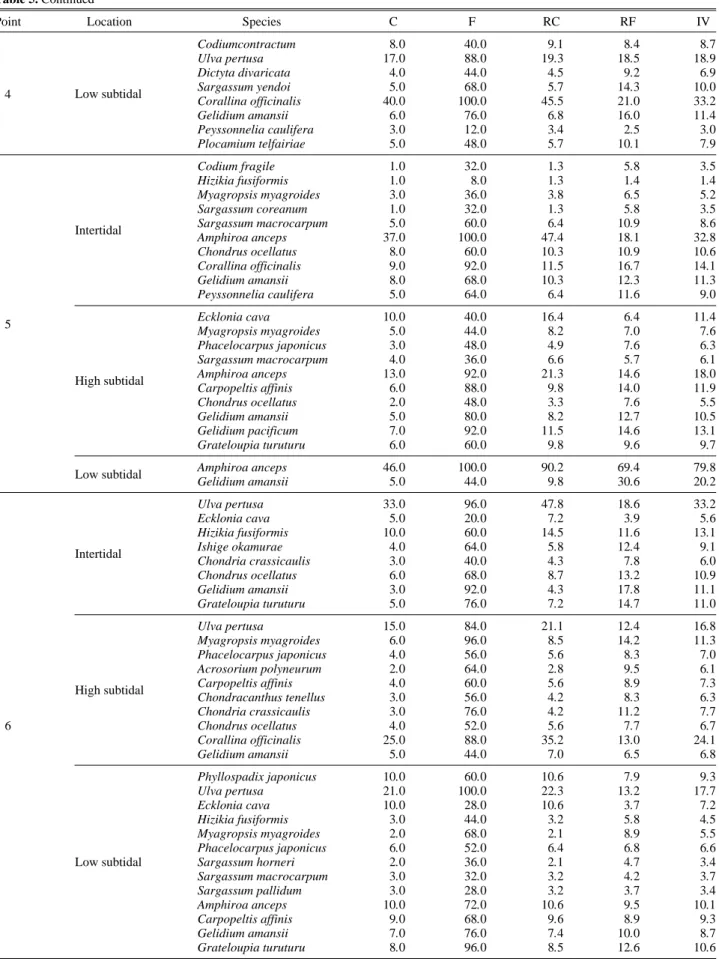
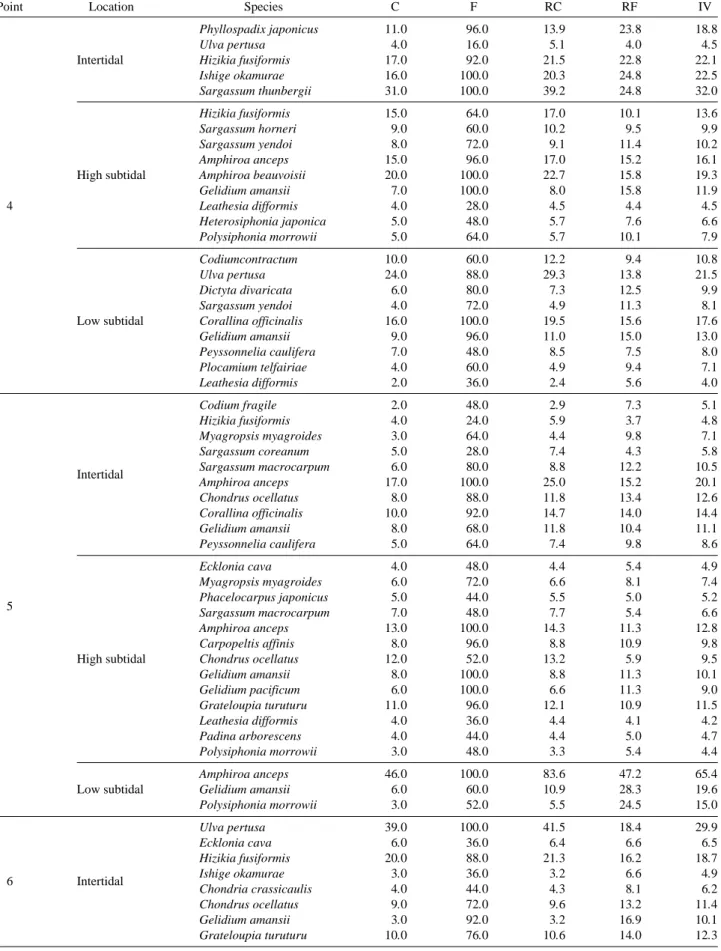
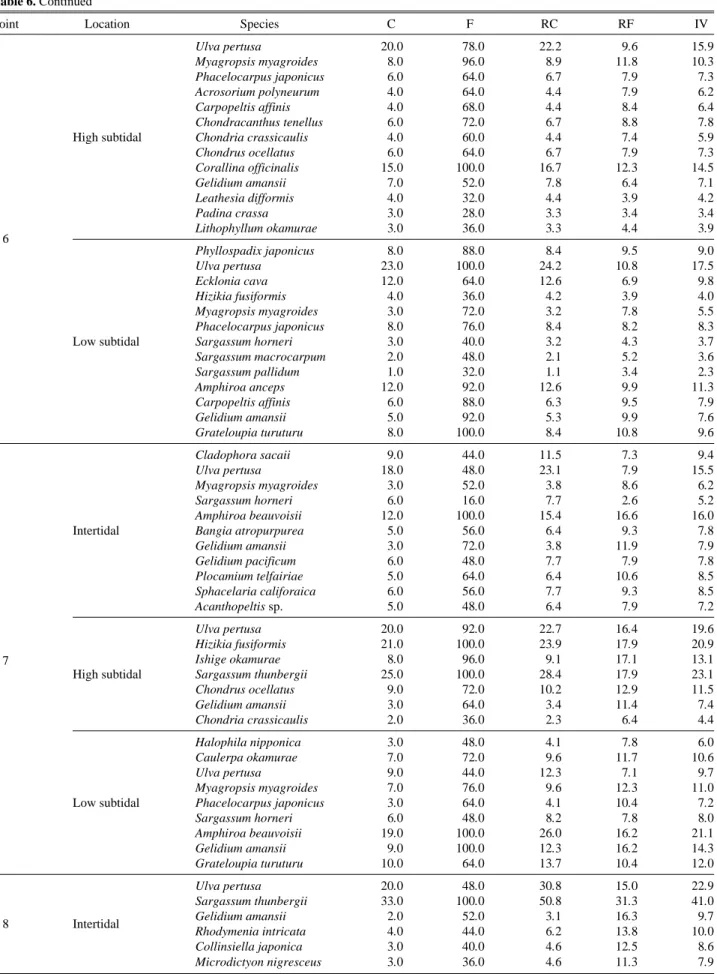
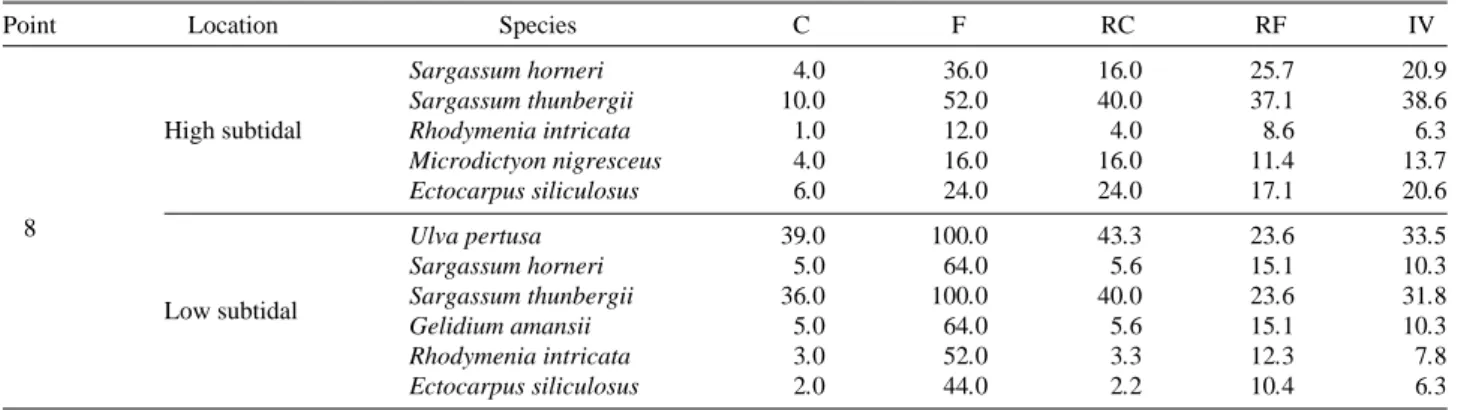
2. Relative coverage (RC), relative frequency (RF) and seasonal important value (IV)
The coverage (C), frequency (F), RC, RF, and IV of the investigated marine algae are shown in Tables 5 and 6.
From fall to winter, Codium fragile (Point 2, IV: 25.1) and Ulva pertusa (Point 6, IV: 33.2) of Chlorophyta, Coral- lina officinalis (Point 1, IV: 32.2), Gelidium amansii (Point 1, IV: 48.5), and Amphiroa beauvoisii (Point 4, IV: 33.3) of Rhodophyta, and Hizikia fusiformis (Point 2, IV: 42.7), Ishige okamurae (Point 4, IV: 20.8), and Sargassum thunbergii (Point 8, IV: 57.7) of Phaeophyta had high IV.
From spring to summer, Ulva pertusa (Point 8, IV: 33.5) of Chlorophyta, Gelidium amansii (Point 1, IV: 28.1), Dic- tyopteris prolifera (Point 1, IV: 40.4), and Amphiroa beau- voisii (Point 2, IV: 20.9) of Rhodophyta, and Hizikia fusifor-
mis (Point 2, IV: 49.9), Sargassum pallidum (Point 3, IV:
25.2), Ishige okamurae (Point 4, IV: 22.5), Sargassum hor- neri (Point 8, IV: 20.9), and Sargassum thunbergii (Point 8, IV: 38.6) of Phaeophyta had high IV.
The results show that from fall to winter, at most points, the dominant chlorophytes were Ulva pertusa, dominant phaeophytes were Hizikia fusiformis, Sargassum thunbergii, and Sargassum horneri, and dominant rhodophytes were Amphiroa epherdraea and Gelidium amansii. The dominant species from spring to summer were almost the same as from fall to winter, and the dominant species were species with isomorphic and no alternation of generations.
3. R/P, C/P, (R + + C)/P, I/H, L/F and LFD
The number of species of Laminariales and Fucaceae, and Table 5. Continued
Point Location Species C F RC RF IV
Cladophora sacaii 4.0 40.0 10.0 9.4 9.7
Ulva pertusa 12.0 44.0 30.0 10.4 20.2
Myagropsis myagroides 3.0 52.0 7.5 12.3 9.9
Sargassum horneri 1.0 36.0 2.5 8.5 5.5
Intertidal Amphiroa beauvoisii 10.0 88.0 25.0 20.8 22.9
Bangia atropurpurea 2.0 32.0 5.0 7.5 6.3
Gelidium amansii 3.0 48.0 7.5 11.3 9.4
Gelidium pacificum 2.0 32.0 5.0 7.5 6.3
Plocamium telfairiae 3.0 52.0 7.5 12.3 9.9
Ulva pertusa 13.0 100.0 14.1 18.4 16.3
Hizikia fusiformis 21.0 100.0 22.8 18.4 20.6
7 High subtidal Ishige okamurae 9.0 96.0 9.8 17.6 13.7
Sargassum thunbergii 40.0 100.0 43.5 18.4 30.9
Chondrus ocellatus 6.0 72.0 6.5 13.2 9.9
Gelidium amansii 3.0 76.0 3.3 14.0 8.6
Halophila nipponica 4.0 20.0 4.4 3.6 4.0
Caulerpa okamurae 10.0 88.0 11.0 15.8 13.4
Ulva pertusa 10.0 40.0 11.0 7.2 9.1
Myagropsis myagroides 11.0 68.0 12.1 12.2 12.2
Low subtidal Phacelocarpus japonicus 3.0 56.0 3.3 10.1 6.7
Sargassum horneri 2.0 28.0 2.2 5.0 3.6
Amphiroa beauvoisii 30.0 96.0 33.0 17.3 25.1
Gelidium amansii 10.0 88.0 11.0 15.8 13.4
Grateloupia turuturu 11.0 72.0 12.1 12.9 12.5
Ulva pertusa 8.0 56.0 16.0 24.1 20.1
Intertidal Sargassum thunbergii 37.0 96.0 74.0 41.4 57.7
Gelidium amansii 2.0 44.0 4.0 19.0 11.5
Rhodymenia intricata 3.0 36.0 6.0 15.5 10.8
Sargassum horneri 6.0 28.0 50.0 36.8 43.4
8 High subtidal Sargassum thunbergii 5.0 44.0 41.7 57.9 49.8
Rhodymenia intricata 1.0 4.0 8.3 5.3 6.8
Ulva pertusa 33.0 100.0 47.1 31.3 39.2
Sargassum horneri 4.0 36.0 5.7 11.3 8.5
Low subtidal Sargassum thunbergii 26.0 100.0 37.1 31.3 34.2
Gelidium amansii 4.0 40.0 5.7 12.5 9.1
Rhodymenia intricata 3.0 44.0 4.3 13.8 9.0
Table 6. Coverage (C), frequency (F), relative coverage (RC), relative frequency (RF) and important value (IV) of marine algae from spring to summer (2009)
Point Location Species C F RC RF IV
Hizikia fusiformis 35.0 100.0 35.4 23.1 29.3
Sargassum thunbergii 40.0 100.0 40.4 23.1 31.8
Intertidal Sargassum yendoi 3.0 88.0 3.0 20.4 11.7
Corallina officinalis 13.0 96.0 13.1 22.2 17.7
Prionitis cornea 8.0 48.0 8.1 11.1 9.6
Codiumcontractum 8.0 64.0 12.5 14.5 13.5
Ishige foliacea 4.0 32.0 6.3 7.3 6.8
1 Sargassum yendoi 10.0 48.0 15.6 10.9 13.3
High subtidal Corallina officinalis 15.0 96.0 23.4 21.8 22.6
Gelidium amansii 11.0 96.0 17.2 21.8 19.5
Prionitis cornea 10.0 48.0 15.6 10.9 13.3
Cladophora wrightiana 6.0 56.0 9.4 12.7 11.1
Amphiroa beauvoisii 5.0 44.0 8.8 19.3 14.0
Low subtidal Gelidium amansii 12.0 80.0 21.1 35.1 28.1
Prionitis cornea 10.0 40.0 17.5 17.5 17.5
Dictyopteris prolifera 30.0 64.0 52.6 28.1 40.4
Codium fragile 9.0 68.0 12.5 21.5 17.0
Intertidal Hizikia fusiformis 50.0 96.0 69.4 30.4 49.9
Ishige foliacea 8.0 80.0 11.1 25.3 18.2
Chondracanthus tenellus 5.0 72.0 6.9 22.8 14.9
Codium fragile 8.0 84.0 11.8 20.2 16.0
Sargassum horneri 6.0 48.0 8.8 11.5 10.2
Chondrus pinnulatus 9.0 60.0 13.2 14.4 13.8
High subtidal Chondracanthus tenellus 10.0 36.0 14.7 8.7 11.7
Plocamium telfairiae 6.0 40.0 8.8 9.6 9.2
2 Prionitis cornea 5.0 44.0 7.4 10.6 9.0
Acanthopeltis sp. 13.0 56.0 19.1 13.5 16.3
Chondria crassicaulis 11.0 48.0 16.2 11.5 13.9
Sargassum yendoi 4.0 72.0 6.7 12.6 9.6
Amphiroa beauvoisii 15.0 96.0 25.0 16.8 20.9
Corallina officinalis 10.0 100.0 16.7 17.5 17.1
Low subtidal Gelidium amansii 9.0 96.0 15.0 16.8 15.9
Plocamium telfairiae 4.0 72.0 6.7 12.6 9.6
Grateloupia chiangii 10.0 64.0 16.7 11.2 13.9
Lithophyllum okamurae 8.0 72.0 13.3 12.6 13.0
Codium contractum 12.0 96.0 14.0 16.3 15.1
Ulva pertusa 8.0 36.0 9.3 6.1 7.7
Hizikia fusiformis 16.0 96.0 18.6 16.3 17.5
Intertidal Ishige okamurae 8.0 100.0 9.3 17.0 13.2
Sargassum thunbergii 20.0 100.0 23.3 17.0 20.1
Amphiroa beauvoisii 16.0 88.0 18.6 15.0 16.8
Gelidium amansii 6.0 72.0 7.0 12.2 9.6
Ulva pertusa 16.0 76.0 21.1 10.1 15.6
Hizikia fusiformis 8.0 64.0 10.5 8.5 9.5
Sargassum pallidum 9.0 100.0 11.8 13.3 12.6
Sargassum yendoi 6.0 88.0 7.9 11.7 9.8
3 High subtidal Chondracanthus tenellus 6.0 92.0 7.9 12.2 10.1
Chondrus pinnulatus 3.0 36.0 3.9 4.8 4.4
Gelidium amansii 10.0 72.0 13.2 9.6 11.4
Cladophora japonica 7.0 88.0 9.2 11.7 10.5
Collinsiella japonica 5.0 72.0 6.6 9.6 8.1
Ectocarpus siliculosus 6.0 64.0 7.9 8.5 8.2
Sargassum horneri 3.0 64.0 12.0 23.5 17.8
Sargassum pallidum 6.0 72.0 24.0 26.5 25.2
Low subtidal Chondracanthus tenellus 3.0 36.0 12.0 13.2 12.6
Gelidium amansii 7.0 60.0 28.0 22.1 25.0
Collinsiella japonica 2.0 12.0 8.0 4.4 6.2
Ectocarpus siliculosus 4.0 28.0 16.0 10.3 13.1
Phyllospadix japonicus 11.0 96.0 13.9 23.8 18.8
Ulva pertusa 4.0 16.0 5.1 4.0 4.5
Intertidal Hizikia fusiformis 17.0 92.0 21.5 22.8 22.1
Ishige okamurae 16.0 100.0 20.3 24.8 22.5
Sargassum thunbergii 31.0 100.0 39.2 24.8 32.0
Hizikia fusiformis 15.0 64.0 17.0 10.1 13.6
Sargassum horneri 9.0 60.0 10.2 9.5 9.9
Sargassum yendoi 8.0 72.0 9.1 11.4 10.2
Amphiroa anceps 15.0 96.0 17.0 15.2 16.1
High subtidal Amphiroa beauvoisii 20.0 100.0 22.7 15.8 19.3
Gelidium amansii 7.0 100.0 8.0 15.8 11.9
4 Leathesia difformis 4.0 28.0 4.5 4.4 4.5
Heterosiphonia japonica 5.0 48.0 5.7 7.6 6.6
Polysiphonia morrowii 5.0 64.0 5.7 10.1 7.9
Codiumcontractum 10.0 60.0 12.2 9.4 10.8
Ulva pertusa 24.0 88.0 29.3 13.8 21.5
Dictyta divaricata 6.0 80.0 7.3 12.5 9.9
Sargassum yendoi 4.0 72.0 4.9 11.3 8.1
Low subtidal Corallina officinalis 16.0 100.0 19.5 15.6 17.6
Gelidium amansii 9.0 96.0 11.0 15.0 13.0
Peyssonnelia caulifera 7.0 48.0 8.5 7.5 8.0
Plocamium telfairiae 4.0 60.0 4.9 9.4 7.1
Leathesia difformis 2.0 36.0 2.4 5.6 4.0
Codium fragile 2.0 48.0 2.9 7.3 5.1
Hizikia fusiformis 4.0 24.0 5.9 3.7 4.8
Myagropsis myagroides 3.0 64.0 4.4 9.8 7.1
Sargassum coreanum 5.0 28.0 7.4 4.3 5.8
Intertidal Sargassum macrocarpum 6.0 80.0 8.8 12.2 10.5
Amphiroa anceps 17.0 100.0 25.0 15.2 20.1
Chondrus ocellatus 8.0 88.0 11.8 13.4 12.6
Corallina officinalis 10.0 92.0 14.7 14.0 14.4
Gelidium amansii 8.0 68.0 11.8 10.4 11.1
Peyssonnelia caulifera 5.0 64.0 7.4 9.8 8.6
Ecklonia cava 4.0 48.0 4.4 5.4 4.9
Myagropsis myagroides 6.0 72.0 6.6 8.1 7.4
5 Phacelocarpus japonicus 5.0 44.0 5.5 5.0 5.2
Sargassum macrocarpum 7.0 48.0 7.7 5.4 6.6
Amphiroa anceps 13.0 100.0 14.3 11.3 12.8
Carpopeltis affinis 8.0 96.0 8.8 10.9 9.8
High subtidal Chondrus ocellatus 12.0 52.0 13.2 5.9 9.5
Gelidium amansii 8.0 100.0 8.8 11.3 10.1
Gelidium pacificum 6.0 100.0 6.6 11.3 9.0
Grateloupia turuturu 11.0 96.0 12.1 10.9 11.5
Leathesia difformis 4.0 36.0 4.4 4.1 4.2
Padina arborescens 4.0 44.0 4.4 5.0 4.7
Polysiphonia morrowii 3.0 48.0 3.3 5.4 4.4
Amphiroa anceps 46.0 100.0 83.6 47.2 65.4
Low subtidal Gelidium amansii 6.0 60.0 10.9 28.3 19.6
Polysiphonia morrowii 3.0 52.0 5.5 24.5 15.0
Ulva pertusa 39.0 100.0 41.5 18.4 29.9
Ecklonia cava 6.0 36.0 6.4 6.6 6.5
Hizikia fusiformis 20.0 88.0 21.3 16.2 18.7
6 Intertidal Ishige okamurae 3.0 36.0 3.2 6.6 4.9
Chondria crassicaulis 4.0 44.0 4.3 8.1 6.2
Chondrus ocellatus 9.0 72.0 9.6 13.2 11.4
Gelidium amansii 3.0 92.0 3.2 16.9 10.1
Grateloupia turuturu 10.0 76.0 10.6 14.0 12.3
Table 6. Continued
Point Location Species C F RC RF IV
Ulva pertusa 20.0 78.0 22.2 9.6 15.9
Myagropsis myagroides 8.0 96.0 8.9 11.8 10.3
Phacelocarpus japonicus 6.0 64.0 6.7 7.9 7.3
Acrosorium polyneurum 4.0 64.0 4.4 7.9 6.2
Carpopeltis affinis 4.0 68.0 4.4 8.4 6.4
Chondracanthus tenellus 6.0 72.0 6.7 8.8 7.8
High subtidal Chondria crassicaulis 4.0 60.0 4.4 7.4 5.9
Chondrus ocellatus 6.0 64.0 6.7 7.9 7.3
Corallina officinalis 15.0 100.0 16.7 12.3 14.5
Gelidium amansii 7.0 52.0 7.8 6.4 7.1
Leathesia difformis 4.0 32.0 4.4 3.9 4.2
Padina crassa 3.0 28.0 3.3 3.4 3.4
6 Lithophyllum okamurae 3.0 36.0 3.3 4.4 3.9
Phyllospadix japonicus 8.0 88.0 8.4 9.5 9.0
Ulva pertusa 23.0 100.0 24.2 10.8 17.5
Ecklonia cava 12.0 64.0 12.6 6.9 9.8
Hizikia fusiformis 4.0 36.0 4.2 3.9 4.0
Myagropsis myagroides 3.0 72.0 3.2 7.8 5.5
Phacelocarpus japonicus 8.0 76.0 8.4 8.2 8.3
Low subtidal Sargassum horneri 3.0 40.0 3.2 4.3 3.7
Sargassum macrocarpum 2.0 48.0 2.1 5.2 3.6
Sargassum pallidum 1.0 32.0 1.1 3.4 2.3
Amphiroa anceps 12.0 92.0 12.6 9.9 11.3
Carpopeltis affinis 6.0 88.0 6.3 9.5 7.9
Gelidium amansii 5.0 92.0 5.3 9.9 7.6
Grateloupia turuturu 8.0 100.0 8.4 10.8 9.6
Cladophora sacaii 9.0 44.0 11.5 7.3 9.4
Ulva pertusa 18.0 48.0 23.1 7.9 15.5
Myagropsis myagroides 3.0 52.0 3.8 8.6 6.2
Sargassum horneri 6.0 16.0 7.7 2.6 5.2
Amphiroa beauvoisii 12.0 100.0 15.4 16.6 16.0
Intertidal Bangia atropurpurea 5.0 56.0 6.4 9.3 7.8
Gelidium amansii 3.0 72.0 3.8 11.9 7.9
Gelidium pacificum 6.0 48.0 7.7 7.9 7.8
Plocamium telfairiae 5.0 64.0 6.4 10.6 8.5
Sphacelaria califoraica 6.0 56.0 7.7 9.3 8.5
Acanthopeltis sp. 5.0 48.0 6.4 7.9 7.2
Ulva pertusa 20.0 92.0 22.7 16.4 19.6
Hizikia fusiformis 21.0 100.0 23.9 17.9 20.9
7 Ishige okamurae 8.0 96.0 9.1 17.1 13.1
High subtidal Sargassum thunbergii 25.0 100.0 28.4 17.9 23.1
Chondrus ocellatus 9.0 72.0 10.2 12.9 11.5
Gelidium amansii 3.0 64.0 3.4 11.4 7.4
Chondria crassicaulis 2.0 36.0 2.3 6.4 4.4
Halophila nipponica 3.0 48.0 4.1 7.8 6.0
Caulerpa okamurae 7.0 72.0 9.6 11.7 10.6
Ulva pertusa 9.0 44.0 12.3 7.1 9.7
Myagropsis myagroides 7.0 76.0 9.6 12.3 11.0
Low subtidal Phacelocarpus japonicus 3.0 64.0 4.1 10.4 7.2
Sargassum horneri 6.0 48.0 8.2 7.8 8.0
Amphiroa beauvoisii 19.0 100.0 26.0 16.2 21.1
Gelidium amansii 9.0 100.0 12.3 16.2 14.3
Grateloupia turuturu 10.0 64.0 13.7 10.4 12.0
Ulva pertusa 20.0 48.0 30.8 15.0 22.9
Sargassum thunbergii 33.0 100.0 50.8 31.3 41.0
8 Intertidal Gelidium amansii 2.0 52.0 3.1 16.3 9.7
Rhodymenia intricata 4.0 44.0 6.2 13.8 10.0
Collinsiella japonica 3.0 40.0 4.6 12.5 8.6
Microdictyon nigresceus 3.0 36.0 4.6 11.3 7.9
Table 6. Continued
Point Location Species C F RC RF IV
the number of species of cold, warm, and hot water type are shown in Tables 7 and 8. The number of chlorophytes, rhodo- phytes, and phaeophytes are shown in Tables 3 and 4. The results of R/P, C/P, (R + + C)/P, L/H, L/F, and LFD are shown in Tables 9 and 10.
The values of (R + + C)/P ratio were in the range from 1 to 2 in fall to winter and from 1.14 to 3 in spring to summer;
the algal flora of Goheung should be warm or cold water algal flora.
The L/F ratio was in the range from 0 to 0.25 during both fall to winter and spring to summer. The L/F ratios of 6
points were 0, as there were no Laminariales species.
The ratio of LFD fell in the range from 1.00 to 1.33 in fall to winter and from 1.00 to 1.40 in spring to summer, which shows that the marine algal flora of Goheung was temperate water algal flora.
4. H′′ index
The H ′ indexes of Points 4 to 6 were higher than those of the other points, and Point 8 had the lowest value (Fig. 2).
5. DCA
DCA was based on the occurred species. The distance between the symbols in the diagram approximates the simi- larity of distribution of relative abundance of those species across the points. The DCA result of the investigation points
Sargassum horneri 4.0 36.0 16.0 25.7 20.9
Sargassum thunbergii 10.0 52.0 40.0 37.1 38.6
High subtidal Rhodymenia intricata 1.0 12.0 4.0 8.6 6.3
Microdictyon nigresceus 4.0 16.0 16.0 11.4 13.7
8
Ectocarpus siliculosus 6.0 24.0 24.0 17.1 20.6
Ulva pertusa 39.0 100.0 43.3 23.6 33.5
Sargassum horneri 5.0 64.0 5.6 15.1 10.3
Low subtidal Sargassum thunbergii 36.0 100.0 40.0 23.6 31.8
Gelidium amansii 5.0 64.0 5.6 15.1 10.3
Rhodymenia intricata 3.0 52.0 3.3 12.3 7.8
Ectocarpus siliculosus 2.0 44.0 2.2 10.4 6.3
Table 6. Continued
Point Location Species C F RC RF IV
Table 7. Number of species of Laminariales and Fucaceae, and species of cold, warm, and hot water type from fall to winter (2008~2009)
Point Item
1 2 3 4 5 6 7 8
Laminariales 0 0 0 0 1 1 0 0
Fucaceae 3 3 5 4 4 5 4 2
C* 0 0 0 0 0 0 0
W* 2 2 4 3 5 6 4 2
H* 1 1 1 1 0 0 0 0
*C is species of cold water, W is species of warm water, H is species of hot water.
Table 8. Number of species of Laminariales and Fucaceae, and species of cold, warm, and tropical water type from spring to summer (2009)
Point Item
1 2 3 4 5 6 7 8
Laminariales 0 0 0 0 1 1 0 0
Fucaceae 3 3 5 4 4 5 4 2
C* 0 0 0 0 0 0 0 0
W* 3 2 4 3 5 6 4 2
H* 1 1 1 2 1 1 0 0
*C is species of cold water, W is species of warm water, H is species of hot water.
Table 9. R/P, C/P, (R
++C)/P, L/H, L/F, and LFD of studied points from fall to winter (2008~2009)
Point Item
1 2 3 4 5 6 7 8
C/P 0.25 0.25 0.33 0.33 0.20 0.14 0.60 0.50 R/P 1.00 1.75 0.67 1.00 1.80 1.43 1.60 1.00 (R
++C)/P 1.25 2.00 1.00 1.33 2.00 1.57 2.20 1.50 L/F 0.00 0.00 0.00 0.00 0.25 0.20 0.00 0.00 LFD 1.33 1.33 1.20 1.25 1.00 1.00 1.00 1.00
Table 10. R/P, C/P, (R
++C)/P, L/H, L/F, and LFD of studied points from spring to summer (2009)
Point Item
1 2 3 4 5 6 7 8
C/P 0.40 0.25 0.57 0.29 0.14 0.11 0.50 1.00
R/P 0.80 2.75 0.57 1.14 1.43 1.22 1.67 0.67
(R
++C)/P 1.20 3.00 1.14 1.43 1.57 1.33 2.17 1.67
L/F 0.00 0.00 0.00 0.00 0.25 0.20 0.00 0.00
LFD 1.25 1.33 1.20 1.40 1.17 1.14 1.00 1.00
from fall to winter (Fig. 3) showed that the similarity of occurred species at Points 3 and 4 was higher than those of
the other points, whereas, from spring to summer, the simil- arities at Points 1 to 4 was high, and that at Points 5 and 6 was high (Fig. 4).
6. EEI
The EEI of the investigation points in fall to winter and spring to summer are shown in Fig. 5. The ecological envi- ronment of most points was above the moderate class, espe- cially Point 5. The EEI value of Point 5 was in the good class. The results also show that EEI values of the outer sea points (Points 3-5) were higher than those of the inner bay points.
Fig. 3. Detrended correspondence analysis (DCA) of investigation points from fall to winter (2008~2009).
2.5 - 0.5
-1.0 5.0
1
2 3
4
5 6
7 8
Fig. 4. Detrended correspondence analysis (DCA) of investigation points from spring to summer (2009).
2.5 - 0.5
-1.0 4.0
1 2 3
4 5
6 7
8 Point
1 2 3 4 5 6 7 8
Species diversity index
1.0 1.2 1.4 1.6 1.8 2.0 2.2 2.4
Fall to winter Spring to summer
Fig. 2. The species diversity index of the investigation points (2008
~2009).
Point
1 2 3 4 5 6 7 8
Fall to winter Spring to summer