반도체디스플레이기술학회지 제16권 제3호(2017년 9월)
Journal of the Semiconductor & Display Technology, Vol. 16, No. 3. September 2017.
A Study on the Thermal Analysis of Circular LED Street Lights
Byung Moon So
*†*†
Dept. of Convergence TechnologyEngineering, College of Eng., Chonbuk National University
ABSTRACT
This paper confirms the similarity of temperature tendency through numerical analysis and comparison with test, and it also confirms that temperature prediction of LED lightings is possible by numerical analysis. We confirmed that the temperature difference is about 10 ~ 20 °C except for some measurement points and shows similar tendency with the interpretation through manufacturing and performance analysis of AL heat sink applied Circular LED street lights and manufacturing and performance analysis of CMP-PLA heat sink applied Circular LED street lights. The simulations use Octree technique in SC/Tetra to set the grid size df the surface.
Key Words : Heat Sink, CMP-PLA, AL
1. Introduction
1
LED street light is attracting attention due to power saving and long life compared to existing metal halide lamp street lights. However, currently, there are few LED street light products that meet the level of illuminance and heat temperature standards required by the consumers.
The core technology of LED lighting equipment is high efficiency light source, heat sink, high power factor power source, reflection, etc., and the core technology among these is to manufacture heat sink for emitting heat of LED light source.
In the case of temperature rise of LED lighting equipment, serious problems, such as decrease of light output, increase of wavelength of output light (red shift), breakage of bond wire by thermal stress, detachment due to thermal stress, epoxy lens protrusion, and destruction of soldier area, are caused leading to a reduction in the lifetime of the lighting equipment.
In the case of a semiconductor device, the lifeof it is reduced to 70 to 75% by increasing the service temperature by 10°C.
In order to achieve high efficiency and long life, which is
†
E-mail: [email protected]
a unique function of LED, it is urgent to develop a technology for securing heat emission technology for diffusing heat of a chip to the outside.
Therefore, heat emission performance is to be confirmed through thermal analysis of 150W LED lights.
2. Main Body
2.1 Boundary Conditions
The analytical model used for the numerical calculation is shown in Fig. 1, and the domain size is 2.5x2.6x3.6 m in widthxlengthxheight. The LED chip was modeled in a rectangular parallelepiped as an interpretation boundary condition and input as a heating condition. The total number of LED chips is 72, and assuming that the loss of SMPS is 10% when the power consumption is 150W, 108W was set as a heat value with an assumption that the efficiency of the LED device is 20% of light and 80% of heat.
Fig. 1. Simulation model.
Byung Moon So 100
As the wall condition, no silp wall condition was set for all external interpretation domains, and the temperature condition was set at 25°C which is the outdoor air temperature. Since all of the external domains are set to the wall condition, forced flow is not generated inside and only natural convection by buoyancy occurs. No slip wall condition and heat transfer condition were set for the surface where LED street lights contact with air. Free silp wall conditions were set for the solid and solid contact surfaces, and no heat resistance was set between the solids.
Also, the initial temperature of the inside was defined as the outdoor air temperature of 25°C. The materials used for numerical analysis are shown in Table 1.
Table 1. Materials used for simulation
Density[kg/m3]
Specific Heat [J/kg‧K]
Conductivity [W/m‧K]
ALDC12S 2760 900 209
A6063 2700 900 340
SL300AB 1100 900 0.18
FR4 1600 950 0.44
epoxy 1850 1100 0.3
AC2B 2770 900 340
Here, the back cover material is ALDC12S, the heat sink material is A6063, the molding KCC material is SL300AB, the LED PCB is FR4, the LED chip is epoxy and the tie bar material is AC2B.
2.2 Analysis conditions and grid shape
The commercial thermal fluid analysis software used in this study is SC / Tetra V8, and the interpretation conditions used for the calculation are in Table 2.
Table 2. Simulation conditions
CFD software SC/Tetra V8
Analysis Schemes
Incompressible Flow Steady-state analysis Conduction & Natural convection Turbulent MP k-epsilon turbulence Convection term 1st order upwind differencing scheme Pressure Correction
Method SIMPLEC
Buoyant Force Consider
The lattice used in this analysis is an unstructured grid, which is suitable for expressing a complex geometry shape.
As shown in Fig. 2 for the method of generating a lattice, first, the step format of Cad is imported in the pre-processor, and put the name on the surface of each part.
Then, using the Octree technique used in SC / Tetra to set the surface grid size and create the grid, surface meshes, volume meshes, and prism mesh meshes are created.
The number of grids used in the calculation is about 6 million joints and the number of elements is about 28 million. Also, the prism layer for the calculation of the boundary layer characteristics of the wall flow was composed of two layers.
2.3 Interpretation ofthe case study
In order to investigate the temperature distribution of LED street lights according to the material of heat sink, a case study was performed by changing specific heat, conductivity and density of the materials. The interpretation of the case study is shown in Table 3. Here, the basic model with AL heat sink corresponds to Case1, and the model with CMP-PLA heat sink corresponds to Case 2.
Table 3. Case study of heat sink materials
Density[kg/m3]
Specific Heat [J/kg‧K]
Conductivity [W/m‧K]
Case 1 2700 900 340
Case 2 1650 1100 3.01
2.4 Interpretation result
2.4.1. Temperature result of heat sink according to specific heat
Fig. 2 and Fig. 3 are velocity vectors at the central cross section of the LED when the specific heat increases to 900, 1000, and 1100 [J / kg · K]. As shown in Fig. 2 and Fig. 3,
Fig. 2. A-A1 cross-section velocity vector.
A Study on the Thermal Analysis of Circular LED Street Lights 101
Fig. 3. B-B1 cross-section velocity vector
there is no change in velocity vector with increasing specific heat, and the overall velocity vector tends to rise together with the heat sink-induced airflow.
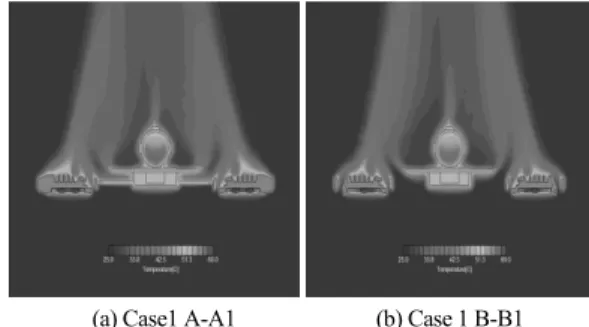
Fig. 4 shows the temperature distribution with increasing specific heat. Like the velocity vector, there is almost no change in the temperature distribution with increasing specific heat.
(a) Case1 A-A1 (b) Case 1 B-B1
Fig. 4. Cross-section Tem. Distribution.
Fig. 5. Result of Case 1 heat sink back side Tem. Measurement.
Fig. 6 shows the result of temperature measurement at the same position as the test. At the back of the heat sink, the temperature was measured at six locations, and at the front of the LED streetlight, the temperature was measured at nine locations. The results of temperature measurement for each case are shown in Table 4 and Table 5.
(a) Cover & Frame & LED PKG
(b) PCB (c) LED solder
Fig. 6. Result of Case 1 heat sink head side Tem. Measurement.
Fig. 7. Result of test & value simulation.
As shown in Table 4 and Table 5, it can be confirmed that the temperature values at each measurement point are all the same with increasing specific heat. This means that the change in specific heat of the heat sink does not affect the heat emission performance. The results of temperature measurement for case 1, basic model, and the test case are as follows.
Table 4. Result of heat sink back side Tem. Measurement
Measurementpoints 1 2 3 4 5 6
Test 45.1 45.8 46.1 40.3 42.1 40.5 Case 1 55.9 55.9 56.0 55.4 55.4 55.5
Byung Moon So 102
Table 5. Result of heat sink head side Tem. measurement
Measurementpoints 1 2 3 4 5 6 7 8 9
Test 40.0 38.0 47.3 44.6 56.5 47.0 42.3 42.5 65.4 Case1 54.9 55.6 56.5 56.4 91.4 56.5 55.0 54.7 97.1
The results of test and numerical interpretation show a certain tendency. We could confirm a tendency showing that the temperature difference on the back of the heat sink is about 12°C on average, and the temperature difference on the front of the heat sink is about 16°C on average, the temperature difference of PCB is about 10.5°C on average, the temperature difference of the LED solder is about 34.9°C on average, and the temperature difference of LED PKG is about 31.7°C on average.
Fig. 8. Result of case 2 heat sink back side Tem. Measurement.
(a) Cover & Frame & LED PKG
(b) PCB (c) LED solder
Fig. 9. Result of case 2 heat sink head side Tem. Measurement.
Fig. 9 shows the temperature results of the back and front of the heat sink of case 2. The temperature values at each measurement point are shown in Table 6 and Table 7. Table 6 and Table 7 show that the temperature at each measurement point does not change as the density decreases. This means that the density change of the heat sink does not affect the heat transfer.
Table 6. Result of heat sink back side Tem. measurement
Measurementpoints 1 2 3 4 5 6
Case 2 74.0 73.8 74.0 59.6 59.5 60.1
Table 7. Result of heat sink head side Tem. measurement
Measurementpoints 1 2 3 4 5 6 7 8 9
Case 2 67.8 70.2 76.6 76.2 121.2 76.7 51.3 57.9 115.2
2.4.2 Analysis results of CMP-PLA heat sink applied model
The analysis results of the CMP-PLA heat sink application model are shown in case 2. The airflow distribution is concentrated in the central part of the heat sink in the LED module, which induces natural convection at a high speed and flows upwards linearly. The temperature distribution is centered around the LED module, and it can be confirmed that the heat is not transmitted to the outer area where the LED module is not located. This phenomenon occurs because the thermal conductivity is very low at 3.01 [W / mK].
CMP-PLA heat sinks are not better than AL heat sinks for heat emission, but in the case of AL heat sinks, since the temperature of the heat sink and LED solder is very low at 40~56°C level to lower the heat sink performance and the effect of weight reduction can be obtained by selecting the heat sink material with acceptable LED solder temperature.
2.4.3 Comparison of numerical analysis results of AL heat sink model and CMP-PLA heat sink model The analytical models of the AL heat sink and the CMP- PLA heat sink are case 1 and case 2, respectively. The results of temperature measurement on the back and front of the heat sink are shown in Table 8 and Table 9.
Looking at Fig. 10, the temperature of the back of the
A Study on the Thermal Analysis of Circular LED Street Lights 103
heat sink tends to increase rapidly in case 8 at measurement points 1, 2, and 3 at the center. This is a phenomenon that occurs due to inadequate heat transfer. In the case of the case 8, the temperature was relatively low because the heat was not transferred from the measurement points 7 and 8 to the frame part. At other measurement points, case 1 and case 2 show similar tendency.
It could be confirmed that the temperature difference on the backside of the heat sink is about 18 °C on average, the cover temperature difference on the front is about 15°C on average, the PCB temperature difference is about 20°C on average, LED solder temperature difference is about 29.8°C, and LED PKG temperature difference is about 18°C on average.
Table 8. Result of back side Tem. measurement
Measurementpoints 1 2 3 4 5 6
Case 1 55.9 55.9 56 55.4 55.4 55.5 Case 2 74.0 73.8 74.0 59.6 59.5 60.1
Table 9. Result of Tem. measurement to back side material compare
Measurement
points 1 2 3 4 5 6 7 8 9
Case 1 54.9 55.6 56.5 56.4 91.4 56.5 55 54.7 97.1 Case 2 67.8 70.2 76.6 76.2 121.2 76.7 51.3 57.9 115.2
Fig. 10. Tem. Graph of case1 & case2.
2.4.4 Comparison of test results of CMP-PLA heat sink model and numerical analysis
The points of temperature measurement of the heat sink area of the LED street lights with the CMP-PLA heat sink are shown in Fig. 11. The temperature was measured at 8 points on the back of the heat sink and 11 points on the front of the heat sink, and the temperature results were also output at the same measurement points in the numerical analysis model.
(a) heat sink back side (b) heat sink head side
Fig. 11. CMP-PLA Tem. measurement points.
(a) Cover & Frame & LED PKG (b) PCB & LED solder
Fig. 12. Result of case 2 heat sink back side Tem. Measurement.
Table 10. Result of CMP-PLA back side Tem. measurement
Measurementpoints 1 2 3 4 5 6 7 8
Test - 59.8 47.8 44.5 56.4 47.7 43 44.3 Analysis 55.1 73.9 47.8 55.9 73.5 55.7 51.3 50.8
Table 11. Result of CMP-PLA head side Tem. measurement
Measurement points 1 2 3 4 5 6 7 8 9 10 11
Test 99.4 85.5 68.6 56.7 64.7 51.7 47.2 43.9 95.4 87.4 72.6
Analysis 114.7 121.4 83.4 106.9 67.5 46.8 54.9 55.3 114.6 126.8 84.6
Byung Moon So 104
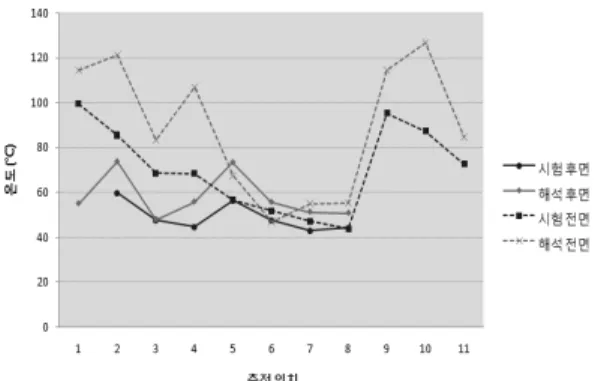
Fig. 13. Result of test & simulation in CMP PLA heat sink.
The temperature results for the test and the numerical analysis are shown in Table 10 and Table 11. It is confirmed that the temperature difference is constant at all positions except measurement point 3. The temperature difference on the back of the heat sink is approximately 11.4~17.1°C.
Comparison of the test results with analysis results in graphs is shown in Fig. 13. Both the front and back of the CMP-PLA heat sink show a constant value except for the measurement points inside the heatsink (3 on the back and 6 on the front). The temperature difference between the test and the analysis of the front part of the heat sink showed a temperature difference of about 10~20°C except the LED solder and the lens, which is confirmed to be similar to the temperature difference at the backside. In the case of the lens (No. 4 on the front), the temperature is high during the analysis because both the gap between the LED chip and the lens and the air area can’t be considered in the analytical model, so it was simplified to the condition that the lens was wrapped around the LED chip and all three sides were in contact with each other, and heat transfer to the lens was increased, resulting in a high temperature in the analysis. The temperature difference from the LED solder shows a temperature difference of 35.9~39.4°C similar to the temperature difference (34.9°C) of the AL heat sink model.
3. Conclusion
In order to solve the problem of airflow distribution in the heat sink, we developed a circular LED street light that directly cooled the heat sink. The heat emission performance was predicted using AL heat sink as a basic model, and the
qualitative tendency was confirmed through numerical analysis.
In the case of AL heat sink, the temperature of LED solder was 56.6°C, which is much lower than 90°C, the recommended service temperature of LED chip used in this development, and it is judged that the heat emission performance is excessive, and the development of new materials was carried out through numerical analysis to achieve the goal of weight reduction. In order to reduce the weight, we focused on the material of the heat sink rather than the shape of the heat sink, and examined the heat emission performance of the materials. As a result, specific heat and density have no significant influence on heat emission performance, and it is confirmed that heat conductivity has the greatest influence on heat emission performance. The tendency was confirmed by measuring the temperature of the heat sink when the thermal conductivity was 340, 200, 100, 3.01 [W / m · K]. As a result, the temperature of the LED solder was calculated as 91.4°C, 92°C, 93.8°C and 121.2°C respectively. In the case of AL heat sink, if you consider the LED solder temperature difference between test and analysis is 34.9°C, the actual LED solder temperature was expected to be about 86.3°C at thermal conductivity of 3.01 [W / m · K].
The CMP-PLA heat sink was fabricated using the optimum material derived from the numerical analysis and the heat emission temperature test was performed. As a result, except for some measurement points, the temperature difference of about 10~20°C was observed and it was confirmed that the tendency similar to the analysis was shown. In addition, in the case of LED solder, it was confirmed that a temperature difference of 35.9~39.4°C was shown to be similar to the temperature difference (34.9°C) of the AL heat sink model, and LED solder temperature of the actual CMP-PLA heat sink was measured at about 87.4°C, which goes well with the predicted results through the analysis.
References
1. Kwon, B.C., “Ultra-compact and light-weighted through analysis of thermal analysis simulation,”
Hanbat. Univ. Report, (2016).
2. Kim, S. J., “A study on the heat transfer of the heatsink”, Taejon National Univ., (1988).
3. Park, J. M. Choi, W. S., Kwon, S. H., and Cha, J.H,
A Study on the Thermal Analysis of Circular LED Street Lights 105
![Table 1. Materials used for simulation Density [kg/m 3 ] Specific Heat [J/kg‧K] Conductivity [W/m‧K] ALDC12S 2760 900 209 A6063 2700 900 340 SL300AB 1100 900 0.18 FR4 1600 950 0.44 epoxy 1850 1100 0.3 AC2B 2770 900 340](https://thumb-ap.123doks.com/thumbv2/123dokinfo/4724318.510397/2.834.93.405.420.591/table-materials-simulation-density-specific-heat-conductivity-aldc.webp)