방조제 건설에 의한 해수면 온도 변화 추정
신동훈
1
‧ 이규석2※
Estimating Sea Surface Temperature Change after Tide Embankment Construction using
Landsat Data
Dong-Hoon SHIN
1
‧ Kyoo-Seock LEE2※
요 약
본 연구는 Landsat Thematic Mapper (TM) 영상의 열적외선 (Thermal Infrared: TIR) 밴드 자 료를 이용하여 시화호와 그 주변지역의 해수면 온도 (SST: sea surface temperature)를 검출하고, 시화방조제 공사 후의 토지피복변화를 파악하기 위해 수행되었다. 해수면 온도의 측정은 해양체계 뿐만 아니라 해양과 대기 사이의 열적인 경계범위 연구에 있어 중요하다. 1970년대 이후, AVHRR (advanced very high resolution radiometer)과 Landsat TM (Thematic Mapper)과 같은 인공위성 영상의 원격탐사기법을 이용한 해수면 온도의 추출이 이루어졌다. 그러나 AVHRR 영상 은 우리나라의 서해안 지역과 같은 매우 복잡한 해안선을 가지고 있는 지역에서는 조악한 공간 해 상도로 인해 해수표면온도 추출에 한계가 있다. Landsat TM 위성영상은 본 연구지역과 같이 복잡 하고 좁은 해안지역의 해수면 온도 추출에 유용하게 사용된다고 판단된다.1)
주요어 : Tide Embankment Construction, Sea Surface Temperature, Land Cover, Change Detection, Remote Sensing
ABSTRACT
This study investigates to detect Sea Surface Temperature (SST) and land cover change after tide embankment construction using Landsat Thematic Mapper (TM) Thermal Infrared (TIR) band data at Shihwa Lake and surrounding area. SST measurement is important for studies of both the structure of the ocean and as the thermal boundary between the ocean and the atmosphere. Since 1970s, the derivation of SST by satellite remote sensing (RS) has been applied to earth surface using Advanced Very High Resolution Radiometer (AVHRR) and Landsat TM. However, AVHRR has restriction in deriving SST in the area whose shoreline is
2006년 11월 23일 접수 Received on November 23, 2006 / 2006년 12월 21일 심사완료 Accepted on December 21, 2006 1 서울시정개발연구원 도시환경부 Department of Urban Environment, Seoul Development Institute
2 성균관대학교 조경학과 Department of Landscape Architecture, Sungkyunkwan University
※ 연락저자 E-mail : [email protected]
complicated like western coast in South Korea because of coarse spatial resolution. The TIR band of TM images can be used to detect SST change whose shoreline is complicated and narrow like the study site. Thus, multi-temporal TM images were used for SST change detection in this study.
KEYWORDS : Tide Embankment Construction, Sea Surface Temperature, Land Cover, Change Detection, Remote Sensing, Landsat TM, ETM+
INTRODUCTION
Satellite imaging can provide synoptic views of the earth surface over large areas and extended time periods (Lillesand and Kiefer, 1999). Sea Surface Temperature (SST) measurement is important for studies of both the structure of the ocean and as the thermal boundary between the ocean and the atmosphere (Emery and Yu, 1997).
Satellite Remote Sensing (RS) technique can be useful in extracting the information from the area concerned whose data are relatively homogeneous like the sea. Since 1970s, the derivation of SST by satellite RS has been applied to earth surface using Advanced Very High Resolution Radiometer (AVHRR) and Landsat Thematic Mapper (TM) (Badenas, 1997; Jeong and Yoo, 1999;
Hareman-Mountford and McGlade, 2003;
Peter, 2003; Barale et al., 2004; Anna et al., 2004; Borges et al., 2004; Gloersen and Huang, 2004; Murtugudde et al., 2004; Yoon and Cho, 2005; Choi and Kim, 2006).
Spatial resolution of AVHRR is 1.1 km × 1.1 km while thermal infrared band of Landsat TM has a spatial resolution cell of 120 by 120m and that of Enhanced Thematic Mapper Plus (ETM+) has a spatial resolution cell of 60 by 60m. AVHRR
has restriction in deriving SST and Surface Radiant Temperature (SRT) in the area whose shoreline is complicated like western coast in South Korea. By contrast, the TIR band of TM images can be used to detect SST difference in the area whose shoreline is complicated and narrow like the study site. Thus, multi-temporal TM images can be effectively used for SST change detection.
The purpose of this study is to estimate SST and land cover change after tide embankment construction using Landsat TM images at Shihwa Lake and surrounding area.
MATERIALS AND METHOD
1. Study site
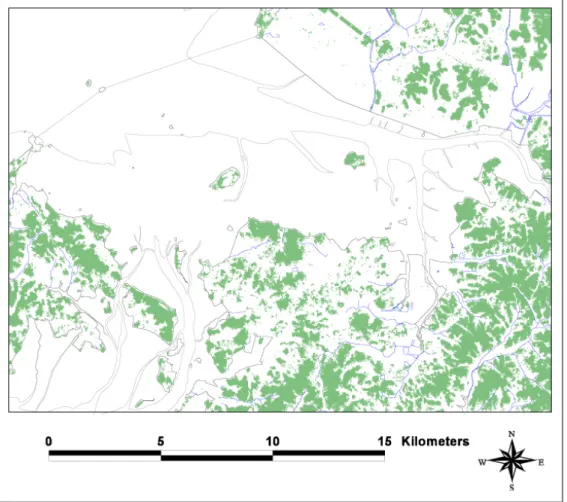
The study site is Shihwa Lake and its surrounding area located in western coast of central Korean peninsula. The latitude of the study site ranges from 126°34' to 126°45' and the longitude of study site ranges from 37°15' to 37°20'. Original Shihwa Lake was a bay with tidal lands surrounded by Ahnsan City, Shiheung City and Hwasung City. But, tide embankment construction was propelled since June 1987. It's surrounding area, Banweoul and Shihwa industrial
FIGURE 1. Study site
complex area was constructed together with seashore landfill project since 1988. Shihwa Lake shore area has been filled with land by seashore landfill project. And industrial factories began to move to industrial complex area in early 1980s and 1990s.
Shihwa Lake has been blamed for many environmental problems due to rapid water pollution after tide embankment construction.
Streams whose length is less than 10㎞
flow into Shihwa Lake such as Ahnsan Stream, Hwajeoung Stream, Banweoul Stream, Samhwa Stream, Donghwa Stream,
Moonsan Stream and Shingil Stream. Figure 1 shows the study site.
2. Data
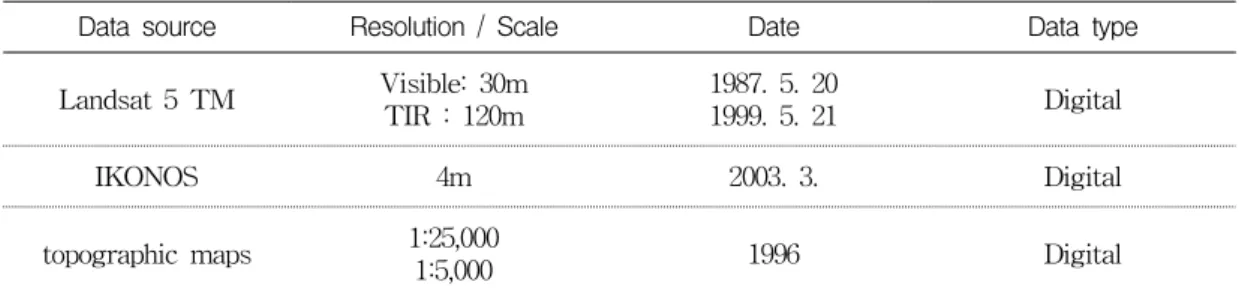
For RS data, Landsat 5 TM images were used in this study to investigate the SST change of the study area after tide embankment construction. 1:25,000 and 1:5,000 scale digital topographic maps were used to select ground control points (GCP's). Table 1 shows RS and geographic information system (GIS) data used in this
Data source Resolution / Scale Date Data type Landsat 5 TM Visible: 30m
TIR : 120m
1987. 5. 20
1999. 5. 21 Digital
IKONOS 4m 2003. 3. Digital
topographic maps 1:25,000
1:5,000 1996 Digital
TABLE 1. RS and GIS data used in this study
study. Also IKONOS satellite image were used to verify land use classification.
3. Methods
TM images taken on May 20, 1987 and May 21, 1999 were geometrically corrected into 30m resolution images by using the second order polynomial transformation and nearest neighbour resampling. For reference data, 1:25,000 and 1:5,000 scale digital topographic maps were used to select ground control points (GCP's). Then, land use was classified by using the hybrid classification method for both TM data.
After the land use classification of study site, classification accuracy assessment was done by referring to IKONOS image. The classification accuracy was obtained by overlaying classified image IKONOS interpreted land use map based on pixel by pixel comparison.
After classification they are reclassed into seven classes - urban, forest, agricultural area, bare soil, tidal land, sea water and fresh water -. In order to verify weather effects five date weather data were checked including the data TM scene taken and prior two days and later two days (May 18, 1987
- May 22, 1987 and May 19, 1999 - May 23, 1999) in this study.
SST was calculated from TM TIR band where spatial resolution is 120m. The equation was used to convert the digital number of TM TIR band into spectral radiance (Landsat Project Science Office, 2002). The next step is to convert the spectral radiance into the absolute temperature value. This is the effective at-satellite temperatures of the viewed earth-atmosphere system under an assumption of unity emissive and using pre-launch calculation. The conversion formula referred Landsat Project Science Office (2002). Also, constants that is required at calculating referred to Chander and Markham (2003).
However, temperature values obtained above are referenced to blackbody. Therefore, emissivity was corrected according to the nature of land cover. Finally, the absolute temperature value was converted into Celsius value. For RS and GIS software, PCI Ver. 7.0 and ArcView Ver.
3.2 were used in this study.
RESULTS AND DISCUSSION
Table 2 shows the trend of land cover changes between 1987 and 1999. As we can
land cover (1987) urban forest agricultural area bare
soil sea
water fresh
water tidal land total increased area
land cover (1999)
urban 12.25 12.88 29.14 23.22 14.56 0.47 3.79 96.31 84.06
forest 1.01 46.94 7.36 3.86 0.19 0.01 0.33 59.70 12.76
agricultural
area 0.59 9.04 32.39 4.17 0.42 0.07 0.64 47.32 14.93
bare soil 1.12 2.91 6.31 4.15 56.81 0.06 12.99 84.35 80.20
sea water 0.03 0.06 0.08 0.36 136.98 0.00 0.18 137.69 0.71
fresh water 0.01 0.13 0.41 0.30 0.38 0.07 0.12 1.42 1.35
tidal land 0.00 0.04 0.02 0.23 7.39 0.00 2.59 10.27 7.68
total 15.01 72.00 75.71 36.29 216.73 0.68 20.64 437.06
1decreased
area 2.76 25.06 43.32 32.14 79.75 0.61 18.05
changed area +81.30 -12.30 -28.39 +48.06 -79.04 +0.74 -10.37
1 rounding errorTABLE 2. Land use change detection in study site between 1987 and 1999(unit: ㎢)
land use types (1987) sea water
land use types (1999)
urban +14.77 (4.35)
forest +8.47 (4.16)
agricultural area +5.43 (2.59)
bare soil +13.51 (1.77)
tidal land +3.13 (1.17)
sea water +2.44 (1.25)
fresh water +2.75 (2.46)
industrial complex +15.11 (4.61)
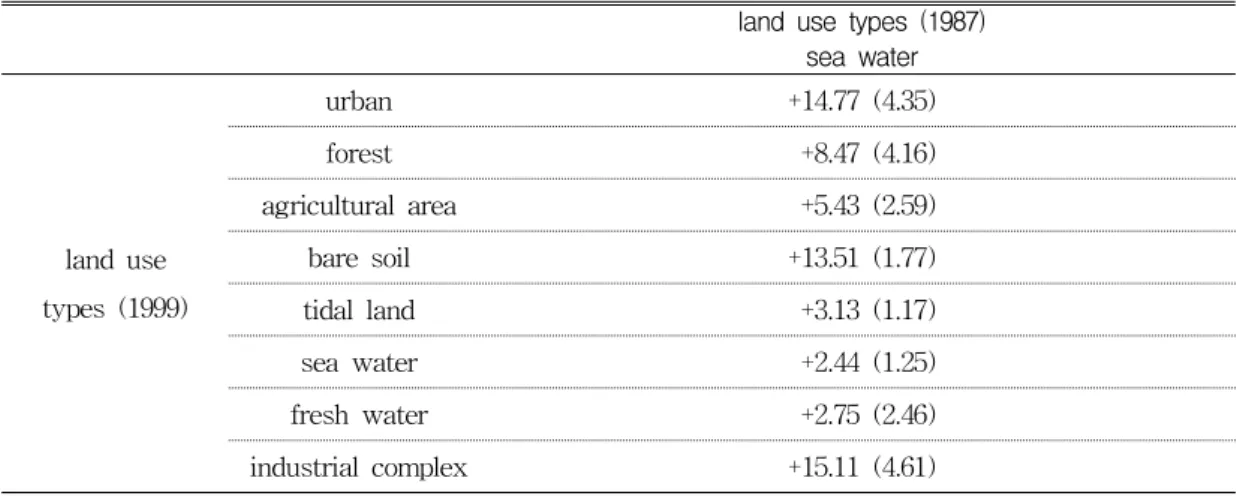
( ) : Standard deviation
TABLE 3. Mean SST change by land use change between 1987 and 1999(unit: ℃)
see in Table 2, urban area increased by 81.3
㎢ and bare soil increased 48.06㎢ while sea water area decreased by 79.04㎢. The main reason of urban and bare soil increase that
sea water changed into urban and bare soil by seashore land fill project and tide embankment construction.
Forest area decreased by 12.30㎢,
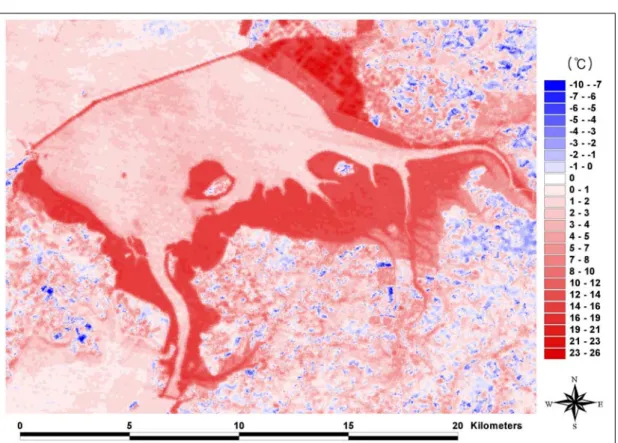
FIGURE 2. SST change between 1987 and 1999
agricultural area decreased by 28.39㎢ and tidal land area decreased by 10.37㎢. The main reasons of forest area and agricultural area decreased are urbanization such as industrial complex, road construction and growth of Ahnsan and Hwasung City. The reason of tidal land area decrease is change of land cover type as tidal land into bare soil after tide embankment construction.
To understand SST change by tide embankment construction, SST change of each land use type was derived. Table 3 and Figure 2 show SST change in the study site between 1987 and 1999. SST increased at forest changed from sea water by 8.47℃, 5.43℃ at agricultural area changed
from sea water, 13.51℃ at bare soil area changed from sea water, 3.13℃ at tidal land changed from sea water, 2.75℃ at fresh water changed from sea water. For both sea water areas between 1987 and 1999, SST increased by 2.44℃. SST increased at urban area changed from sea water by 14.77℃ due to the urbanization such as increase of urban structures and pavements along with industrial complex construction. Especially, SST increased at industrial complex changed from sea water by 15.11℃. For the SST distribution, in 1987 SST increase as it goes closer to the land. However, in 1999 high SST were observed near industrial complex the water is flowed in Shihwa Lake from
inside Shihwa Lake outside Shihwa Lake whole sea area
1987 13.73 (0.95) 13.26 (0.84) 13.54 (0.94)
1999 16.75 (1.24) 14.85 (0.85) 15.98 (1.44)
SST change +3.02 +1.59 +2.44
( ) : Standard deviation TABLE 4. SST change between 1987 and 1999(unit: ℃)
Shiheung and Ahnsan City and low SST where were observed near sluice gate where seawater flows into the lake.
To detect SST change after tide embankment construction, SST changes of inside and outside Shihwa Lake were derived (Table 4). Inside Shihwa Lake mean SST increased by 3.02℃ between 1987 (13.73℃) and 1999 (16.75℃). Outside Shihwa Lake mean SST increased by 1.59℃ between 1987 (13.26℃) and 1999 (14.85℃). The overall SST increased by 2.44℃ between 1987 (13.54℃) and 1999 (15.98℃). This means that sea surface water has been more turbid and warmer after tide embankment construction.
SST change shows the change of marine environment due to the change of flow direction and turbid material increases. Therefore, results in this study suggest that multi-spectral and multi-temporal satellite data provide continuous monitoring about these environmental changes.
CONCLUSION
This study was carried out to detect the change of land cover and SST after tide embankment construction using TM images.
SST increased and land use changed in the study site after the tide embankment construction.
(1) The largest changed land use type is urban area (increased by 81.30㎢), followed by sea water (decreased by 79.04㎢) and bare soil (increased by 48.06㎢) due to seashore land fill project and tide embankment construction.
(2) Mean SST increased inside Shihwa Lake by 3.02℃ and outside Shihwa Lake by 1.59℃. The overall SST increased by 2.44℃. This means that sea surface water has been more turbid and warmer after tide embankment construction.
(3) SST increased at industrial complex, urban, bare soil area, forest, agricultural area, tidal land and fresh water changed from sea water by 15.11℃, 14.77℃, 13.51℃, 8.4 7℃, 5.43℃, 3.13℃ and 2.75℃, respectively.
ACKNOWLEDGEMENT
This research was funded by Center for Atmospheric Sciences and Earthquake Research (CATER-2006-3-3-2) and the authors are grateful to the support.
REFERENCES