A study on charging and electrical stability characteristics with no-insulation and metal insulation in form of racetrack type coils
7
0
0
전체 글
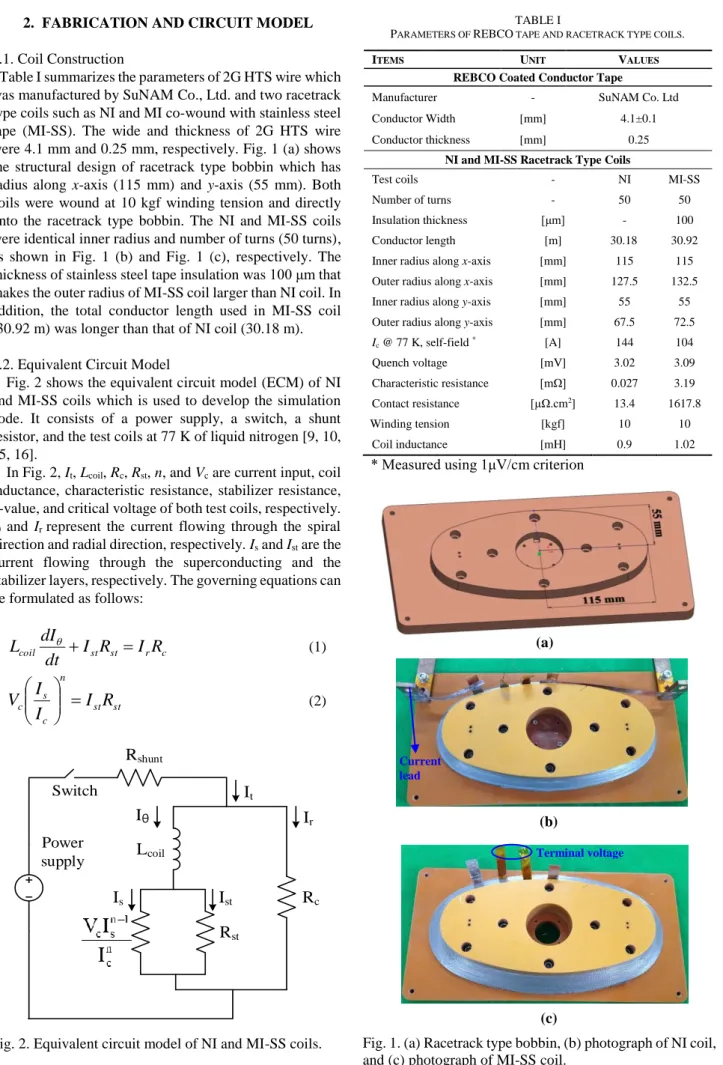
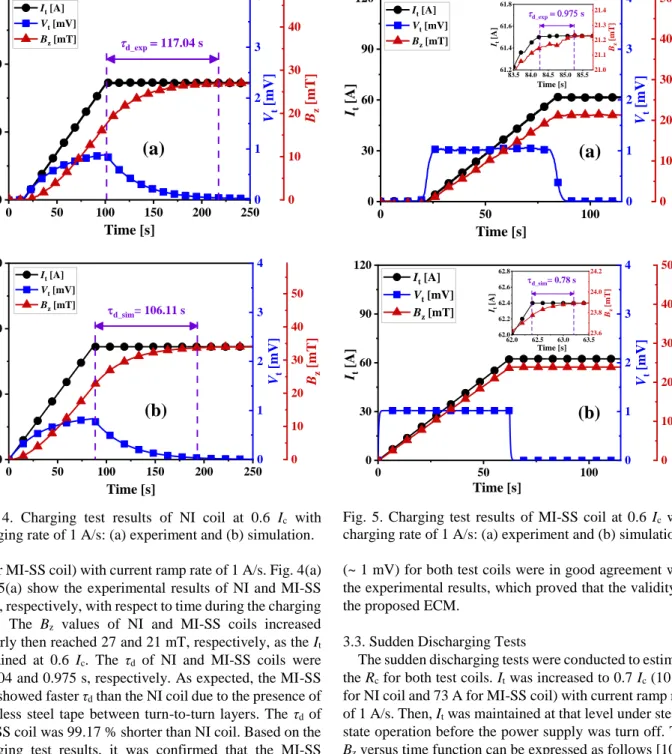
(2) 14. A study on charging and electrical stability characteristics with no-insulation and metal insulation in form of racetrack type coils. 2. FABRICATION AND CIRCUIT MODEL 2.1. Coil Construction Table I summarizes the parameters of 2G HTS wire which was manufactured by SuNAM Co., Ltd. and two racetrack type coils such as NI and MI co-wound with stainless steel tape (MI-SS). The wide and thickness of 2G HTS wire were 4.1 mm and 0.25 mm, respectively. Fig. 1 (a) shows the structural design of racetrack type bobbin which has radius along x-axis (115 mm) and y-axis (55 mm). Both coils were wound at 10 kgf winding tension and directly onto the racetrack type bobbin. The NI and MI-SS coils were identical inner radius and number of turns (50 turns), as shown in Fig. 1 (b) and Fig. 1 (c), respectively. The thickness of stainless steel tape insulation was 100 μm that makes the outer radius of MI-SS coil larger than NI coil. In addition, the total conductor length used in MI-SS coil (30.92 m) was longer than that of NI coil (30.18 m).. TABLE I PARAMETERS OF REBCO TAPE AND RACETRACK TYPE COILS. ITEMS. UNIT VALUES REBCO Coated Conductor Tape. Manufacturer. -. SuNAM Co. Ltd. Conductor Width. [mm]. 4.1±0.1. Conductor thickness. [mm]. 0.25. NI and MI-SS Racetrack Type Coils Test coils. -. NI. Number of turns. -. 50. 50. [μm]. -. 100. Insulation thickness Conductor length. [m]. 30.18. 30.92. Inner radius along x-axis. [mm]. 115. 115. Outer radius along x-axis. [mm]. 127.5. 132.5. Inner radius along y-axis. [mm]. 55. 55. Outer radius along y-axis. [mm]. 67.5. 72.5. [A]. 144. 104. [mV]. 3.02. 3.09. Ic @ 77 K, self-field *. 2.2. Equivalent Circuit Model Fig. 2 shows the equivalent circuit model (ECM) of NI and MI-SS coils which is used to develop the simulation code. It consists of a power supply, a switch, a shunt resistor, and the test coils at 77 K of liquid nitrogen [9, 10, 15, 16]. In Fig. 2, It, Lcoil, Rc, Rst, n, and Vc are current input, coil inductance, characteristic resistance, stabilizer resistance, n-value, and critical voltage of both test coils, respectively. Iθ and Ir represent the current flowing through the spiral direction and radial direction, respectively. Is and Ist are the current flowing through the superconducting and the stabilizer layers, respectively. The governing equations can be formulated as follows:. Lcoil. dI I st Rst I r Rc dt. MI-SS. Quench voltage. [mΩ]. 0.027. 3.19. [µΩ.cm2]. 13.4. 1617.8. Winding tension. [kgf]. 10. 10. Coil inductance. [mH]. 0.9. 1.02. Characteristic resistance Contact resistance. * Measured using 1μV/cm criterion. (a). (1). n. I Vc s I st Rst Ic . (2). Rshunt. Current lead. Switch. It Iθ. Power supply. Ir. Lcoil Is. (b) Terminal voltage. Ist. Rc. Rst. (c) Fig. 2. Equivalent circuit model of NI and MI-SS coils.. Fig. 1. (a) Racetrack type bobbin, (b) photograph of NI coil, and (c) photograph of MI-SS coil..
(3) 15. Huu Luong Quach, and Ho Min Kim. (3). I s I st I. (4). The characteristic resistance of both test coils can be expressed as the following equations [15]:. Rct i 1 Ci wd. Nt. Nt. Rc Ri . (5). x2 y 2 C 2 2. (6). i 1. where x is mean of the radius along x-axis and y is mean of the radius along y-axis. Rct, wd, and Ci are contact surface resistance, width of HTS coated conductor tape, and the circumference of the ith turn, respectively. The processing design for the numerical analysis can be demonstrated by the following steps. More detail about this model has been provided in the previous publication [3, 10]: Step 1: The operating current is supplied to the FCs until they reach the target values. Step 2: The material properties and critical current are estimated. Step 3: The current flowed in the spiral direction and radial direction can be obtained by the following equations:. I st I t. Rc ( Rst Rc ). (7). I r It. Rst ( Rst Rc ). (8). 3. RESULTS AND DISCUSSION 3.1. Current-Voltage Tests Fig. 3 shows the current-voltage (I-V) characteristic curves of two test coils which were performed in a bath of liquid nitrogen at 77 K to estimate the critical current (Ic) values. It increased at the same current ramp rate of 0.5 A/s for both test coils. The quench voltage (Vq) values were calculated using 1 μV/cm criterion and the total length of HTS tape used for both test coils (blue dashed line in Fig. 3). According to the Vq, the Ic values of NI and MI-SS coils were measured as 144 A and 104 A, respectively. The I-V curves were smoothed to obtain high accuracy measurement of the Ic values. As shown in Fig. 3, the voltage curve of NI coil is more stable than the MI-SS coil. This indicates that the MI-SS coil may be influenced by the thermal disturbances. 3.2. Charging Tests The charging tests of NI and MI-SS coils were carried out in liquid nitrogen bath at 77 K to observe the τd of both test coils. It was increased to 0.6 Ic (86 A for NI coil and 62 5 4. Voltage [mV]. I I r I t. E (k ) . (10). /2. 2 2 1 k sin d. (11). 0. k 1. a2 b2. 0. 30. 60. 90. 120. 150. Current [A] 5. (b). 4. Voltage [mV]. I Bz (0,0) 0 E (k ) a. 2. 0. (9). However, the center magnetic field (Bz) distribution has been updated with respect to the structural design of racetrack type coils, as shown in following equations [17]:. 3. 1. Step 4: Heat generation in the FCs can be estimated as follows:. QT Rst I st2 Rc I r2. (a). Vq = 3.02 mV. Vq = 3.09 mV. 3 2 1 0. (12). where a, b denote the radius along x-axis and y-axis respectively, and θ is the polar angle.. 0. 20. 40. 60. 80. 100. Current [A] Fig. 3. I-V characteristics of (a) NI and (b) MI-SS coils at 77 K with current ramp rate of 0.5 A/s..
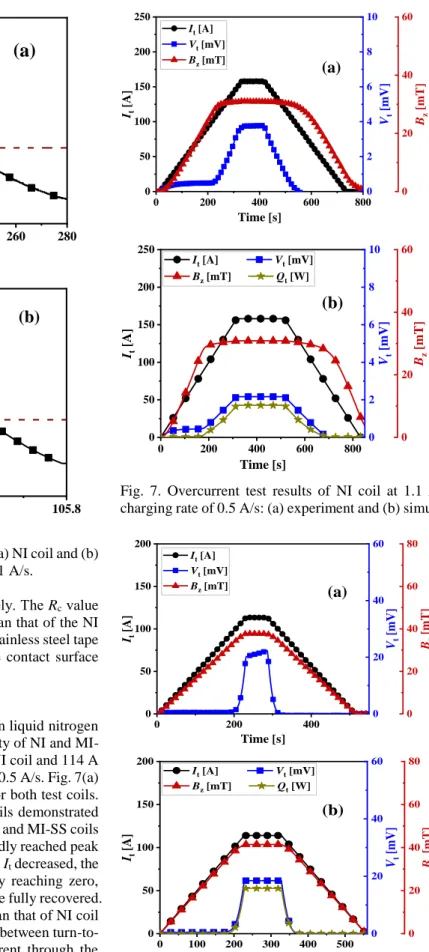
(4) 16. A study on charging and electrical stability characteristics with no-insulation and metal insulation in form of racetrack type coils. 3 30. 20. 21.3. 61.6. 50. 21.4. 21.2 61.4 21.1. Time [s]. 60. 40. 3. 61.2 21.0 83.5 84.0 84.5 85.0 85.5. It [A]. 2. Vt [mV]. It [A]. 100. Bz [mT]. 90. 4 d_exp0.975 s. 2. 30 20. Bz [mT]. 40. d_exp117.04 s. 61.8. It [A] Vt [mV] Bz [mT]. Vt [mV]. 120. Bz [mT]. 4 It [A] Vt [mV] Bz [mT]. It [A]. 150. 50. (a). 1. 0 200. 0 250. 0. 0 0. 50. Time [s]. 0. 0. 4. 50. 100. Time [s]. 150. 4 It [A] Vt [mV] Bz [mT]. 10. 120 It [A] Vt [mV] Bz [mT]. 50 d_sim= 106.11 s. 3. 90. 62.8 62.6. 24.0. 62.4 23.8 62.0 62.0. 62.5. 63.0. 23.6 63.5. 2. 60. 40. 3. Time [s]. It [A]. 30. Bz [mT]. Vt [mV]. It [A]. 2. 24.2. 62.2. 40. 100. d_sim= 0.78 s. 30 20. Bz [mT]. 150. 1. Vt [mV]. 100. (a). Bz [mT]. 50. 30. It [A]. 0. 10. 20. 50. (b). 1. (b). 30. 10 0 0. 50. 100. 150. 200. 0 250. 0. 1. 0. 0 50. 0. 10 0. 100. Time [s]. Time [s]. Fig. 4. Charging test results of NI coil at 0.6 Ic with charging rate of 1 A/s: (a) experiment and (b) simulation.. Fig. 5. Charging test results of MI-SS coil at 0.6 Ic with charging rate of 1 A/s: (a) experiment and (b) simulation.. A for MI-SS coil) with current ramp rate of 1 A/s. Fig. 4(a) and 5(a) show the experimental results of NI and MI-SS coils, respectively, with respect to time during the charging tests. The Bz values of NI and MI-SS coils increased linearly then reached 27 and 21 mT, respectively, as the It remained at 0.6 Ic. The τd of NI and MI-SS coils were 117.04 and 0.975 s, respectively. As expected, the MI-SS coil showed faster τd than the NI coil due to the presence of stainless steel tape between turn-to-turn layers. The τd of MI-SS coil was 99.17 % shorter than NI coil. Based on the charging test results, it was confirmed that the MI-SS winding technique can considerably enhance the slow τd observed in the NI winding technique due to increasing the Rc between turn-to-turn layers, resulting in a decrease leakage current. The “charging delay time” phenomenon could be explained by the proposed ECM. During the ramping time (i.e., dI/dt =1), It could be bifurcated in the spiral direction and radial direction, as shown in Fig. 2. As a results, the existence of Ir caused Is lag behind It, leading to the magnetic field loss in the test coils. Fig. 4(b) and 5(b) show the simulated results of both test coils during the charging tests. The τd values of NI and MI-SS coils were 106.11 and 0.78 s, respectively, which had the deviation around 9.3% (NI coil) and 20% (MI-SS coil) compared to the experimental results. This may be because heavy noises occurred during the experiment tests which caused by thermal disturbance. However, the simulated results of Vt. (~ 1 mV) for both test coils were in good agreement with the experimental results, which proved that the validity of the proposed ECM. 3.3. Sudden Discharging Tests The sudden discharging tests were conducted to estimate the Rc for both test coils. It was increased to 0.7 Ic (101 A for NI coil and 73 A for MI-SS coil) with current ramp rate of 1 A/s. Then, It was maintained at that level under steady state operation before the power supply was turn off. The Bz versus time function can be expressed as follows [10]:. Bz (t ) Bz ,0et /. . Lcoil Rc. (13). (14). where Bz,0 and τ are initial and decay field time values of Bz, respectively. Fig. 6 shows the experimental results of normalized Bz with respect to time for NI and MI-SS coils. To facilitate the investigation, the Bz was normalized to Bz,0 and the τ was defined at the normalized Bz value of 0.37 (i.e., Bz/Bz,0 =1/e when t = τ), as shown by the horizontal dashed line in Fig. 6. The τ values of the NI and MI-SS coils were 33.6 and 0.32 s, respectively. According to these results, the Rc values of NI and MI-SS coils, calculated by.
(5) 17. Huu Luong Quach, and Ho Min Kim. 250. 0.6 0.37. 40. 150. 6. 100. 4. 20. 0.4 50. 2. 33.6s. 0.2. 0 0. 200. 400. 0 800. 600. 0. Time [s]. 240. 260. 280 250. Time [s]. 10 It [A] Bz [mT]. 200. 1.0. 60. It [A]. 0.6. 2.0. 8. 1.5. (b). (b). 0.8. Vt [mV] Qt [W]. 40. 150. 6. 100. 4. 1.0. Qt [W]. 220. Bz [mT]. 200. Vt [mV]. 0.0 180. Normalized Bz. 8. (a). It [A]. Normalized Bz. 200. 60. Bz [mT]. (a). 0.8. 10 It [A] Vt [mV] Bz [mT]. Vt [mV]. 1.0. 20. 0.37. 50. 0.5. 2. 0.4 0.2 0.0 105.2. 0. 0.32s. 0 0. 200. 400. 600. 0. 0.0. 800. Time [s] 105.4. 105.6. 105.8. Fig. 7. Overcurrent test results of NI coil at 1.1 Ic with charging rate of 0.5 A/s: (a) experiment and (b) simulation.. Time [s] 60 It [A] Vt [mV] Bz [mT]. 60 40. It [A]. 100. 40. 20 50. 20. 0 0. 200. 0. 0. 60. 80. 8. 60. 6. 400. Time [s] 200 Vt [mV] Qt [W]. 150. 40. Vt [mV]. (b). 100. 40. 4. Qt [W]. It [A] Bz [mT]. It [A]. 3.4. Overcurrent tests The overcurrent tests were conducted in liquid nitrogen at 77 K to investigate the electrical stability of NI and MISS coils. It increased to 1.1 Ic (158A for NI coil and 114 A for MI-SS coil) at the current ramp rate of 0.5 A/s. Fig. 7(a) and 8(a) show the experimental results for both test coils. During the overcurrent tests, both test coils demonstrated self-protection characteristic. The Vt of NI and MI-SS coils started to increase at the Ic values and rapidly reached peak at 3.6 mV and 21 mV, respectively. As the It decreased, the Vt started to decrease linearly and finally reaching zero, indicating that the NI and MI-SS coils were fully recovered. The Vt value of MI-SS coil was higher than that of NI coil due to the existence of stainless steel tape between turn-toturn layers, which prevented bypass current through the adjacent turns during the overcurrent tests. The results obviously showed that the NI coil demonstrated better electrical stability than that of MI-SS coil. However, the MI-SS coil exhibited stable operation to prevent coil burnout under overcurrent test at 1.1 Ic. It is verified that the MI-SS racetrack type coil can be the potential option for. (a). Vt [mV]. 150. (14), were 0.027 and 3.19 mΩ, respectively. The Rc value of MI-SS coil was significantly higher than that of the NI coil. This is because the existence of the stainless steel tape between turn-to-turn layers increased the contact surface area in the MI-SS coil.. 80. Bz [mT]. 200. Bz [mT]. Fig. 6. Sudden discharging test results of (a) NI coil and (b) MI-SS coil at 0.7 Ic with charging rate of 1 A/s.. 20 50. 0. 0 0. 100. 200. 300. 400. 20. 2. 0. 0. 500. Time [s]. Fig. 8. Overcurrent test results of MI-SS coil at 1.1 Ic with charging rate of 0.5 A/s: (a) experiment and (b) simulation. the design HTS field coils (FCs) used in large scale offshore wind turbine generators. Fig. 7(b) and 8(b) show.
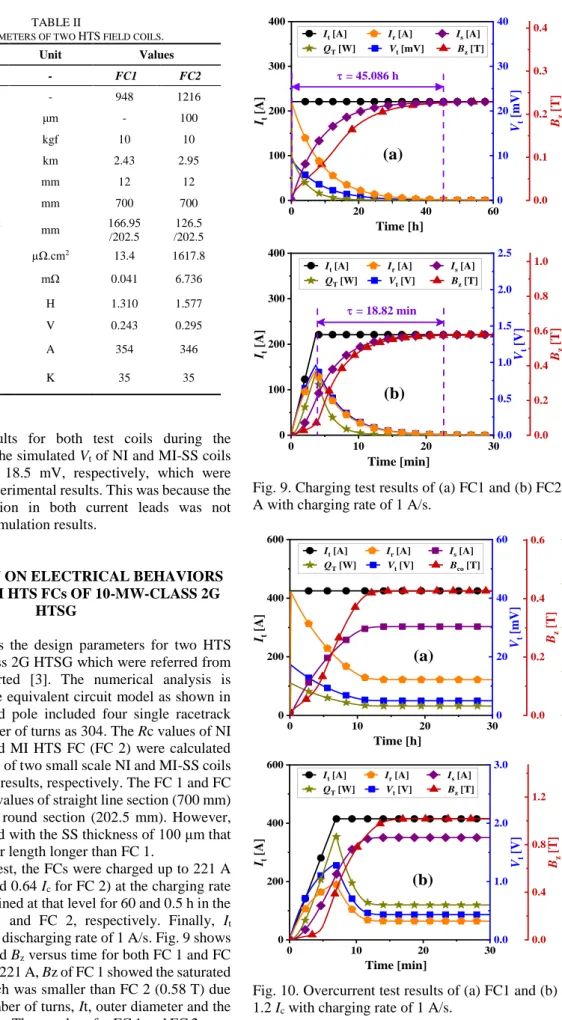
(6) A study on charging and electrical stability characteristics with no-insulation and metal insulation in form of racetrack type coils. -. 948. 1216. Insulation thickness. μm. -. 100. Winding tension. kgf. 10. 10. Conductor length†. km. 2.43. 2.95. Conductor width. mm. 12. 12. Straight section. mm. 700. 700. Inner/outer radius at round section. mm. 166.95 /202.5. 126.5 /202.5. µΩ.cm2. 13.4. 1617.8. H. 1.310. 1.577. V. 0.243. 0.295. A K. 354 35. 346. (a). 100. 10. 0 0. 20. 0 60. 40. 0.2. 4. 0.1. 2. 0.0. 0. Time [h] 400. 2.5 It [A] QT [W]. 300. Ir [A] Vt [V]. Is [A] Bz [T]. 400. 1.0. 2.0. 0.8. 300. = 18.82 min 1.5. 200 1.0. 0.6. 200. 0.4. 35. †. 100. (b). : for a pole. the simulated results for both test coils during the overcurrent tests. The simulated Vt of NI and MI-SS coils were 2.2 mV and 18.5 mV, respectively, which were smaller than the experimental results. This was because the joule heat generation in both current leads was not considered in the simulation results.. 0 0. 10. 20. 0.0 30. 0.0. 0. Fig. 9. Charging test results of (a) FC1 and (b) FC2 at 221 A with charging rate of 1 A/s. It [A] QT [W]. Ir [A] Vt [V]. 60. 0.6. 40. 0.4. 40. Is [A] Bco [T]. 30. It [A]. Vt [mV]. 400. (a). 200. 20. 20. 0.2 10. 0 0. 10. 0 30. 20. 0.0. 0. Time [h] 600. 3.0 It [A] QT [W]. Ir [A] Vt [V]. 900. Is [A] Bz [T]. 2.0. 600. Vt [V]. 400. 1.2. It [A]. Table II provides the design parameters for two HTS FCs of 10-MW-class 2G HTSG which were referred from the previous reported [3]. The numerical analysis is developed using the equivalent circuit model as shown in section 2. The field pole included four single racetrack coils with the number of turns as 304. The Rc values of NI HTS FC (FC 1) and MI HTS FC (FC 2) were calculated using the Rct values of two small scale NI and MI-SS coils in the experimental results, respectively. The FC 1 and FC 2 showed the same values of straight line section (700 mm) and outer radius at round section (202.5 mm). However, the FC 2 was wound with the SS thickness of 100 μm that makes the conductor length longer than FC 1. In the charging test, the FCs were charged up to 221 A (0.62 Ic for FC 1 and 0.64 Ic for FC 2) at the charging rate of 1 A/s and maintained at that level for 60 and 0.5 h in the cases of the FC 1 and FC 2, respectively. Finally, It decreased to zero at discharging rate of 1 A/s. Fig. 9 shows the profiles of Vt and Bz versus time for both FC 1 and FC 2. As It increased to 221 A, Bz of FC 1 showed the saturated field at 0.23 T which was smaller than FC 2 (0.58 T) due to identical the number of turns, It, outer diameter and the larger of inner radius. The τd values for FC 1 and FC 2 were 45.086 h and 18.82 min, respectively. As expected, the τd for FC 2 was 99.3 % faster than that of FC 1. Thus, the MI-. 0.2. Time [min]. 600. 4. ESTIMATION ON ELECTRICAL BEHAVIORS FOR NI AND MI HTS FCs OF 10-MW-CLASS 2G HTSG. 100. 0.5. QT [W]. Temperature operation. 6.736. 20. (b). 200. 0 0. 10. 20. 0.8. 1.0. QT [W]. Critical current. 0.041. 200. 6. 0.3. Bz [T]. Quench voltage. mΩ. 30. = 45.086 h. Bz [T]. Contact resistance Characteristic resistance Coil inductance. 300. QT [W]. FC2. QT [W]. Values. Bz [T]. FC1. Vt [mV]. -. 8. 0.4. Is [A] Bz [T]. It [A]. Unit. FC types. Ir [A] Vt [mV]. It [A]. Parameters Number of turn†. 40 It [A] QT [W]. Bz [T]. 400. TABLE II KEY PARAMETERS OF TWO HTS FIELD COILS.. Vt [V]. 18. 300 0.4. 0.0 30. 0.0. 0. Time [min]. Fig. 10. Overcurrent test results of (a) FC1 and (b) FC2 at 1.2 Ic with charging rate of 1 A/s. SS winding technique could be an effective method for the development on HTS FCs of 10-MW-class 2G HTSG due.
(7) 19. Huu Luong Quach, and Ho Min Kim. to fast charging time. The fast charging time decreases the setup time and down time for the rated operation of the wind turbine generators, resulting in an increased economic efficiency [18, 19]. In the overcurrent test, the FCs were charged up to 1.2 Ic (425 A for FC 1 and 415 A for FC 2) at the charging rate of 1 A/s and maintained at that level for 30 and 0.5 h in the cases of the FC 1 and FC 2, respectively. Finally, It decreased to zero at discharging rate of 1 A/s. Fig. 10 shows the overcurrent test results for both FCs. The Vt of FC 1 and FC 2 initially started to increase and rapidly reached maximum voltages of 17.3 mV and 1.31 V, respectively. Furthermore, the maximum heat generation in the FC 2 (544 W) was also higher than FC 1 (7.4 W). The over current test results clearly indicated that the Vt and QT increased with an increase of Rc between turn to turn layers. Although the Vt of FC 2 is higher than FC 1 during the overcurrent test, a portion of the excessive current could diverted through the stainless steel tape to prevent the FC 2 from permanent damage.. promotion program funded by Jeju National University, and in part by Korea Electric Power Corporation. (No. R18XA03).. REFERENCES [1]. [2]. [3]. [4]. [5]. 5. CONCLUSION [6]. In this study, we have investigated magnetic field response performance and electrical stability behaviors of NI and MI-SS coils, which wound in form of racetrack type coils, in the steady state and the transient state, respectively, through the experiment and simulation results to consider the suitable winding technique for the development HTS FCs of 10-MW-class 2G HTSG used in wind offshore power. Based on the experimental results of two small scale test coils, the MI-SS coil exhibited a good balance between the τd and electrical stability. The τd of MI-SS coil was estimated to be approximately 99 % faster than that of NI coil. In the overcurrent tests at 1.1 Ic, the MI-SS coil operated successfully in the event of quenching against coil from permanent damage. In contrast, although the NI coil showed great performance in terms of saving the total length of HTS tape and high electrical stability in the transient state, it suffers from the disadvantage of poor controllability owning to slow τd characteristic. This problem becomes a serious issue in terms of large scale HTS magnets which makes it less suitable for HTS FCs of 10-MW-class 2G HTSG. Overall, the MI-SS winding technique, which possesses both fast τd and high electrical stability, proposes as the effective solution to develop the HTS FCs of 10-MW-class 2G HTSG. The results would be useful reference for the design HTS FCs used in large scale offshore wind turbine generators. For a more detailed study on the τd and electrical study of MI-SS racetrack type coils, it is essential to investigate the effects of stainless steel thicknesses and winding tensions on the electrical characteristics to optimize the economic efficiency as well as the operation reliability of this insulation technique for HTS FCs.. [7]. [8]. [9]. [10]. [11]. [12]. [13]. [14]. [15]. [16]. [17] [18]. [19]. ACKNOWLEDGMENT This work was supported by the 2020 scientific. J. H. Kim, S. I. Park, T. D. Le, and H. M. Kim, “3D electromagnetic design and electrical characteristics analysis of a 10-MW-class high-temperature superconducting synchronous generator for wind power,” Prog. Supercond. Cryog., vol. 16, no. 2, pp. 47 – 53, Jun. 2014. T. D. Le et al., “Thermal design of a cryogenics cooling system for a 10 MW-class high-temperature superconducting rotating machine,” IEEE Trans. Appl. Supercond., vol. 25, no. 3, Jun. 2015, Art. no. 3800305. Y. S. Chae et al., “Design and analysis of HTS rotor-field coils of a 10-MW-class HTS generator considering various electric insulation techniques,” IEEE Trans. Appl. Supercond., vol. 30, no. 4, Jun. 2020, Art. no. 4601707. O. J. Kwon et al., “Effects of turn-to-turn compactness in the straight sections of HTS racetrack coils on thermal and electrical characteristics,” Supercond. Sci. Technol., vol. 26, no. 8, Jul. 2013. K. L. Kim et al., “Analytical and empirical studies on the characteristic resistances of no-insulation GdBCO racetrack pancake coil under various operating currents,” Curr. Appl. Phys., vol. 15, no. 1, pp. 8 – 13, Jan. 2015. J. Pelegrín, E. Martínez, L. A. Angurel, Y. -Y. Xie, and V. Selvamanickam, “Numerical and experimental analysis of normal zone propagation on 2G HTS wires,” IEEE Trans. Appl. Supercond., vol. 21, no. 3, Jun. 2011, Art. no. 3041. H. J. Shin et al., “A Study on normal zone propagation behavior of partially insulated GdBCO coil,” IEEE Trans. Appl. Supercond., vol. 25, no. 3, Jun. 2015, Art. no. 6600404. S. Hahn, D. K. Park, J. Bascuñán, and Y. Iwasa, “HTS pancake coils without turn-to-turn insulation,” IEEE Trans. Appl. Supercond., vol. 21, no. 3, Jun. 2011, Art. no. 1592. Y-G Kim et al., “Numerical analysis on bifurcated current flow in no-insulation magnet,” IEEE Trans. Appl. Supercond., vol. 24, no. 3, Jun. 2014, Art. no. 4900404. H. L. Quach et al., “Analysis on electrical and thermal characteristics of a no-insulation HTS coil considering heat generation in steady and transient states,” IEEE Trans. Appl. Supercond., vol. 29, no. 5, Aug. 2019, Art. no. 4701506. Y. H. Choi et al., “The effects of partial insulation winding on the charge-discharge rate and magnetic field loss phenomena of GdBCO coated conductor coils,” Supercond. Sci. Technol., vol. 25, no. 10, Jul. 2012. D. G. Yang, Y. H. Choi, Y. G. Kim, J. B. Song, and H. G. Lee, “Analytical and experimental investigation of electrical characteristics of a metallic insulation GdBCO coil,” Rev. Sci. Instrum., vol. 87, no. 3, Feb. 2016. D. G. Yang et al., “A study on electrical characteristics of multilayered metallic-insulation coils,” IEEE Trans. Appl. Supercond., vol. 27, no. 4, Jun. 2017, Art. no. 7700206. M-H Sohn et al., “Controllability of the contact resistance of 2G HTS coil with metal insulation,” IEEE Trans. Appl. Supercond., vol. 28, no. 3, Apr. 2018, Art. no. 4602705. X. Wang et al., “Turn-to-turn contact characteristics for an equivalent circuit model of no-insulation ReBCO pancake coil,” Supercond. Sci. Technol., vol. 26, no. 3, Jan. 2013. H. L. Quach et al., “Analytical and numerical simulation on charging behavior of no-insulation REBCO pancake coil,” Prog. Supercond. Cryog., vol. 20, no. 4, pp. 16 – 19, Dec. 2018. J. A. Miranda, “Magnetic field calculation for arbitrarily shaped planar wires,” Am. J. Phys., vol. 68, no. 3, pp. 254 – 258, Feb. 2000. S. Faulstich, B. Hahn, and P. J. Tavner, “Wind turbine downtime and its importance for offshore deployment,” Wind energy, vol. 14, no.3, pp. 327–337, Apr. 2011. S. Pfaffel, S. Faulstich, and K. Rohrig, “Performance and reliability of wind turbines: A review,” Energies, vol. 10, no. 11, Nov. 2017, Art. no. 1904..
(8)
수치

+2
관련 문서
In this regard, this study analyzes the effect of the job characteristics and work environment of workers with physical disabilities on job satisfaction
This study the changes in structure and mechanical characteristics by the analysis on mechanical characteristics of the welding part and the post weld
In this paper, we study characteristics of chromatic number which is the minimum number of colors when coloring adjacent vertices in different colors in graph coloring
• Theory can extent to molten polymers and concentrated solutions.. The single-molecule bead spring models.. a)
This study analyzed the characteristics of smokers in term of structure of household, socioeconomic status and smoking behavior and investigated whether
In this study, we developed a non-toxic titanium alloy with low elastic modulus in order to improve biocompatibility, and the surface characteristics of
In this study, water flow system of Danghang Bay, which has the narrow and long topographical characteristics with the narrow bay mouth and its flow
And then, we inspected the effectiveness of the TODWVG through a performance comparison between the TIDWVG(toe- in and delta winglet-type vortex generator)
