D I A B E T E S & M E T A B O L I S M J O U R N A L
This is an Open Access article distributed under the terms of the Creative Commons Attribution Non-Commercial License (http://creativecommons.org/licenses/by-nc/4.0/) which permits unrestricted non-commercial use, distribution, and reproduction in any medium, provided the original work is properly cited.
Patterns of Nerve Conduction Abnormalities in
Patients with Type 2 Diabetes Mellitus According to the Clinical Phenotype Determined by the Current Perception Threshold
Joong Hyun Park1, Jong Chul Won2,3
Departments of 1Neurology, 2Internal Medicine, 3Cardiovascular and Metabolic Disease Center, Inje University Sanggye Paik Hospital, Inje University College of Medicine, Seoul, Korea
Background: Clinical manifestations of diabetic peripheral neuropathy (DPN) vary along the course of nerve damage. Nerve conduction studies (NCS) have been suggested as a way to confirm diagnoses of DPN, but the results have limited utility for eval- uating clinical phenotypes. The current perception threshold (CPT) is a complementary method for diagnosing DPN and assess- ing DPN symptoms. We compared NCS variables according to clinical phenotypes determined by CPT measurements.
Methods: We retrospectively enrolled patients with type 2 diabetes mellitus who underwent both NCS and CPT tests using a neu- rometer. CPT grades were used to determine the clinical phenotypes of DPN: normoesthesia (0 to 1.66), hyperesthesia (1.67 to 6.62), and hypoesthesia/anesthesia (6.63 to 12.0). The Michigan Neuropathy Screening Instrument (MNSI) was used to determine a subjective symptom score. DPN was diagnosed based on both patient symptoms (MNSI score ≥3) and abnormal NCS results.
Results: A total of 202 patients (117 men and 85 women) were included in the final analysis. The average age was 62.6 years, and 71 patients (35.1%) were diagnosed with DPN. The CPT variables correlated with MNSI scores and NCS variables in patients with diabetes. Linear regression analyses indicated that hypoesthesia was associated with significantly lower summed velocities and sural amplitudes and velocities, and higher summed latencies, than normoesthesia. Sural amplitude was significantly lower in patients with hyperesthesia than in patients with normoesthesia.
Conclusion: NCS variables differed among patients with diabetes according to clinical phenotypes based on CPT and decreased sural nerve velocities was associated with hyperesthesia.
Keywords: Diabetic neuropathies; Neural conduction; Sensory thresholds; Sural nerve
Corresponding author: Jong Chul Won https://orcid.org/0000-0002-2219-4083 Department of Internal Medicine, Inje University Sanggye Paik Hospital, Cardiovascular and Metabolic Disease Center, Inje University College of Medicine, 1342 Dongil-ro, Nowon-gu, Seoul 01757, Korea
E-mail: [email protected]
INTRODUCTION
Diabetic peripheral neuropathy (DPN) is the most common and early complication of diabetes [1,2]. Accumulating evi- dence suggests that half of patients with type 2 diabetes melli- tus (T2DM) will eventually experience neuropathy and pro- gressive injury of nerve fibers during the course of diabetes, and severe neuropathic symptoms result in poor quality of life
[3]. Although it has been suggested that the diagnosis of DPN can be confirmed by electrophysiological nerve conduction studies (NCS) [1], NCS do not always detect early changes due to nerve damage. In addition, NCS tests are limited for evaluat- ing the clinical characteristics of DPN in patients with various symptoms.
The perception threshold test (current perception threshold [CPT]) has been used to quantify sensory fiber function from https://doi.org/10.4093/dmj.2018.0068
pISSN 2233-6079 · eISSN 2233-6087
the early asymptomatic to advanced severe neuropathic symp- tom stages by assessing the functions of all three major sub- groups of sensory nerve fibers: Aβ, Aδ, and C-fibers [4]. This enables the qualification of clinical phenotypes according to an automated grading system: normoesthesia, hyperesthesia, and hypoesthesia [5,6]. However, it is not known how NCS mea- surements and clinical phenotypes differ in patients with dia- betes. We investigated the changes in NCS variables in patients with diabetes based on the clinical phenotypes determined by CPT and attempted to identify the differences between pa- tients with diabetes and those with hyperesthesia in terms of these variables.
METHODS
Subjects
Retrospective medical data were collected for patients with T2DM who were referred to the Diabetes Clinic of Inje Uni- versity Sanggye Paik Hospital by a nearby clinic or hospital for further management of their hyperglycemia and evaluation of complications from January 2014 to December 2016; such management and evaluation addressed clinical, laboratory, and electrophysiological variables. The study enrolled patients with T2DM (n=265) examined on at least one previous occa- sion using both NCS and CPT within 3 weeks. Exclusion crite- ria were as follows: exposure history to drugs or toxins that can provoke peripheral neuropathy, presence of carpal tunnel syn- drome or other causes of peripheral neuropathy (alcohol con- sumption, renal failure, hypothyroidism, and vasculitis), and typical musculoskeletal anomalies. Clinical data included de- mographic data, duration of diabetes mellitus, diabetic neu- ropathy control medicine, Michigan Neuropathy Screening Instrument (MNSI) questionnaire score (abnormal was de- fined as three or more positive responses) [7], CPT results, and NCS variables. Body mass index was calculated as weight in kilograms divided by the square of height in meters. Hyperten- sion was defined as blood pressure ≥140/90 mm Hg or the use of anti-hypertensive medication. This study was approved by the Inje University Sanggye Paik Hospital Research Ethics Committee (2017–02–032–003).
CPT assessment
CPT measurements were performed using a neurometer (Neurotron, Baltimore, MD, USA). This device, which gener- ates a constant alternating current (AC) stimulus, was applied
at two different test sites: the right index finger (C7 derma- tome) and the right big toe (L4/5 dermatome) [4]. The CPT was measured by a well-trained technician from the Cardio- vascular and Metabolic Disease Center of Inje University Sang- gye Paik Hospital. When a site on the right side was not test- able, the assessment was performed on the left side. In brief, after a pair of small (1 cm) electrodes was taped to the test site, a conductive gel was used to maintain contact with the skin.
The electrical stimulus was increased slowly until the patients reported a sensation. Three different frequencies of AC were applied: 2,000, 250, and 5 Hz. The procedure took an average of 7 minutes per patient. The CPT values were graded using Neuval software, which is provided with the device (grade 0=no abnormal measures; grade 12=completely anesthetic).
This enabled the quantification of the automated grading sys- tem, and the CPT grade at the L4/5 dermatome was used to classify patients by the clinical DPN phenotypes as follows:
normoesthesia (grade range, 0 to 1.66), hyperesthesia (grade range, 1.67 to 6.62), and hypoesthesia/anesthesia (grade range, 6.63 to 12.0) [8].
Conventional electrophysiological study
One technician performed NCS using standard methods [9].
Electromyography (Sierra Wave EMG system; Cadwell Indus- tries, Kennewick, WA, USA) with standard filter settings (2 Hz to 10 kHz) and a surface stimulator was used for NCS. Round disk electrodes with a diameter of 10 mm were used to record potentials. The test was performed on the upper and lower ex- tremities with more pronounced neuropathic symptoms (if a study was not testable on one side, it was performed on the other). The parameters included: distal motor and sensory la- tency, compound muscle action potential (CMAP) amplitude measured from negative to the negative peak, sensory nerve action potential (SNAP) amplitude measured from the nega- tive to positive peak, and the motor and sensory conduction velocity. The average value from 10 or more responses was ob- tained. The instrument automatically calculated latencies and amplitudes. The motor and sensory conduction velocity was calculated by dividing the measured distance by the onset la- tency. Measurements were considered abnormal if they were outside normal limits after adjusting for age and height. The measured nerves and normal values of parameters were distal latency <3.9, <3.0, <5.3, and <5.4 m/sec for the median, ul- nar, peroneal, and tibial nerves, respectively; CMAP >5, >6,
>1, and >6 mV for the median, ulnar, peroneal, and tibial
nerves; SNAP >10, >5, and >10 µV for the median, ulnar, and sural nerves; and nerve velocity >50.5, >49.4, >40.5, >41.1, and >32.1 m/sec for the median, ulnar, peroneal, tibial, and sural nerves. Abnormal NCS results were defined as more than one abnormal attribute in two separate nerves [10]. NCS vari- ables in the lower extremities were included in these analyses.
Diagnosis of DPN
The diagnosis of DPN was confirmed if both patient symptoms (MNSI score ≥3) [7] and abnormal results of NCS as recom- mended by the Toronto Diabetic Neuropathy Expert Group [11] were satisfied.
Statistical analyses
SPSS version 23 (IBM Co., Armonk, NY, USA) statistical soft- ware was used to carry out the analyses. All data are expressed as the mean±standard deviation (SD). Differences in mean values or the prevalence of disease between groups were as- sessed using the independent Student’s t-test, chi-square test, or analysis of variance, as appropriate. Variables showing a non-normal distribution in the Kolmogorov-Smirnov test were logarithmically transformed before analyses. Binary lo- gistic regression analyses were performed with DPN as a di- chotomous dependent variable (0=no, 1=yes). The predictors
used were age, sex, glycosylated hemoglobin (HbA1c) level, and duration of diabetes. The Nagelkerke coefficient of deter- mination (R2) was applied. We calculated the area under the receiver operating characteristic (ROC) curve to examine the sensitivity and specificity of CPT grade to identify patients with DPN, and the Youden index J was used to determine the optimal cut-off CPT grade for the diagnosis of DPN using MedCalc Statistical Software version 18 (MedCalc Software, Ostend, Belgium; http://www.medcalc.org; 2018). Correlations between variables were assessed using Pearson’s correlation co- efficient analyses. Linear regression analyses were performed with the NCS variables as dependent variables. The CPT phe- notype was used as a predictor transformed to dummy vari- ables in models 1 (no adjustment) and 2 (adjusted for age, sex, duration of diabetes, and HbA1c). When performing a two- sided test, P<0.05 was considered statistically significant.
RESULTS
Demographics and prevalence of DPN
Of a total of 265 patients with T2DM, we excluded patients with an exposure history of drugs or toxins that can provoke peripheral neuropathy (n=18; 14 chemotherapy for malignan- cy, four anti-tuberculosis medication), presence of carpal tun- Table 1. Patient demographics
Variable Total (n=202) Non-DPN (n=128) DPN (n=74) P value
Female sex 85 (42.1) 53 (40.5) 32 (45.1) 0.553
Age, yr 62.6±12.3 62.3±11.6 63.2±13.6 0.629
BMI, kg/m2 23.7±3.3 23.7±3.2 23.6±3.4 0.931
Duration of diabetes, yr 12.7±8.5 11.4±7.4 15.2±9.8 0.007
Hypertension 101 (50.0) 67 (51.1) 34 (47.9) 0.768
HbA1c, % 8.9±2.7 8.6±2.3 9.6 ±3.0 0.017
FPG, mg/dL 202.4±103.3 167.6±56.0 284.3±141.2 0.021
PPG, mg/dL 270.1±117.3 263.4±115.9 288.0±120.6 0.259
TC, mg/dL 167.2±45.0 164.9±41.4 170.7±50.2 0.424
TG, mg/dL 150.3±84.7 150.3±92.4 150.4±64.3 0.994
HDL-C, mg/dL 45.0±12.1 44.6±11.5 46.0±13.9 0.549
LDL-C, mg/dL 110.3±33.0 108.4±32.1 114.6±35.0 0.344
MNSI score 2.8±2.3 1.8±1.9 4.7±1.7 <0.001
Abnormal NCS 133 (65.8) 62 (47.3) 71 (100.0) <0.001
Values are presented as number (%) or mean±standard deviation.
DPN, diabetic peripheral neuropathy; BMI, body mass index; HbA1c, glycosylated hemoglobin; FPG, fasting plasma glucose; PPG, postprandi- al glucose; TC, total cholesterol; TG, triglyceride; HDL-C, high density lipoprotein cholesterol; LDL-C, low density lipoprotein cholesterol;
MNSI, Michigan Neuropathy Screening Instrument; NCS, nerve conduction study.
nel syndrome (n=27) and other causes of peripheral neuropa- thy (n=18; six alcohol consumption, nine end-stage renal dis- ease on dialysis, three hypothyroidism). Ultimately, a total of 202 patients (117 men and 85 women) were included. Demo- graphic and clinical characteristics are presented in Table 1.
The mean average age was 62.6 years. The mean HbA1c level was 8.9%±2.7%, and the mean duration of diabetes was 12.7±
8.5 years. A total of 71 patients (35.1%) were diagnosed with DPN. A longer duration of diabetes and poorly controlled gly- cemic status (HbA1c and fasting plasma glucose) were ob- served in patients with DPN compared to those without DPN (P<0.05).
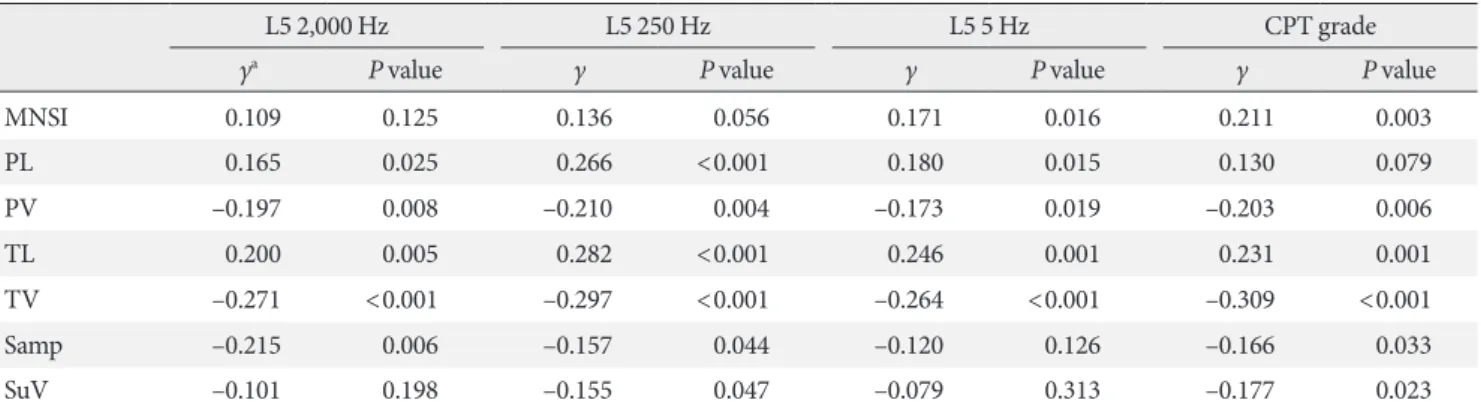
Relationships between CPT measures and MNSI and NCS variables
The relationships between measures of DPN (MNSI scores and NCS variables) and CPT variables were investigated by univar- iate correlation analyses (Table 2). The Pearson correlation (γ) between CPT grade and MNSI score was 0.211 (P=0.003).
Each CPT variable (L5: 5, 250, and 2,000 Hz) was significantly correlated or inversely correlated with tibial and peroneal nerve conduction velocities and latencies, respectively. The CPT grade was significantly correlated with nerve conduction velocities in the lower extremities, and tibial nerve latency and sural nerve amplitude.
Diagnostic value of CPT measures for DPN
In bivariate logistic regression analyses in which the dependent variable was the presence or absence of DPN, the CPT grade
was related to the presence of DPN (R2=18.4%; odds ratio [OR], 1.17; 95% confidence interval [CI], 1.07 to 1.28; P=
0.001) after adjusting for age, sex, HbA1c, and duration of diabetes. ROC curve analyses found an area under the curve (AUC) of 0.661 (95% CI, 0.591 to 0.726; P<0.001). The sensi- tivity was 77.5%, the specificity was 46.2%, and the Youden in- dex J was 0.24, with a CPT grade cut-off point greater than the associated criterion of 1.0 (Fig. 1).
Fig. 1. Receiver operating characteristic curves of the current perception threshold (CPT) measurements for the diagnosis of diabetic peripheral neuropathy. AUC, area under the curve.
100 80 60 40 20 0
Sensitivity
0 20 40 60 80 100 100-Specificity
AUC=0.661 P<0.001 CPT grade
Table 2. Univariate correlation coefficients for relationships between diabetic peripheral neuropathy indices and CPT measure- ments
L5 2,000 Hz L5 250 Hz L5 5 Hz CPT grade
γa P value γ P value γ P value γ P value
MNSI 0.109 0.125 0.136 0.056 0.171 0.016 0.211 0.003
PL 0.165 0.025 0.266 <0.001 0.180 0.015 0.130 0.079
PV –0.197 0.008 –0.210 0.004 –0.173 0.019 –0.203 0.006
TL 0.200 0.005 0.282 <0.001 0.246 0.001 0.231 0.001
TV –0.271 <0.001 –0.297 <0.001 –0.264 <0.001 –0.309 <0.001
Samp –0.215 0.006 –0.157 0.044 –0.120 0.126 –0.166 0.033
SuV –0.101 0.198 –0.155 0.047 –0.079 0.313 –0.177 0.023
CPT, current perception threshold; MNSI, Michigan Neuropathy Screening Instrument; PL, peroneal latency; PV, peroneal velocity; TL, tibial latency; TV tibial velocity; Samp, sural amplitude; SuV, sural velocity.
aPearson coefficients.
Clinical and electrophysiological characteristics of patients by CPT phenotype: normoesthesia, hyperesthesia, and hypoesthesia
There were no significant differences in demographic and lab- oratory findings among the patients according to CPT pheno- types (normoesthesia, hyperesthesia, and hypoesthesia) (Table 3). Although several demographic (age and duration of diabe- tes) and clinical (HbA1c, postprandial glucose, total cholester- ol, and high- and low-density lipoprotein cholesterol levels) variables differed between patients with hyperesthesia and those with normoesthesia or hypoesthesia, these differences
did not reach levels of statistical significance. A chi-square test of independence was calculated to compare the frequency of DPN in patients with the three CPT phenotypes, and a signifi- cant interaction was found (χ2(2)=12.69, P=0.002). Patients with DPN were more likely to exhibit hypoesthesia. Most NCS variables differed between patients with normoesthesia and hypoesthesia. Where peroneal and tibial nerve velocities were lower in patients with hypoesthesia than in those with normo- esthesia or hyperesthesia, the latencies in those nerves were higher.
Table 3. Comparisons of demographics and DPN indices in patients with normoesthesia, hyperesthesia, and hypoesthesia
Variable Normoesthesia (n=84) Hyperesthesia (n=62) Hypoesthesia (n=56) P value
L5 2,000 Hza 321.1±75.9 268.4±115.5b 574.2±228b,c <0.001
L5 250 Hza 109.9±31.1 79.4±51.5b 309.3±257.8b,c <0.001
L5 5 Hza 64.3±27.9 42.7±39.0b 182.2±205.3b,c <0.001
CPT grade 0.4±0.5 4.7±1.0b 8.5±1.5b,c <0.001
Female sex 36 (42.9) 28 (45.2) 21 (37.5) 0.689
Age, yr 63.0±12.0 61.9±11.9 62.7±13.3 0.865
BMI, kg/m2 23.6±3.2 24.2±3.7 23.2±3.0 0.291
Duration of diabetes, yr 12.4±7.9 11.9±8.2 14.3±9.6 0.291
Hypertension 42 (50.0) 35 (56.5) 24 (42.9) 0.337
HbA1c, % 9.0±2.8 8.7±2.6 9.1±2.6 0.739
FPG, mg/dL 182.9±80.3 232.1±139.9 200.7±95.7 0.527
PPG, mg/dL 277.3±120.1 253.3±111.0 276.1±120.1 0.551
TC, mg/dL 167.9±40.7 164.0±46.6 170.0±49.3 0.790
TG, mg/dL 145.1±85.5 151.0±76.7 157.5±93.2 0.782
HDL-C, mg/dL 45.3±10.3 46.9±13.8 42.2±12.3 0.222
LDL-C, mg/dL 113.9±34.9 103.7±25.9 111.2±35.9 0.334
MNSI score 2.5±2.3 2.7±2.0 3.4±2.6 0.057
Abnormal NCS 49 (58.3) 39 (62.9) 45 (80.4)b 0.022
DPN 19 (22.6) 23 (37.1) 29 (51.8)b 0.002
PL, ms 3.9±0.8 4.0±0.8 4.2±1.0 0.070
PV, m/sec 42.4±5.2 42.5±6.7 39.3±5.6b,c 0.009
TL, ms 4.0±0.6 4.0±0.7 4.3±0.9b,c 0.014
TV, m/sec 41.7±4.9 41.4±6.1 37.8±6.1b,c <0.001
Samp, μV 14.6±8.5 12.8±6.3 10.9±6.6b 0.043
SuV, m/sec 36.6±4.6 36.1±5.0 34.1±4.2b 0.028
Values are presented as mean±standard deviation or number (%).
DPN, diabetic peripheral neuropathy; CPT, current perception threshold; BMI, body mass index; HbA1c, glycosylated hemoglobin; FPG, fast- ing plasma glucose; PPG, postprandial glucose; TC, total cholesterol; TG, triglyceride; HDL-C, high density lipoprotein cholesterol; LDL-C, low density lipoprotein cholesterol; MNSI, Michigan Neuropathy Screening Instrument; NCS, nerve conduction study; PL, peroneal latency; PV, peroneal velocity; TL, tibial latency; TV, tibial velocity; Samp, sural amplitude; SuV, sural velocity.
aValue of L5 2,000 Hz, 250 Hz, and 5 Hz mean current perception threshold (log transformed before analysis), bP<0.05 vs. normoesthesia,
cP<0.05 vs. hyperesthesia.
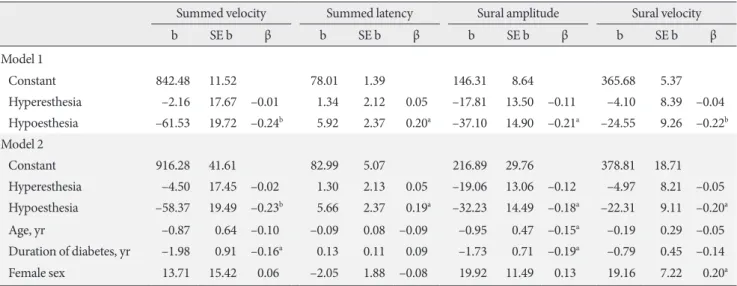
Logistic regression of NCS variables for CPT phenotypes Linear regression analysis was used to assess whether the NCS variables differed significantly by CPT phenotype after adjust- ing for demographic factors and HbA1c levels. Hypoesthesia but not hyperesthesia was associated with significantly lower
summed (tibial and peroneal nerve) velocities and sural ampli- tudes and velocities, but higher summed latencies compared to normoesthesia (Table 4). To explore the differences in NCS variables between normoesthesia and hyperesthesia over the clinical course of DPN, we performed the same analyses by Table 4. Linear regression evaluating the associations between clinical phenotypes and indices of nerve conduction studies in the whole population
Summed velocity Summed latency Sural amplitude Sural velocity
b SE b β b SE b β b SE b β b SE b β
Model 1
Constant 842.48 11.52 78.01 1.39 146.31 8.64 365.68 5.37
Hyperesthesia –2.16 17.67 –0.01 1.34 2.12 0.05 –17.81 13.50 –0.11 –4.10 8.39 –0.04 Hypoesthesia –61.53 19.72 –0.24b 5.92 2.37 0.20a –37.10 14.90 –0.21a –24.55 9.26 –0.22b Model 2
Constant 916.28 41.61 82.99 5.07 216.89 29.76 378.81 18.71
Hyperesthesia –4.50 17.45 –0.02 1.30 2.13 0.05 –19.06 13.06 –0.12 –4.97 8.21 –0.05 Hypoesthesia –58.37 19.49 –0.23b 5.66 2.37 0.19a –32.23 14.49 –0.18a –22.31 9.11 –0.20a
Age, yr –0.87 0.64 –0.10 –0.09 0.08 –0.09 –0.95 0.47 –0.15a –0.19 0.29 –0.05
Duration of diabetes, yr –1.98 0.91 –0.16a 0.13 0.11 0.09 –1.73 0.71 –0.19a –0.79 0.45 –0.14
Female sex 13.71 15.42 0.06 –2.05 1.88 –0.08 19.92 11.49 0.13 19.16 7.22 0.20a
Model 1: no adjustment; Model 2: adjusted for age, sex, diabetes duration, and glycosylated hemoglobin.
b, coefficients; SE b, standard error.
aP<0.05, bP<0.01 compared to normoesthesia.
Table 5. Linear regression evaluating the associations between clinical phenotypes and indices of nerve conduction studies in pa- tients with hyperesthesia according to DPN status
Summed velocity Summed latency Sural amplitude Sural velocity
b SE b β b SE b β b SE b β b SE b β
Model 1
Constant 897.50 19.16 78.40 2.67 209.95 15.99 390.40 8.24
Hyperesthesia/DPN (–) 35.61 34.40 0.13 –1.18 4.79 –0.04 –64.06 28.71 –0.30a 24.04 14.78 0.18 Hyperesthesia/DPN (+) –120.27 26.48 –0.56b 7.65 3.69 0.31a –104.55 22.62 –0.61b –68.30 11.65 –0.64b Model 2
Constant 853.02 66.03 90.39 9.02 294.66 57.93 427.04 28.39
Hyperesthesia/DPN (–) 32.48 34.76 0.12 –2.95 4.75 –0.09 –74.33 29.25 –0.34a 20.58 14.33 0.15 Hyperesthesia/DPN (+) –124.22 27.20 –0.58b 6.33 3.71 0.26 –107.05 23.30 –0.63b –67.49 11.42 –0.63b
Age, yr 0.45 1.08 0.05 –0.23 0.15 –0.22 –1.62 0.95 –0.22 –0.69 0.46 –0.15
Duration of diabetes, yr 0.14 1.81 0.01 0.43 0.25 0.25 0.85 1.53 0.07 –0.59 0.75 –0.08
Female sex 46.52 25.12 0.21 –3.84 3.43 –0.15 18.17 21.50 0.11 27.63 10.54 0.26a
Model 1: no adjustment; Model 2: adjusted for age, sex, diabetes duration, and glycosylated hemoglobin.
DPN, diabetic peripheral neuropathy; b, coefficients; SE b, standard error.
aP<0.05, bP<0.01 compared to normoesthesia without DPN. Normoesthesia without DPN (n=20), hyperesthesia without DPN (n=10), and hyperesthesia with DPN (n=23).
transforming dummy variables as normoesthesia without DPN and hyperesthesia without and with DPN. Hyperesthesia both without and with DPN was associated with significant re- ductions in the sural nerve amplitude (adjusted R2=0.29, F(2, 46)=10.79, P<0.001; β=–0.30, P=0.031; and β=–0.61, P< 0.001, respectively). These associations remained significant after ad- justing for age, sex, duration of diabetes, and HbA1c levels (Ta- ble 5).
DISCUSSION
CPT variables were correlated with MNSI scores and NCS variables in patients with diabetes, and those with a CPT grade indicating hypoesthesia were more likely to show deterioration in NCS results. NCS variables differed significantly by CPT phenotypes after adjusting for confounding factors. Hypoes- thesia, but not hyperesthesia, was associated with significantly lower summed velocities (tibial and peroneal nerves) and am- plitudes and velocities of the sural nerve, but higher summed latencies (tibial and peroneal nerves) compared to normoes- thesia. Interestingly, multiple linear regression analyses indi- cated that the lower sural nerve amplitudes were associated with hyperesthesia regardless of DPN.
Both NCS and CPT are used to assess the severity of DPN, but they have been used differently depending on the purpose of the evaluation [12]. NCS are recommended as a gold stan- dard for diagnosing DPN and should help in assessing large-fi- ber nerve damage [1]. The diagnostic role of NCS in the early detection of nerve damage in patients with diabetes has long been studied, but its use in the clinical evaluation of patients’
symptoms and corresponding nerve damage is neither practi- cal nor possible [13,14]. Nevertheless, CPT may have merit in assessing the presence or absence of early DPN, because it is used as a quantitative sensory test to assess nerve fiber impair- ment [15-17]; specifically, it evaluates sensory perception thresholds using different electrical currents: 5 Hz for unmy- elinated C-fibers, 250 Hz for thin myelinated Aδ-fibers, and 2,000 Hz for large myelinated Aβ-fibers [18]. However, NCS variables have not previously been studied according to clinical phenotypes based on CPT grades in patients with diabetes.
In this study, each measure of CPT at different stimuli (5 to 2,000 Hz) was correlated with the NCS variables (velocities and latencies) for sensory nerves in the lower extremities. The CPT grades had stronger correlations with these variables and were related to the presence of DPN (OR, 1.17; 95% CI, 1.07 to
1.28; P=0.001) after adjusting for age, sex, HbA1c levels, and duration of diabetes. Therefore, we used the CPT grade rather than each frequency of CPT measurement, provided by the Neuval software accompanying the neurometer, to evaluate the functional integrity of peripheral nerve damage in patients with diabetes and to classify the clinical phenotypes for clinical purposes.
Along with the CPT phenotypes, the proportion of patients with abnormal NCS increased significantly (χ2(2)=7.59, P=
0.022). The hypoesthesia group was more likely to exhibit dete- rioration in the NCS variables compared with the normoesthe- sia or hyperesthesia group (Tables 3 and 4), which is consistent with many previous studies [5,6]. In our study, nearly half the patients with abnormal NCS (n=62/133) remained subclinical (MNSI score ≤3), which is also in agreement with previous re- ports [19]. Among these, 30 patients (48.4%) were stratified as normoesthetic. Therefore, the role of neurometry in the diag- nosis of nerve injury in patients with subclinical DPN is limit- ed, and the diagnostic value of neurometry was not sufficiently high to supplant NCS (specificity 46.2%, Youden index J 0.24).
However, threshold for CPT at each frequency was significant- ly decreased in patients with hyperesthesia compared with those with normoesthesia, and they were increased in patients with hypoesthesia; however, all the NCV variables for the low- er extremities and the mean MNSI score in patients with hy- peresthesia did not differ from those in patients with normoes- thesia. Because hyperesthesia precedes hypoesthesia in the progression of DPN [20], this likely reflects a continuum in the natural history of diabetic neuropathy from normal nerve function (normoesthesia) to excitable nerve damage (hyperes- thesia), and then hypoesthesia or anesthesia [19]. Therefore, using neurometry for evaluating DPN in patients with T2DM could discriminate among the clinical phenotypes in patients with subclinical DPN. The detection of hyperesthesia based on CPT grade even before abnormal NCS findings develop could provide an opportunity to prevent diabetic foot problems [21].
Recently, neuropathic pain phenotyping has been suggested to predict the response to different mechanism-based medica- tions [22]. Therefore, this complementary diagnostic approach may lead to more stratified treatment and, potentially, to per- sonalized pain therapy.
Logistic regression analysis indicated that decreased sural nerve velocities were significantly associated with hyperesthe- sia compared with normoesthesia with normal NCS results re- gardless of DPN (Table 5). A lower conduction velocity or
SNAP of the sural nerve has a high sensitivity in the diagnosis of peripheral polyneuropathy. One study observed sural nerve conduction abnormalities in 38% and 42% of patients with the subclinical stage of type 1 diabetes mellitus (T1DM) and T2DM, respectively, but no other peripheral nerve abnormali- ties were found [23]. Pastore et al. [24] suggested that both su- ral action potential amplitudes and sural conduction velocities are useful for detecting DPN in T1DM and T2DM patients.
Recently, Zhang et al. [25] showed that sensory nerve abnor- malities, particularly sural action potential amplitudes, were more obvious than were motor nerve abnormalities in symp- tomatic diabetes patients than in asymptomatic healthy con- trols. In agreement with previous studies [23-25], all the NCS indices in our study showed compatible changes in patients with DPN: lower nerve conduction velocities and higher laten- cies of sensory and motor nerves; additionally, we suggest that decreased sural nerve velocities reflect nerve injuries in pa- tients with hyperesthesia.
Several limitations of this study should be considered. First, this was a single-center study performed at a tertiary center, not in the community, with a relatively small number of pa- tients. However, we calculated sample size with the Z-test in binary logistic regression analyses using G*Power (http://
www.gpower.hhu.de/). The mean±SD CPT grade was 4.0±3.5 in the study population, and the prevalence of DPN below the mean CPT value was 24.7% (Pr[Y=1|X=1]H0), and at 1 SD above the mean it was 60.6% (Pr[Y=1|X=1]H1). The two- tailed α level was 0.05 and the power (1–β) was 0.80. Based on these data, the total sample size was 159 and the power was 0.80 [26]. Second, the study group was selected from patients who visited our clinic but were not hospitalized. Although gly- cemic status reflected a less pronounced difference among pa- tients with different phenotypes of nerve damage by CPT grade, duration of diabetes was significantly associated with abnormal NCS results in bivariate logistic analyses after adjust- ing for age, sex, and HbA1c levels (OR, 1.09; 95% CI, 1.04 to 1.15; P=0.001). Therefore, the long-term effects of poor meta- bolic control and long duration of diabetes should be consid- ered when interpreting the results, because patients in this study were recruited at a tertiary hospital after referral for management of their hyperglycemia; the comorbidities, mean age, and HbA1c levels were relatively high; and the duration of diabetes was long [27,28]. Therefore, the results may not be generalizable to the whole population and must be interpreted with caution. Despite these limitations, we found that CPT is a
useful instrument for detecting differences in NCS variables between clinical phenotypes determined by CPT grade.
NCS is an indispensable tool in the evaluation of peripheral nerve abnormalities to confirm DPN [9], but it is of limited use for the evaluation of various clinical phenotypes. In this study, we found that NCS variables differed across patients with dia- betes according to clinical phenotype determined by CPT.
Moreover, decreased sural nerve velocities were associated with changes in the NCS variables even in non-DPN patients with hyperesthesia. These results support a more stratified or even personalized treatment approach in the future.
CONFLICTS OF INTEREST
No potential conflict of interest relevant to this article was re- ported.
ACKNOWLEDGMENTS
This work was supported by the grant from the Priority Re- search Centers Program and Basic Science Research Program through the National Research Foundation of Korea funded by the Ministry of Education, Science, and Technology (NRF- 2010-0020224, NRF-2015R1A2A1A13001900).
REFERENCES
1. American Diabetes Association. Standards of medical care in diabetes: 2016 abridged for primary care providers. Clin Dia- betes 2016;34:3-21.
2. Won JC, Kwon HS, Kim CH, Lee JH, Park TS, Ko KS, Cha BY.
Prevalence and clinical characteristics of diabetic peripheral neuropathy in hospital patients with type 2 diabetes in Korea.
Diabet Med 2012;29:e290-6.
3. Russell JW, Zilliox LA. Diabetic neuropathies. Continuum (Minneap Minn) 2014;20(5 Peripheral Nervous System Disor- ders):1226-40.
4. Inceu GV, Veresiu IA. Measurement of current perception thresholds using the Neurometer(R): applicability in diabetic neuropathy. Clujul Med 2015;88:449-52.
5. Koo BK, Ohn JH, Kwak SH, Moon MK. Assessment of diabetic polyneuropathy and autonomic neuropathy using current per- ception threshold in Korean patients with diabetes mellitus.
Diabetes Metab J 2014;38:285-93.
6. Matsutomo R, Takebayashi K, Aso Y. Assessment of peripheral
neuropathy using measurement of the current perception threshold with the neurometer in patients with type 2 diabetes mellitus. J Int Med Res 2005;33:442-53.
7. Feldman EL, Stevens MJ, Thomas PK, Brown MB, Canal N, Greene DA. A practical two-step quantitative clinical and elec- trophysiological assessment for the diagnosis and staging of di- abetic neuropathy. Diabetes Care 1994;17:1281-9.
8. Neurotron Inc. Professional feasibility report: Neurometer® electrodiagnostic evaluation in neurology. Baltimore, MD 2010.
9. Albers JW, Brown MB, Sima AA, Greene DA. Nerve conduc- tion measures in mild diabetic neuropathy in the Early Diabe- tes Intervention Trial: the effects of age, sex, type of diabetes, disease duration, and anthropometric factors. Tolrestat Study Group for the Early Diabetes Intervention Trial. Neurology 1996;46:85-91.
10. England JD, Gronseth GS, Franklin G, Miller RG, Asbury AK, Carter GT, Cohen JA, Fisher MA, Howard JF, Kinsella LJ, Latov N, Lewis RA, Low PA, Sumner AJ; American Academy of Neurology; American Association of Electrodiagnostic Medi- cine; American Academy of Physical Medicine and Rehabilita- tion. Distal symmetric polyneuropathy: a definition for clinical research: report of the American Academy of Neurology, the American Association of Electrodiagnostic Medicine, and the American Academy of Physical Medicine and Rehabilitation.
Neurology 2005;64:199-207.
11. Tesfaye S, Boulton AJ, Dyck PJ, Freeman R, Horowitz M, Kem- pler P, Lauria G, Malik RA, Spallone V, Vinik A, Bernardi L, Valensi P; Toronto Diabetic Neuropathy Expert Group. Dia- betic neuropathies: update on definitions, diagnostic criteria, estimation of severity, and treatments. Diabetes Care 2010;33:
2285-93.
12. AAEM Equipment and Computer Committee; American As- sociation of Electrodiagnostic Medicine. Technology review:
the neurometer current perception threshold (CPT). Muscle Nerve 1999;22:523-31.
13. Herman WH, Kennedy L. Underdiagnosis of peripheral neu- ropathy in type 2 diabetes. Diabetes Care 2005;28:1480-1.
14. Vas PR, Sharma S, Rayman G. Comment on Breiner et al. Does the prevailing hypothesis that small-fiber dysfunction precedes large-fiber dysfunction apply to type 1 diabetic patients? Dia- betes care 2014;37:1418-24. Diabetes Care 2014;37:e240-1.
15. Jimenez-Cohl P, Grekin C, Leyton C, Vargas C, Villaseca R.
Thermal threshold: research study on small fiber dysfunction in distal diabetic polyneuropathy. J Diabetes Sci Technol 2012;
6:177-83.
16. Rendell MS, Dovgan DJ, Bergman TF, O’Donnell GP, Drobny EP, Katims JJ. Mapping diabetic sensory neuropathy by current perception threshold testing. Diabetes Care 1989;12:636-40.
17. Katims JJ, Long DM, Ng LK. Transcutaneous nerve stimula- tion. Frequency and waveform specificity in humans. Appl Neurophysiol 1986;49:86-91.
18. Masson EA, Veves A, Fernando D, Boulton AJ. Current per- ception thresholds: a new, quick, and reproducible method for the assessment of peripheral neuropathy in diabetes mellitus.
Diabetologia 1989;32:724-8.
19. Pop-Busui R, Herman WH, Feldman EL, Low PA, Martin CL, Cleary PA, Waberski BH, Lachin JM, Albers JW; DCCT/EDIC Research Group. DCCT and EDIC studies in type 1 diabetes:
lessons for diabetic neuropathy regarding metabolic memory and natural history. Curr Diab Rep 2010;10:276-82.
20. Takekuma K, Ando F, Niino N, Shimokata H. Prevalence of hyperesthesia detected by current perception threshold test in subjects with glucose metabolic impairments in a community.
Intern Med 2002;41:1124-9.
21. The Diabetes Control and Complications Trial Research Group. The effect of intensive diabetes therapy on the develop- ment and progression of neuropathy. Ann Intern Med 1995;
122:561-8.
22. Tesfaye S, Wilhelm S, Lledo A, Schacht A, Tolle T, Bouhassira D, Cruccu G, Skljarevski V, Freynhagen R. Duloxetine and pre- gabalin: high-dose monotherapy or their combination? The
“COMBO-DN study”: a multinational, randomized, double- blind, parallel-group study in patients with diabetic peripheral neuropathic pain. Pain 2013;154:2616-25.
23. Hendriksen PH, Oey PL, Wieneke GH, Bravenboer B, Banga JD. Subclinical diabetic neuropathy: similarities between elec- trophysiological results of patients with type 1 (insulin-depen- dent) and type 2 (non-insulin-dependent) diabetes mellitus.
Diabetologia 1992;35:690-5.
24. Pastore C, Izura V, Geijo-Barrientos E, Dominguez JR. A com- parison of electrophysiological tests for the early diagnosis of diabetic neuropathy. Muscle Nerve 1999;22:1667-73.
25. Zhang Y, Li J, Wang T, Wang J. Amplitude of sensory nerve ac- tion potential in early stage diabetic peripheral neuropathy: an analysis of 500 cases. Neural Regen Res 2014;9:1389-94.
26. Faul F, Erdfelder E, Buchner A, Lang AG. Statistical power analyses using G*Power 3.1: tests for correlation and regression analyses. Behav Res Methods 2009;41:1149-60.
27. Holman RR, Paul SK, Bethel MA, Matthews DR, Neil HA. 10-
Year follow-up of intensive glucose control in type 2 diabetes.
N Engl J Med 2008;359:1577-89.
28. Martin CL, Albers J, Herman WH, Cleary P, Waberski B, Greene DA, Stevens MJ, Feldman EL; DCCT/EDIC Research
Group. Neuropathy among the diabetes control and complica- tions trial cohort 8 years after trial completion. Diabetes Care 2006;29:340-4.