This is an Open Access article distributed under the terms of the Creative Commons At- tribution Non-Commercial License (http://creativecommons.org/licenses/by-nc/3.0/) which permits unrestricted non-commercial use, distribution, and reproduction in any medium, provided the original work is properly cited.
Is A1C Variability an Independent Predictor for the Progression of Atherosclerosis in Type 2 Diabetic Patients?
Chul Sik Kim, So Young Park, Sung Hoon Yu, Jun Goo Kang, Ohk Hyun Ryu, Seong Jin Lee, Eun Gyung Hong, Hyeon Kyu Kim, Doo-Man Kim, Jae Myung Yoo, Sung Hee Ihm, Moon Gi Choi, Hyung Joon Yoo
Division of Endocrinology and Metabolism, Department of Internal Medicine, Hallym University Sacred Heart Hospital, Hallym University College of Medicine, Anyang, Korea
Background: Little is known about the relative contribution of long-term glycemic variability to the risk of macrovascular com- plications in type 2 diabetes. This study was conducted to evaluate the effect of A1C variability on the progression of carotid ar- tery intima-media thickness (IMT) in type 2 diabetic patients.
Methods: Among type 2 diabetic patients who visited Hallym University Sacred Heart Hospital from March 2007 to September 2009, 120 patients who had carotid artery IMT measured annually and A1C checked every three months for at least one year were analyzed. Individual A1C variability was defined as the standard deviation (SD) of five A1C levels taken every three months for approximately one year. Change in IMT was defined as an increase in IMT on follow-up measurement. The association be- tween the SD of A1C and changes in IMT was evaluated.
Results: With greater A1C variability, there was a greater increase in the mean IMT (r = 0.350, P < 0.001) of the carotid artery.
After adjusting for confounding factors that may influence IMT, A1C variability was significantly associated with the progression of IMT (r = 0.222, P = 0.034). However, the SD of A1C was not a significant independent risk factor for the progression of IMT in multiple regression analysis (β = 0.158, P = 0.093).
Conclusion: Higher A1C variability is associated with IMT progression in type 2 diabetic patients; however, it is not an indepen- dent predictor of IMT progression. Overall glycemic control is the most important factor in the progression of IMT.
Keywords: Carotid atherosclerosis; Diabetes mellitus, type 2; Glycemic variability
Corresponding author: Chul Sik Kim
Division of Endocrinology and Metabolism, Department of Internal Medicine, Hallym University Sacred Heart Hospital, 896 Pyeongchon-dong, Dongan-gu, Anyang 431-070, Korea
INTRODUCTION
Diabetes is characterized by a high incidence of accelerated atherosclerosis [1]. Although researchers have examined the roles of numerous factors involved in the macrovascular com- plications of diabetes, a precise judgment of their individual contributions remains challenging [2]. Diabetic complications are mainly dependent on dysglycemia [1,3], and diabetes is characterized by both sustained chronic hyperglycemia and acute glucose fluctuation, both of which lead to diabetic com-
plications [4].
Similar glycemic levels can be generated by different glucose profiles [4,5]. Among patients with similar glycemic levels, those with larger glucose variability might be at greater risk for devel- oping chronic complications [4-6]. There is firm evidence that postprandial glycemia is a stronger risk factor for the develop- ment of macrovascular complications than are fasting or pre- prandial concentrations [7,8]. Therefore, diabetic manage- ment primarily focuses on the attenuation of glycemic excur- sions following meals with the belief that glycemic control re- pISSN 1976-9180 · eISSN 2093-2650
duces the risk of cardiovascular disease [9]. However, little is known about the relative contribution of long-term glycemic variability to the risk of developing macrovascular complica- tions in type 2 diabetes.
Intima-media thickness (IMT) is a well-described surrogate marker for cardiovascular risk [10-13]. In cross-sectional anal- yses, increased IMT was correlated with myocardial infarction and stroke [14].
Understanding the risks of long-term glycemic variability is fundamental to the management of diabetes. In this study, we evaluated the relationship between A1C variability and the pro- gression of IMT in type 2 diabetic patients.
METHODS
Subjects
Among type 2 diabetic patients who visited Hallym University Sacred Heart Hospital from March 2007 to September 2009, patients who had annual carotid artery IMT measurements and who had their A1C level checked every three months for at least one year were enrolled. We analyzed data from patients who had visited the clinic on more than three consecutive oc- casions prior to enrollment since biochemical parameters such as A1C show marked changes after initial treatment (n = 120).
Exclusion criteria were type 1 diabetes; history or clinical evidence of coronary artery disease or cerebral or peripheral vascular disease; renal dysfunction (defined as creatinine blood level ≥ 2.0 mg/dL); hepatic dysfunction (defined as alanine ami- notransferase and/or aspartate aminotransferase blood level ≥ 3
× the upper normal limit); use of glucocorticoids; pregnancy;
severe concomitant disease such as cancer, infection, Cushing’s syndrome, acromegaly, or any other disorder likely to alter gly- cemia; primary hypercholesterolemia, hypothyroidism or hy- perthyroidism; use of any hormonal drugs; and alcoholism or drug abuse.
Hypertension was defined as systolic blood pressure of at least 140 mm Hg and/or a diastolic blood pressure of at least 90 mm Hg, use of antihypertensive drugs, or a combination of these parameters. Dyslipidemia was defined as an low density lipopro- tein cholesterol (LDL-C) level ≥ 100 mg/dL or an high density lipoprotein cholesterol (HDL-C) level < 40 mg/dL for men, < 50 mg/dL for women, or the use of lipid-lowering drugs. Protei- nuria was defined as a 24 hour albuminuria ≥ 30 mg/day.
Retinopathy was defined by at least one retinal microaneurysm with or without hemorrhages, venous beading, soft exudates,
or intraretinal microvascular abnormalities. Neuropathy was defined as the presence of bilateral pain and paresthesias in the lower limbs or the presence of a positive finding on the current perception threshold test. The protocol was approved by the Ethics Committee of Hallym University, and informed written consent was obtained from each participant.
Clinical characteristics
Height, weight, and blood pressure were measured for each par- ticipant, with blood pressure measured twice in a sitting posi- tion using a sphygmomanometer at the level of the heart. The average of the measurements was used as the reference data.
Body weight and height were measured in the morning with participants wearing light clothing. Body mass index (BMI) was calculated as body weight in kilograms divided by height in meters squared (kg/m2). Waist circumference was determined using a measuring tape placed midway between the lowest rib and the iliac crest, with the participant standing on a flat floor with feet 30 cm apart.
Biochemical characteristics
Blood samples were collected from subjects after more than 10 hours of fasting. A1C was determined using high-performance liquid chromatography (Variant II; Bio-Rad, Hercules, CA, USA).
Plasma glucose levels were measured immediately after sam- pling with an autoanalyzer, using the hexokinase method (Hi- tachi 747; Roche, Montclair, NJ, USA). Serum insulin levels were determined using an INS-IRMA Kit (BioSource Europe S.A., Nevelles, Belgium), and serum total cholesterol and HDL- C were measured using a direct enzymatic method (Hitachi 747; Daiichi, Tokyo, Japan). Serum triglyceride levels were mea- sured using an enzymatic colorimetric method (Hitachi 747;
Roche, Japan/Germany), and LDL-C was calculated using the Friedewald formula, i.e., total cholesterol - {(triglyceride/5) + HDL-C}. Insulin resistance was estimated after fasting using the homeostasis model assessment method (HOMA-IR): HOMA- IR = fasting insulin (μU/mL) × fasting plasma glucose (mmol/L) / 22.5. Individual A1C variability was defined as the standard deviation (SD) of five A1C levels taken every three months for about one year.
Carotid artery IMT
We measured IMT at baseline and after 12 months of follow-up.
Change in IMT was defined as an increase in IMT on the fol- low-up measurement. IMT was measured by one examiner us-
ing a B-mode ultrasound with an 8 MHz linear probe (Sequoia C512; Siemens, Munich, Germany). IMT was measured at three points of the common carotid artery 1 cm proximal to the bi- furcation, and the mean value of six measurements from the right and left carotid arteries was used. Reproducibility was fur- ther tested, and the day-to-day coefficient of variation was 4.5%
for carotid IMT measurements. Moreover, when calcifications or plaques showed heterogeneity in the area of IMT determi- nation, measurements were performed proximally in order to exclude plaques.
Statistics
Descriptive statistics are presented as mean values ± SD. Sub- jects were divided into three groups according to the individual A1C variability (SD of five A1C levels taken every three months for about one year).
Comparisons of clinical and physiological characteristics of each group were performed using ANOVA.
Partial correlation analysis was used to assess the significance of the relationship between A1C variability and the progression of carotid IMT after controlling for age, gender, diabetes dura- tion, menopause status, smoking status, hypertension status, dyslipidemia status, albuminuria status, BMI, waist circumfer- ence, blood pressure, LDL-C level, HDL-C level, HOMA-IR, fasting and postprandial glucose, mean A1C, baseline A1C, and use of medications likely to alter IMT (thiazolidinediones, statins, calcium channel blockers, angiotensin converting en- zyme inhibitors, angiotensin receptor blockers, anti-platelet agents). The inclusion of the controlling factors in partial cor- relation analysis removed the possibility of their contributions to the outcome [15].
Moreover, independent risk factors for progression of IMT were identified using multiple linear regression analysis. We selected all of the variables which showed a potential associa- tion (P < 0.20) with the progression of IMT in the correlation analysis [16]. We also entered known cardiovascular risk factors such as gender, BMI, diabetes duration, blood pressure, base- line IMT, and lipid levels into the model.
All statistical analysis was performed using SPSS for Windows 11.5 (SPSS Inc., Chicago, IL, USA), and P values less than 0.05 were considered to be statistically significant.
RESULTS
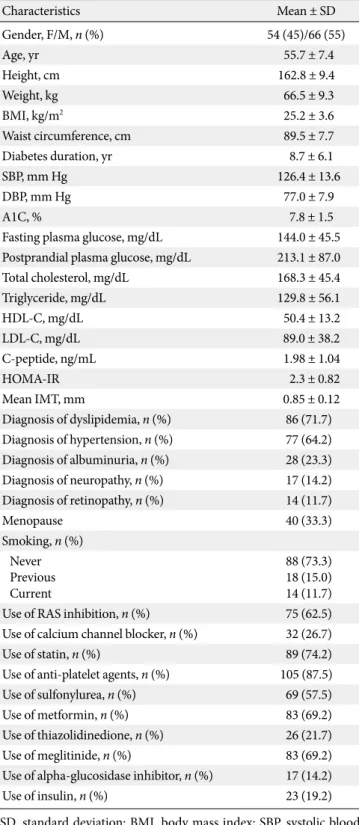
Table 1 shows the baseline clinical and biochemical character-
Table 1. Baseline clinical and biochemical data
Characteristics Mean ± SD
Gender, F/M, n (%) 54 (45)/66 (55)
Age, yr 55.7 ± 7.4
Height, cm 162.8 ± 9.4
Weight, kg 66.5 ± 9.3
BMI, kg/m2 25.2 ± 3.6
Waist circumference, cm 89.5 ± 7.7
Diabetes duration, yr 8.7 ± 6.1
SBP, mm Hg 126.4 ± 13.6
DBP, mm Hg 77.0 ± 7.9
A1C, % 7.8 ± 1.5
Fasting plasma glucose, mg/dL 144.0 ± 45.5 Postprandial plasma glucose, mg/dL 213.1 ± 87.0
Total cholesterol, mg/dL 168.3 ± 45.4
Triglyceride, mg/dL 129.8 ± 56.1
HDL-C, mg/dL 50.4 ± 13.2
LDL-C, mg/dL 89.0 ± 38.2
C-peptide, ng/mL 1.98 ± 1.04
HOMA-IR 2.3 ± 0.82
Mean IMT, mm 0.85 ± 0.12
Diagnosis of dyslipidemia, n (%) 86 (71.7) Diagnosis of hypertension, n (%) 77 (64.2) Diagnosis of albuminuria, n (%) 28 (23.3) Diagnosis of neuropathy, n (%) 17 (14.2) Diagnosis of retinopathy, n (%) 14 (11.7)
Menopause 40 (33.3)
Smoking, n (%) Never Previous Current
88 (73.3) 18 (15.0) 14 (11.7) Use of RAS inhibition, n (%) 75 (62.5) Use of calcium channel blocker, n (%) 32 (26.7)
Use of statin, n (%) 89 (74.2)
Use of anti-platelet agents, n (%) 105 (87.5)
Use of sulfonylurea, n (%) 69 (57.5)
Use of metformin, n (%) 83 (69.2)
Use of thiazolidinedione, n (%) 26 (21.7)
Use of meglitinide, n (%) 83 (69.2)
Use of alpha-glucosidase inhibitor, n (%) 17 (14.2)
Use of insulin, n (%) 23 (19.2)
SD, standard deviation; BMI, body mass index; SBP, systolic blood pressure; DBP, diastolic blood pressure; HDL-C, high density lipopro- tein cholesterol; LDL-C, low density lipoprotein cholesterol; HOMA- IR, homeostasis model assessment–insulin resistance; IMT, intima- media thickness; RAS inhibition, renin-angiotensin system inhibition with ACE inhibitor or angiotensin type 1 receptor antagonist.
A1C (%) A1C (%)
Month Month
Group 1 Mean A1C
Group 2 Group 3
0 3 6 9 12 0 3 6 9 12
11.0 10.0 9.0 8.0 7.0 6.0 5.0 4.0 3.0
10.0 9.5 9.0 8.5 8.0 7.5 7.0 6.5 6.0
A B
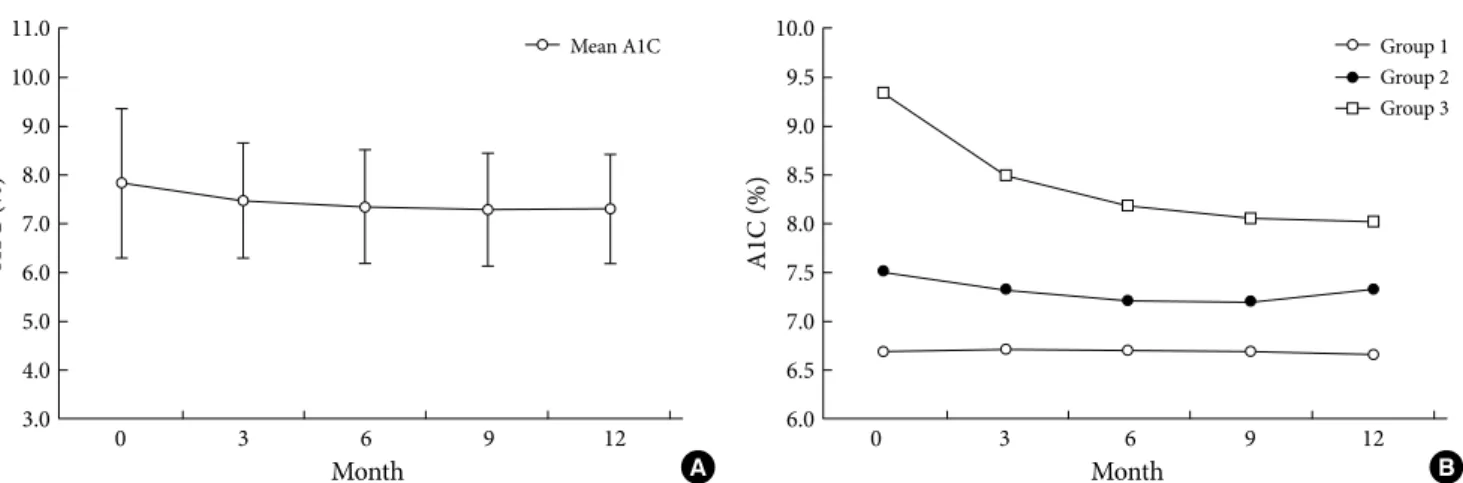
Fig. 1. Changes in A1C levels during the 12 months. (A) All subjects. (B) Groups according to A1C variability. Group 1, low A1C variability group; Group 2, intermediate A1C variability group; Group 3, high A1C variability group.
Table 2. Clinical and biochemical data according to A1C variability
A1C variability (tertiles) P
value Group I (n = 40) Group II (n = 40) Group III (n = 40)
Age, yr 57.3 ± 7.5 56.3 ± 6.7 53.5 ± 7.5 0.056
Height, cm 162.5 ± 8.5 161.4 ± 8.7 164.4 ± 10.9 0.357
Weight, kg 65.7 ± 8.6 65.7 ± 10.0 68.1 ± 9.4 0.412
BMI, kg/m2 24.9 ± 3.2 25.2 ± 3.5 25.4 ± 4.1 0.859
Waist circumference, cm 88.8 ± 7.0 89.4 ± 8.8 90.3 ± 7.3 0.693
Diabetes duration, yr 7.7 ± 5.2 9.3 ± 7.0 8.9 ± 5.9 0.463
SBP, mm Hg 126.9 ± 12.9 123.8 ± 15.0 128.7 ± 12.6 0.259
DBP, mm Hg 77.0 ± 8.0 75.0 ± 6.7 79.2 ± 8.4 0.060
A1C at baseline, % 6.7 ± 0.5 7.5 ± 1.2a 9.3 ± 1.3a,c 0.000
Mean A1C, % 6.7 ± 0.4 7.3 ± 1.0a 8.4 ± 1.0a,c 0.000
SD of A1C (min–max) 0.20 ± 0.07 (0.08 to 0.29) 0.42 ± 0.11a (0.29 to 0.62) 1.01 ± 0.30a,c (0.66 to 1.83) 0.000
Fasting plasma glucose, mg/dL 126.3 ± 36.8 144.1 ± 33.5b 161.7 ± 56.5b 0.002
Postprandial plasma glucose, mg/dL 186.2 ± 77.5 216.1 ± 89.0 237.2 ± 88.3b 0.030
Total cholesterol, mg/dL 167.6 ± 47.0 156.3 ± 27.1 181.0 ± 55.0 0.050
Triglyceride, mg/dL 128.2 ± 63.2 124.9 ± 51.0 136.4 ± 54.5 0.648
HDL-C, mg/dL 51.8 ± 12.5 49.6 ± 15.0 49.8 ± 12.3 0.726
LDL-C, mg/dL 85.8 ± 37.0 81.7 ± 26.3 99.7 ± 47.0 0.086
C-peptide, ng/mL 2.1 ± 1.1 1.9 ± 1.1 2.0 ± 0.9 0.819
HOMA-IR 2.2 ± 0.9 2.2 ± 0.8 2.4 ± 0.7 0.433
Mean IMT at baseline, mm 0.82 ± 0.11 0.85 ± 0.09 0.89 ± 0.12b 0.043
Data are means ± standard deviation (SD). Group I, low A1C variability group; Group II, middle A1C variability group; Group III, high A1C variability group. A1C variability status was defined according to the SDs of the means of five A1C levels taken every three months for about one year. Results were calculated using an ANOVA test.
BMI, body mass index; SBP, systolic blood pressure; DBP, diastolic blood pressure; HDL-C; high density lipoprotein cholesterol; LDL-C, low density lipoprotein cholesterol; HOMA-IR, homeostasis model assessment-insulin resistance; IMT, intima-media thickness.
aSignificantly different compared to Group I (P < 0.001), bSignificantly different compared to Group I (P < 0.05), cSignificantly different com- pared to Group II (P < 0.001).
istics of the subjects. The mean baseline IMT of the subjects was 0.85 ± 0.12 mm, and the mean progression of IMT was 0.04 ± 0.09 mm. The mean follow-up period was 369.7 ± 15.2 days.
Change of A1C over 12 months
Fig. 1A shows the changes in A1C level at three month intervals, illustrating that the levels gradually decreased over 12 months.
Fig. 1B demonstrates the changes in glucose level in the three groups with different A1C variabilities over a 12 month period.
The group with the highest A1C variability had the highest base- line A1C and experienced the greatest decrease in plasma glu- cose level, while the group with the lowest A1C variability had the lowest baseline A1C and had stable plasma glucose levels over the study period (Table 2, Fig. 1B).
Clinical and biochemical characteristics according to A1C variability
Tables 2, 3 demonstrate the clinical and biochemical character- istics of the three groups with different A1C variabilities. There were no differences in age, body size, duration of diabetes mel- litus, blood pressures, lipid profiles, insulin secretory function, insulin resistance, diagnoses of concurrent diseases, or diabetes- related drug history among the groups. However, the group
Table 3. Clinical data according to A1C variability A1C variability (tertiles)
valueP Group
(n = 40)I Group (n= 40)II
Group III (n = 40)
Gender, F/M 17/23 21/19 16/24 0.493
Diagnosis of dyslipidemia, n 32 34 29 0.082 Diagnosis of hypertension, n 26 24 27 0.776 Diagnosis of albuminuria, n 7 13 9 0.247 Diagnosis of neuropathy, n 8 6 3 0.291 Diagnosis of retinopathy, n 4 5 5 0.913
Menopause, n 14 16 10 0.350
Smoking status 0.623
Never 27 32 29
Previous 7 3 4
Current 6 5 7
A1C variability status was defined as a standard deviations of the means of five A1C levels taken every three months for about one year. Results were calculated using the chi-square test.
Group I, low A1C variability group; Group II, middle A1C variability group; Group III, high A1C variability group.
Table 4. Multiple regression analysis of the progression of carot- id IMT
Independent variable β P value
Age, yr 0.110 0.394
Gender (F = 0, M = 1) -0.160 0.108
BMI, kg/m2 0.077 0.426
Diabetes duration, yr -0.071 0.474
SBP, mm Hg -0.023 0.864
DBP, mm Hg 0.098 0.480
Baseline IMT, mm 0.018 0.853
A1C, % 0.129 0.658
Mean A1C, % 0.314 0.043
SD of A1C 0.158 0.093
Fasting blood glucose, mg/dL 0.298 0.046
Postprandial plasma glucose, mg/dL 0.253 0.095
HDL-C, mg/dL -0.067 0.485
LDL-C, mg/dL 0.009 0.924
Triglyceride, mg/dL -0.153 0.107
Menopause (No = 0, Yes = 1) 0.018 0.906
Use of anti-platelet agents (No = 0, Yes = 1) -0.237 0.113 BMI, body mass index; SBP, systolic blood pressure; DBP, diastolic blood pressure; SD, standard deviation; HDL-C; high density lipo- protein cholesterol; LDL-C, low density lipoprotein cholesterol; IMT, intima-media thickness.
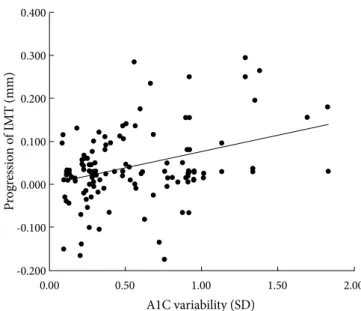
Fig. 2. Correlation between A1C variability and progression of IMT of the carotid artery. r = 0.350, P < 0.001 (r = 0.222, P = 0.034 after adjusting for confounding factors). IMT, intima- media thickness; SD, standard deviation.
Progression of IMT (mm)
A1C variability (SD)
0.00 0.50 1.00 1.50 2.00
0.400 0.300 0.200 0.100 0.000 -0.100 -0.200
with the greatest A1C variability had the highest baseline and mean A1C level compared to those of the other groups (Table 2). The A1C variability was also closely related to the mean A1C of all patients (r = 0.676, P < 0.001).
A1C variability and progression of IMT
We found that, with greater A1C variability, there was a greater increase in the IMT (r = 0.350, P < 0.001) of the carotid artery (Fig. 2). Although this relationship weakened after adjusting for confounding factors that can influence the progression of IMT, it remained statistically significant (r = 0.222, P = 0.034, Fig. 2).
Multiple regression analysis of the progression of IMT In order to evaluate factors that influence the progression of IMT, multiple regression analysis was performed. Mean A1C (β = 0.314, P = 0.043) and fasting plasma glucose (β = 0.298, P = 0.046) were found to be independent predictors of the progres- sion of IMT (Table 4). However, the SD of A1C was not a sig- nificant independent risk factor for the progression of IMT in multiple regression analysis (β = 0.158, P = 0.093).
DISCUSSION
This study demonstrates that the long-term variability in A1C level has no significant influence on the progression of carotid atherosclerosis in patients with type 2 diabetes. Although A1C variability over 12 months was found to be associated with the progression of IMT, overall glycemic control is the most impor- tant factor in the progression of IMT.
Recently, Kilpatrick et al. [5] concluded that A1C variability may be an additional risk factor for the development of micro- vascular complications in type 1 diabetic patients. Previously, they had reported that daily glucose variability, as measured on a quarterly eight-point glucose profile, was not associated with the development or progression of retinopathy or nephropathy [17]. It has also been suggested that A1C variability might play an important role in the development of long-term macrovas- cular complications in type 1 diabetes [6].
Few studies have been conducted to evaluate the relation- ship between glycemic variability and the development of mac- rovascular complications in type 2 diabetics, the major cause of diabetic mortality. Previously, Muggeo et al. [18] reported that long-term instability in fasting plasma glucose concentra- tions was an independent predictor of cardiovascular-related
five-year mortality in elderly type 2 diabetic patients with a mean age of 80 years and a short life expectancy. Subsequently, they confirmed these result over a period of 10 years in type 2 dia- betics with an age range of 56-74 years [17]. The relationship between the variability of fasting plasma glucose and cardiovas- cular mortality could result from more frequent hypoglycemia, which predisposes patients to adverse outcomes [19,20].
When patients are exposed to hyperglycemia more frequent- ly and for longer periods, more hyperglycemia-related compli- cations are likely to develop because frequent exposure to hy- perglycemia leads to excessive protein glycation and increased oxidative stress [4]. Also, there is data on the effect of glycemic changes on free radical production [21]. Moreover, sustained hyperglycemia has lasting effects, and patients are at higher risk for complications [22,23]. Therefore, the harmful effect of gly- cemic variability may be mediated through a mechanism sim- ilar to that underlying “metabolic memory” [22,24].
It remains unclear whether long-term glucose variability (week-to-week, as measured by A1C) has a similar influence on the development or progression of macrovascular compli- cations in type 2 diabetics to that of short-term glucose insta- bility (day-to-day, as measured by fasting plasma glucose). Our study demonstrates that long-term glucose variability, measured by A1C variability, has no significant influence on the progres- sion of carotid atherosclerosis in patients with type 2 diabetes.
Therefore, we conclude that A1C variability has no influence on the development of cardiovascular events. Instead of A1C variability, overall glycemic control was revealed to be the im- portant factor in determining the progression of carotid ath- erosclerosis in type 2 diabetes.
In our study, there are several possible reasons that A1C vari- ation itself was not revealed as an independent risk factor for the progression of atherosclerosis. First, this study was conduct- ed on a relatively low-risk group for cardiovascular diseases (no past history of cardiovascular diseases, relatively good glucose control state at baseline, limited lipid and blood pressure prob- lems, and a small number of smokers). Therefore, the progres- sion of atherosclerosis in this group may have been slow. More- over, we did not exclude patients receiving medications likely to alter IMT (statins, ACE inhibitors, angiotensin receptor block- ers, and anti-platelet agents). Finally, 12 months is a relatively short period in which to assess meaningful progression of ca- rotid atherosclerosis.
In our study, regression of IMT was found in 28 subjects.
These patients had a shorter duration of diabetes (7.1 ± 4.1 vs.
9.1 ± 6.5 year, P = 0.049) and a lower mean A1C level (7.1 ± 0.9 vs. 7.8 ± 1.1%, P = 0.020) compared to those of subjects with progression of IMT. These results suggest that diabetic patients of long duration and poor glycemic control are prone to athero- sclerosis development [15].
Frequent hypoglycemia predisposes patients to cardiovascu- lar events in type 2 diabetes [20]. The stability of fasting plasma glucose seems to be protective and variability seems to be harm- ful. Moreover, postprandial glucose is a predictor of cardiovas- cular disease and its measurement is the other component of glycemic variability [25,26]. Change in IMT was significantly correlated with change in postprandial glucose rather than that of fasting glucose [9]. A1C is a standard clinical assessment of glycemia and is the basis of most data relating glycemic control to diabetic complications [27,28]. A1C reflects mean blood glu- cose levels including both fasting and postprandial glucose lev- els [25] and is not affected by glycemic instability [29]. There- fore, it is possible that A1C variability is not a sensitive measure for detecting the effects of hypoglycemia.
There is a tendency for greater A1C variability in subjects with poor glycemic control, and our study showed a strong cor- relation between A1C variability and baseline A1C as well as mean A1C over 12 months. After adjusting for glucose level, the correlation between A1C variability and IMT progression was attenuated.
We analyzed subjects with poor glycemic control (n = 40). As a result, the correlation between A1C variability and the pro- gression of IMT was stronger than that of all subjects (r = 0.413, P = 0.008). Although this relationship was weakened after ad- justing for confounding factors that can influence the progres- sion of IMT, it remained statistically significant (r = 0.329, P = 0.012). However, in multiple regression analysis, A1C variabil- ity was not a significant independent risk factor for the progres- sion of IMT (β = 0.256, P = 0.254).
In our study, glycemic status was a significant determining factor for the progression of IMT in type 2 diabetic patients.
This finding indicates that blood glucose control may play the principal role in interventions to inhibit an increase of IMT in type 2 diabetics. Although overall glycemic control is the most important factor in the progression of IMT, this does not nec- essarily mean that glycemic variability is not important in de- termining outcomes in type 2 diabetes. Global anti-diabetic strategy should be aimed first at improving glycemic control and then at minimizing the different components of dysglyce- mia (especially hypoglycemia) in order to avoid excess risk of
long-term complications [30].
There are several possible limitations in our study. First, the subjects were not randomly selected and the study was prospec- tively designed. Moreover, the modifications in individual med- ication dosages over the 12 months were not reflected in the results.
In conclusion, relatively long-term variability in A1C levels appears to be associated with progression in IMT over 12 months.
However, the A1C variability itself was not revealed as an inde- pendent risk factor for the increase in IMT during the 12 month study period. Rather than A1C variability, overall glycemic con- trol was the most important factor for the progression of carotid IMT. However, considering the gradual increase in IMT, a lon- ger follow-up period may be needed to assess A1C variability as an independent predictor of progression of atherosclerosis in type 2 diabetic patients.
ACKNOWLEDGEMENT
This work was supported by the Health Fellowship Founda- tion (2007).
REFERENCES
1. Stratton IM, Adler AI, Neil HA, Matthews DR, Manley SE, Cull CA, Hadden D, Turner RC, Holman RR. Association of glycaemia with macrovascular and microvascular complica- tions of type 2 diabetes (UKPDS 35): prospective observation- al study. BMJ 2000;321:405-12.
2. Laakso M, Lehto S. Epidemiology of macrovascular disease in diabetes. Diabetes Rev 1997;5:294-315.
3. The relationship of glycemic exposure (HbA1c) to the risk of development and progression of retinopathy in the diabetes control and complications trial. Diabetes 1995;44:968-83.
4. Monnier L, Colette C. Glycemic variability: should we and can we prevent it? Diabetes Care 2008;31 Suppl 2:S150-4.
5. Kilpatrick ES, Rigby AS, Atkin SL. A1C variability and the risk of microvascular complications in type 1 diabetes: data from the Diabetes Control and Complications Trial. Diabetes Care 2008;31:2198-202.
6. Prince CT, Becker DJ, Costacou T, Miller RG, Orchard TJ.
Changes in glycaemic control and risk of coronary artery dis- ease in type 1 diabetes mellitus: findings from the Pittsburgh Epidemiology of Diabetes Complications Study (EDC). Dia- betologia 2007;50:2280-8.
7. Home P. Contributions of basal and post-prandial hypergly- caemia to micro- and macrovascular complications in people with type 2 diabetes. Curr Med Res Opin 2005;21:989-98.
8. Ceriello A. Postprandial hyperglycemia and diabetes compli- cations: is it time to treat? Diabetes 2005;54:1-7.
9. Esposito K, Giugliano D, Nappo F, Marfella R. Regression of carotid atherosclerosis by control of postprandial hyperglyce- mia in type 2 diabetes mellitus. Circulation 2004;110:214-9.
10. Hulthe J, Wikstrand J, Emanuelsson H, Wiklund O, de Feyter PJ, Wendelhag I. Atherosclerotic changes in the carotid artery bulb as measured by B-mode ultrasound are associated with the extent of coronary atherosclerosis. Stroke 1997;28:1189-94.
11. Hu Y, Liu W, Huang R, Zhang X. Postchallenge plasma glucose excursions, carotid intima-media thickness, and risk factors for atherosclerosis in Chinese population with type 2 diabetes.
Atherosclerosis 2010;210:302-6.
12. Butt MU, Zakaria M. Association of common carotid intimal medial thickness (CCA-IMT) with risk factors of atherosclero- sis in patients with type 2 diabetes mellitus. J Pak Med Assoc 2009;59:590-3.
13. Ho HC, Chen MF, Hwang JJ, Lee YT, Su TC. Intima-media thick- ness of lower-limb arteries associated with fasting and post- challenge plasma glucose levels. J Atheroscler Thromb 2009;
16:748-55.
14. Touboul PJ, Elbaz A, Koller C, Lucas C, Adrai V, Chedru F, Amarenco P. Common carotid artery intima-media thickness and brain infarction: the Etude du Profil Génétique de l’Infarctus Cérébral (GENIC) case-control study. The GENIC Investiga- tors. Circulation 2000;102:313-8.
15. Yokoyama H, Katakami N, Yamasaki Y. Recent advances of in- tervention to inhibit progression of carotid intima-media thick- ness in patients with type 2 diabetes mellitus. Stroke 2006;37:
2420-7.
16. Park SW, Kim SK, Cho YW, Kim DJ, Song YD, Choi YJ, Huh BW, Choi SH, Jee SH, Cho MA, Lee EJ, Huh KB. Insulin resis- tance and carotid atherosclerosis in patients with type 2 diabe- tes. Atherosclerosis 2009;205:309-13.
17. Kilpatrick ES, Rigby AS, Atkin SL. The effect of glucose variabil- ity on the risk of microvascular complications in type 1 diabetes.
Diabetes Care 2006;29:1486-90.
18. Muggeo M, Verlato G, Bonora E, Zoppini G, Corbellini M, de Marco R. Long-term instability of fasting plasma glucose, a novel predictor of cardiovascular mortality in elderly patients with non-insulin-dependent diabetes mellitus: the Verona Di-
abetes Study. Circulation 1997;96:1750-4.
19. Muggeo M, Zoppini G, Bonora E, Brun E, Bonadonna RC, Moghetti P, Verlato G. Fasting plasma glucose variability pre- dicts 10-year survival of type 2 diabetic patients: the Verona Diabetes Study. Diabetes Care 2000;23:45-50.
20. Frier BM. Hypoglycaemia in the diabetic adult. Baillieres Clin Endocrinol Metab 1993;7:757-77.
21. DeFronzo RA, Ferrannini E. Insulin resistance: a multifaceted syndrome responsible for NIDDM, obesity, hypertension, dys- lipidemia, and atherosclerotic cardiovascular disease. Diabetes Care 1991;14:173-94.
22. Muis MJ, Bots ML, Grobbee DE, Stolk RP. Insulin treatment and cardiovascular disease; friend or foe? A point of view. Dia- bet Med 2005;22:118-26.
23. Davi G, Ciabattoni G, Consoli A, Mezzetti A, Falco A, Santarone S, Pennese E, Vitacolonna E, Bucciarelli T, Costantini F, Ca- pani F, Patrono C. In vivo formation of 8-iso-prostaglandin f2alpha and platelet activation in diabetes mellitus: effects of improved metabolic control and vitamin e supplementation.
Circulation 1999;99:224-9.
24. Nathan DM, Cleary PA, Backlund JY, Genuth SM, Lachin JM, Orchard TJ, Raskin P, Zinman B. Intensive diabetes treatment and cardiovascular disease in patients with type 1 diabetes. N Engl J Med 2005;353:2643-53.
25. Donahue RP, Abbott RD, Reed DM, Yano K. Postchallenge glu- cose concentration and coronary heart disease in men of Japa- nese ancestry. Honolulu Heart Program. Diabetes 1987;36:
689-92.
26. Coutinho M, Gerstein HC, Wang Y, Yusuf S. The relationship between glucose and incident cardiovascular events: a metare- gression analysis of published data from 20 studies of 95,783 individuals followed for 12.4 years. Diabetes Care 1999;22:233- 40.
27. Bunn HF, Gabbay KH, Gallop PM. The glycosylation of hemo- globin: relevance to diabetes mellitus. Science 1978;200:21-7.
28. Gonen B, Rubenstein A, Rochman H, Tanega SP, Horwitz DL.
Haemoglobin A1: an indicator of the metabolic control of dia- betic patients. Lancet 1977;2:734-7.
29. Derr R, Garrett E, Stacy GA, Saudek CD. Is HbA(1c) affected by glycemic instability? Diabetes Care 2003;26:2728-33.
30. Hirsch IB, Brownlee M. Should minimal blood glucose variabil- ity become the gold standard of glycemic control? J Diabetes Complications 2005;19:178-81.